HAL Id: hal-01087725
https://hal.archives-ouvertes.fr/hal-01087725
Submitted on 7 May 2021
HAL is a multi-disciplinary open access
archive for the deposit and dissemination of
sci-entific research documents, whether they are
pub-lished or not. The documents may come from
teaching and research institutions in France or
abroad, or from public or private research centers.
L’archive ouverte pluridisciplinaire HAL, est
destinée au dépôt et à la diffusion de documents
scientifiques de niveau recherche, publiés ou non,
émanant des établissements d’enseignement et de
recherche français ou étrangers, des laboratoires
publics ou privés.
cover on heatwave temperatures over central France
M. Stéfanon, S. Schindler, P. Drobinski, N. de Noblet-Ducoudré, F. d’Andrea
To cite this version:
M. Stéfanon, S. Schindler, P. Drobinski, N. de Noblet-Ducoudré, F. d’Andrea. Simulating the effect of
anthropogenic vegetation land cover on heatwave temperatures over central France. Climate Research,
Inter Research, 2014, 60 (2), pp.133-146. �10.3354/cr01230�. �hal-01087725�
1. INTRODUCTION
The distribution of vegetation around the globe follows diverse environmental constraints, including climatic, geological, biogeochemical and anthropo -genic factors. Human influence alters vegetation dis-tribution through CO2 emissions and its
conse-quences on climate, as well as through land use
changes. While climate change could cause shifts in vegetation distribution during the 21st century (Bakkenes et al. 2002, Cox et al. 2004), deforestation for the extension of agricultural surfaces has shaped European and Mediterranen landscapes since the Roman era. During the last 50 yr, land cover change (LCC) slowed down in Eu rope and agricultural sur-faces even diminished in some regions as indicated
© Inter-Research 2014 · www.int-res.com *Corresponding author: marc.stefanon@u-psud.fr
Simulating the effect of anthropogenic vegetation
land cover on heatwave temperatures over
central France
M. Stéfanon
1,*, S. Schindler
2, P. Drobinski
2, N. de Noblet-Ducoudré
3, F. D’Andrea
2 1Laboratoire d’Écologie Systématique et Évolution (ESE), CNRS/UPSUD/AgroParisTech, Orsay, France2Laboratoire de Météorologie Dynamique (LMD) - Institut Pierre Simon Laplace, CNRS/Ecole Polytechnique/ENS/UPMC, Paris, France
3Laboratoire des Sciences du Climat et de l’Environnement (LSCE) - Institut Pierre Simon Laplace, CEA/CNRS/UVSQ, Gif sur Yvette, France
ABSTRACT: Events similar to the 2003 heatwaves in France are likely to become more frequent, more intense and longer by the end of the 21st century. Policies for climate mitigation focus on car-bon sequestration techniques while land cover change (LCC) may be a better short-term alterna-tive at regional level. However, LCC impact studies conducted so far have often given contradic-tory results at mid-latitudes for summer temperature. Using a regional climate model, the impact of an afforestation scenario is evaluated for the years 2002 and 2003, and compared to an agricul-tural scenario. The favorable meteorological conditions in spring 2003 promote the development of agricultural vegetation compared to (1) conditions in 2002 and (2) tree phenology in the forested scenario. This dampens the extreme values of temperature from April to the end of June 2003 (up to 3°C during the June heatwave). From early July to October, drought conditions cause crop failure, while forests are not affected by the lack of soil moisture owing to a deeper root system. Eva -po transpiration is therefore smaller in the agricultural scenario, thus amplifying the July−August extreme temperatures. However this cooling capacity of trees in the afforestation scenario is lim-ited during the August heatwave because the high temperatures reach a critical level above which the stomata close and transpiration is inhibited. Our experimental set-up highlights the role of climate−vegetation interactions during extreme events and demonstrates how choices of vegetation cover (e.g. trees versus crops) may substantially modify the summer temperatures in mid-latitude regions.
KEY WORDS: Heatwave · Vegetation · Land cover change · Phenology · Regional climate model · Afforestation
by Food and Agriculture Organization (FAO) statis-tics (Pielke et al. 2011).
LCC also feeds back on the climate itself, this im-pact being difficult to assess in observational systems because of its spatial heterogeneity and be cause of the difficulty in isolating the effects of LCC from other effects. Changes in vegetation distribution af fect a multitude of parameters including albedo, surface roughness, evapotranspiration and the water cycle in general (Heck et al. 2001). For example, the partition-ing of turbulent heat fluxes plays a role in the dynam-ics of the planetary boundary layer height and deter-mines the moist energy available, hence influencing the development of convective clouds and precipita-tion. The impacts of LCC can change de pending on the initial vegetation distribution (change from grass to trees, or vice versa) and the surrounding environ-ment (homogenization or structural diversification of the landscape). While several authors estimate the global influence of LCC in comparison to greenhouse gas forcing to be weak (Forster et al. 2007, Wramneby et al. 2010, Gálos et al. 2011), they also acknowledge that the climatic effect is not negligible on the re-gional weather (Findell et al. 2007, Pitman et al. 2009, Gálos et al. 2011) and affirm the need for further research (Pielke et al. 2011).
While the Intergovernmental Panel for Climate Change (IPCC) 4th Assessment Report (AR4) did not take into account LCC, in AR5 each representa-tive concentration pathway (RCP) has its own LCC scenario: the least conservative modifies 9% of the total surface in the Mediterranean area. However, modellers have also imagined several more drastic deforestation (afforestation) scenarios in order to shed light on the physical processes at play in the LCC− climate interactions. Changes in forest cover have an impact first of all on the water balance in tropical latitudes, while it is the energy balance via the surface albedo that reacts most sensitively at high latitudes (Jackson et al. 2008, Davin & de Noblet-Ducoudré 2010). Over tropical areas (Ama-zonia), typical deforestation scenarios involve the tropical rainforest being replaced by pasture. Sur-face warming results from a lower evaporative cool-ing than in the forest, slightly dampened by higher pasture albedo (Lean & Rowntree 1997, von Randow et al. 2004). At boreal latitudes, forest expansion tends to warm the surface through a snow masking effect, snow-covered forest albedo being by far infe-rior to snow-covered grassland albedo (Chalita & Le Treut 1994, Meissner et al. 2003). At mid-latitudes, both mechanisms are moderately at work and com-peting against each other so that the impact of LCC
on summer temperature can be positive or negative (Bonan et al. 2008).
In the Mediterranean, these studies tend to agree that LCC has a significant impact on regional climate through changes in evapotranspiration. The results of these modeling studies are somewhat contradictory, and appear to be strongly dependent on the experi-mental setup, specificities of the land surface model and vegetation parameterization. For example, ac-cording to Gaertner et al. (2001), deforestation causes a decrease in evapotranspiration, while the same ef-fect was observed by Anav et al. (2010a) and Zam pieri & Lionello (2011) for the opposite land cover change: af forestation reduced evapotranspiration and in -creased sensible heat flux during summer. Heck et al. (2001) suggested that an afforested Mediterranean could result in a moister and cooler climate from April to mid-July, until evapotranspiration is inhibited be-cause the soil moisture decreases to a critical value.
The heatwaves of June and August 2003 in West-ern Europe are the result of a combination of a per-sistent synoptic circulation pattern amplified by local soil moisture deficit and vegetation feedbacks (Schär et al. 2004, Fischer et al. 2007, Stéfanon et al. 2012b). A warm sea surface temperature in the Atlantic Ocean and the Mediterranean was also related to the 2003 heatwaves. Warmer SSTs are associated with a strengthening of the persistent anticyclonic situation over Europe (e.g. Cassou et al. 2005, Della-Marta et al. 2007, Feudale & Shukla 2010). Although such heatwaves remain exceptional, several studies have shown that, associated with an increase in tempera-ture mean and variability in the context of global warming, these phenomena have become not only more frequent but also longer and more intense dur-ing the 20th century (Easterldur-ing et al. 2000, Klein Tank et al. 2005, Della-Marta et al. 2007) — a trend that could continue in the 21st century (Beniston 2004, Ballester et al. 2010).
So far, most of the research on land−climate inter-actions has focused on the feedback between climate and soil moisture or on the impacts of climatic vari-ability on species distribution and phenology. Few articles have attempted to evaluate the feedback mechanisms that vegetation can exert on meteoro-logical fields (for a review see Pielke et al. 2011). In this study we use numerical modeling to investigate the effects of LCC on climate–vegetation interactions during the 2003 summer heatwaves. We test the sen -si tivity of climate to a hypothetical absence of human activities, replacing all kind of crops with forest and natural grass. This scenario, which we call the ‘potential vegetation’ scenario, clearly does not
rep-resent a realistic land cover perturbation; instead, it aims to compare the maximum effects of human action on a specific climate extreme through LCC.
For this purpose, we use the non-hydrostatic Weather and Research Forecasting (WRF) model coupled with the ORCHIDEE (ORganizing Carbon and Hydrology In Dynamic EcosystEms) land-surface model, which explicitly computes photosyn-thesis, vegetation carbon cycle and phenology. The do main of the simulation is shown in Fig. 1. It cor -re sponds to an a-rea whe-re heatwave patterns appear recurrently (Stéfanon et al. 2012a) and soil− atmosphere interactions are a key element of heat-wave preconditionning (Fischer et al. 2007). Vautard et al. (2007) and Zampieri et al. (2009) highlighted that drought and heat can spread northward from Southern Europe, amplifying the heatwaves in cen-tral Europe. However, in our experiment, such a mechanism is not explicitly simulated because of the domain size but is partially represented through our boundary conditions.
2. MODEL CONFIGURATION AND SIMULATION SET-UP
2.1. Model
We use the Model of the Regional Coupled Earth system (MORCE) to represent physical, biophysical and biogeochemical interactions between atmos-phere, land and ocean surfaces (Drobinski et al. 2012). The version used here was developed at IPSL (Institut Pierre Simon Laplace) and includes the WRF model and the ORCHIDEE land-surface model.
The WRF model of the National Center for Atmo -spheric Research (NCAR) (Skamarock et al. 2008) has already been used to investigate the effect of inter active vegetation on the amplitudes of the sum-mer 2003 heatwaves (Stéfanon et al. 2012b).
The domain of integration covers part of continen-tal France with a horizoncontinen-tal resolution of 15 km (see red box in Fig. 1). It has 28 sigma-levels in the verti-cal. Initial and lateral conditions are from the ERA-Interim reanalysis of the European Centre for Medium-Range Weather Forecasts (ECMWF; Dee et al. 2011) provided every 6 h with a 0.75° × 0.75° lon-gitude−latitude resolution.
WRF is coupled to the land surface model ORCHIDEE, which is based on 3 different modules (Krinner et al. 2005). (1) SECHIBA (Schématisation des EChanges Hydriques à l’Interface entre la Biosphère et l’Atmosphère), describes the fast
pro-cesses such as the soil water budget and the exchanges of energy, water and CO2through
photo-synthesis between the atmosphere and the biosphere (Ducoudré et al. 1993, Viovy & de Noblet-Ducoudré 1997). (2) The phenology and carbon dynamics of the terrestrial biosphere are simulated by the STOMATE module (Saclay Toulouse Orsay Model for the Analy-sis of Terrestrial Ecosystems). STOMATE essentially simulates processes such as maintenance and growth respiration, carbon allocation, litter decomposition, soil carbon dynamics, and phenology. (3) The Lund Postdam Jena (LPJ; vegetation dynamics) submodel, which simulates vegetation dynamics and is also included in ORCHIDEE, is not activated for this work. Soil hydrology follows the Choisnel model: 2 distinct layers store the water in an upper and a lower reservoir (Ducoudré et al. 1993). Soil moisture in the upper layer is the most reactive. It is deter-mined by moisture convergence but is more complex than a bucket since its depth varies in time. If rainfall occurs, soil is filled from top to bottom, and when eva -potranspiration exceeds rainfall, water is removed from the upper level where it is available.
Hydrological balance is computed for each plant functional type (PFT), and the various water reser-voirs are independent horizontally. According to their root depth profile, the PFTs are able to reach either the superficial reservoir or both reservoirs to
Fig. 1. Integration domain of the simulations (box) over continental France
ex tract water. Vegetation in ORCHIDEE is repre-sented by 12 PFTs, including 2 agricultural PFTs for 2 different photosynthetic pathways (C3 and C4), and
bare soil. Each grid cell is partitioned into the various PFTs. Surface roughness depends on tree height and leaf area index (LAI). Albedo depends on soil color and moisture, PFT type and LAI. Phenology is PFT-specific and has temperature or/and humidity based trigger values for leaf-onset and senescence. Incom-ing radiation is attenuated by the vegetation canopy according to the Beer-Lambert law, while there is no vertical gradient of humidity and CO2concentration
inside the canopy. Stomatal conductance (Gs) is a
function that depends on photosynthesis (A), atmo
-spheric relative humidity (hr) and CO2concentration
at the leaf surface (Ca) (Ball 1987, Collatz et al. 1991,
Farquhar et al. 1980):
(1)
Gs,slopeand Gs,offsetare empirical parameters. In the
absence of photosyntesis (A = 0), the stomatal
con-ductance decreases to its minimum (1.10−2mmol m−2 s−1for all PFTs). A is defined as:
(2) where Γ is a unitless coefficient representing the dis-tance from the tipping point between the CO2uptake
by photosynthesis and CO2emission by
photorespi-ration and cellular respiphotorespi-ration, and Rd is the
mito-chondiral respiration. Γ and Rddepend on leaf
inter-nal CO2 concentration and dark respiration. A also
depends on plant physiological condition (Vc) and
incoming solar radiation (Vj). The quantity Vc is
directly proportional to the maximal carboxylation rate Vcmax. This rate is a function of 3 unitless factors
between 0 and 1, corresponding to water stress, heat stress and leaf age (εwater, εtemp, and εleafrespectively):
(3) where Vcmax,optis an empirical parameter. High stress
is associated with low value of εwater, εtemp, and εleaf,
while high values close to 1 indicate a low stress and a maximum Vcmaxvalue. When incoming solar
radia-tion is low, i.e. when Vjis expected to be smaller than
Vc(Vcmax), A only depends on Vj(see Eq. 2). During
daytime and under sunny weather conditions, as will be investigated in this study, one expects Vjto
be larger than Vc(Vcmax), and so A only depends on
Vc(Vcmax) (see Eq. 2). The quantity εwateris computed
through a water uptake function. It is related to the exponential structure of the root system and vertical soil moisture profile and represents the roots’ ability
to extract water from the soil for a given humidity. Photosynthesis limitation by temperature (εtemp) is
modeled by a parabolic response to air temperature, with a minimum, optimum and maximum tempera-ture value specific to each PFT. Beyond the maximum temperature, εtemp= 0 and thus A = 0 (see Eqs. 2 & 3).
2.2. Numerical experiments
For the years 2002 and 2003, 2 simulations were performed, one with the current vegetation distribu-tion (CUR simuladistribu-tion) and one with a potential vege-tation distribution (POT simulation). No spin-up of the model was performed, but soil moisture reaches an ‘equilibrium’ after 4 mo (with a remaining much slower evolution that does not affect the results of the study). Indeed, winter rainfall replenishes the soil until saturation, and equilibrium is reached before the summer months.
The vegetation map was obtained from the Ad -vanced Very High Resolution Radiometer (AVHRR) satellite observations between 1992 and 1993 (Love-land et al. 2000). In ORCHIDEE, this map was reclassified with respect to the 12 PFTs and a desert cate -gory at a 5 km horizontal resolution. It will be re ferred to as the CUR map hereafter. For the poten-tial vegetation map (hereafter POT map), the CUR map was aggregated to a 0.5° × 0.5° longitude− latitude re solution, and the surface fractions occu-pied by agricultural land uses were replaced by the dominant natural PFTs. Finally, the POT and CUR maps were interpolated and aggregated, respectively, to the simulation horizontal resolution of 15 km. Since we compare 2 opposite scenarios of land cover (POT and CUR), the difference between the 2 sim -ulations is large compared to the difference that an updated version of ORCHIDEE vegetation map would produce. Work is ongoing to produce an updated vegetation map.
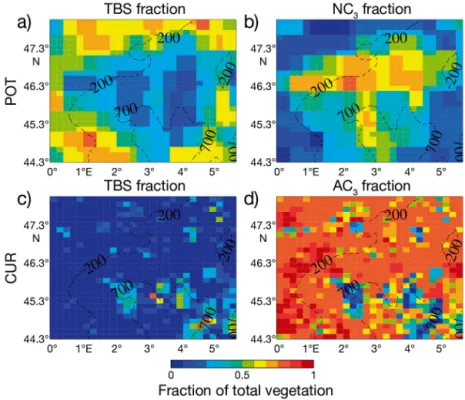
On average over the whole domain, LCC in the POT map is ~90% of the CUR map, meaning that 90% of the total surface has changed its dominant PFT. The distribution of vegetation in the 2 integra-tions is summarized in Fig. 2. The CUR vegetation distribution is strongly dominated by croplands (agri-cultural C3: AC3), present in 88% of the domain,
whereas forest and mixed vegetation account for 12%, respectively (Fig. 2c,d). Forests are located mainly in the southern part of the domain and on mountain slopes, which are therefore less affected by LCC, whereas in the northern part, forests are very scattered. The POT vegetation distribution presents
A= Γmin(V Vc( cmax),Vj)−Rd
cmax cmax,opt water temp leaf
V =V × ε × ε × ε s s,slope r a s,offset G = G h C A G+
a mix between forest and herbaceous vegetation (natural C3: NC3) covering 61 and 39% of the
domain’s surface, respectively. Forests are located on the edges, while herbaceous plants are in the center of the domain (Fig. 2a,b).
3. RESULTS
3.1. Analysis of temperature anomaly
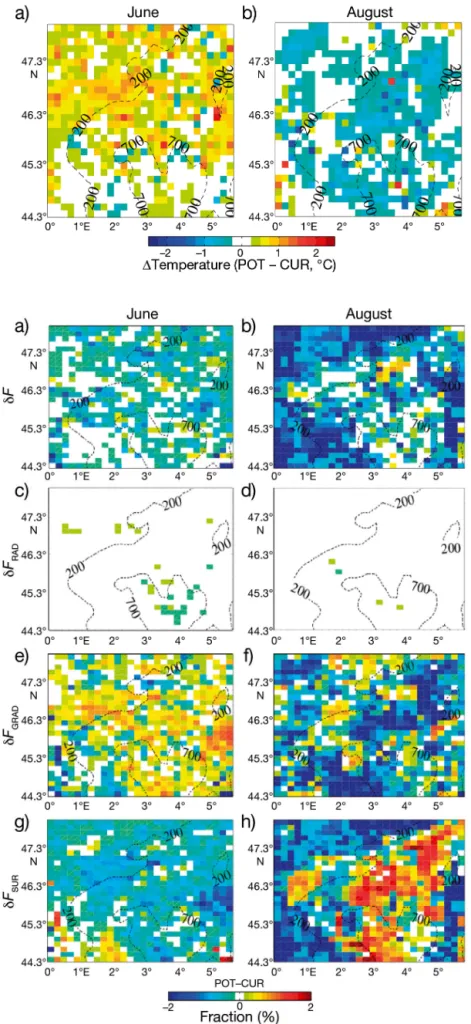
Fig. 3 displays the horizontal pattern of the tem -perature difference between the POT and CUR sim-ulations averaged over the June (Fig. 3a) and August (Fig. 3b) heatwave periods. Revegetating the land induces a positive temperature anomaly in June of + 0.42°C on average (in time and space), reaching + 3°C locally, while the anomaly in August is nega-tive (−0.20°C on average in time and space), reaching −1.6°C locally. These values are calculated at 15:00 h UTC, which approximately corresponds to the warm -est period of the day. Considering that the June and August heatwaves displayed a temperature anomaly of about + 8°C with respect to the climatology (Feudale & Shukla 2010), LCC modifies the total tem -perature anomaly associated with them by ~5% on average and up to 37% locally. In June, the smallest
temperature differences (< 0.5°C) are located in the southern part of the domain, while the largest differences are found in the north.
To identify the reasons that lead to these contrasted vegetationinduced sur -face air temperature changes be tween the June and August heatwaves (heat-ing followed by cool(heat-ing), we consider the surface energy budget (SEB):
K↓ + I↓ = K ↑ + I ↑ + QH+ QL+ QG (4)
where K and I are shortwave and long
-wave radiation incoming (downward arrows) and reflected back (upward arrows) at the surface, QHis the
sensi-ble heat flux, QLthe latent heat flux and
QGthe ground flux.
If Qa= K↓ + I↓ is the downward
radia-tion at the surface and Qt= QH+ QLis
the sum of the turbulent heat fluxes, the fraction F = Qa/Qtis a relevant indicator
to quantify the fraction of in coming energy that contributes to the heating of the atmosphere and to evaporation (Boisier et al. 2012, de Noblet-Ducoudré et al. 2012). In our case, about 40% of the incoming en ergy is turned into turbulent heat fluxes in both POT and CUR simulations, while the remaining 60% is reflected back to space or used to warm up the land surface. The difference of F between the 2 simulations
(δF) during the June and August heatwaves can be analysed in terms of different physical processes. We can write δF as follows:
(5) Let us express Qt as a function of QH and the
Bowen ratio, β = QH/QL, i.e. Qt= (1 + β) QL. The
quan-tity δQtcan be written as:
(6) and Eq. (5) thus becomes:
(7)
The quantity δFRADrepresents the contribution of
cloud cover change between POT and CUR simula-tions to atmospheric heating. The quantity δFGRAD
represents the modification of the thermal stratifica-tion of the atmosphere produced by a change in sur-face roughness as well as by possible atmospheric
1 a a t t t a a t 2 t F F Q Q F Q Q Q Q Q Q Q δ = ∂ ∂ δ + ∂∂ δ = δ − δ (1 ) t L L Q = Q Q t δ + β δ + δβ 1 (1 ) L (1 ) (1 ) a RAD a L2 L GRAD a 2 L SUR F Q Q Q Q Q Q Q F F F δ = + β δ − + β δ − + β δβ δ δ δ
Fig. 2. Vegetation distribution per grid cell for the potential vegetation distribu-tion (POT simuladistribu-tion) (upper row) and current vegetadistribu-tion distribudistribu-tion (CUR; lower row). (a,c) Temperate broadleaf summergreen trees (TBS), (b) natural C3
feedbacks. δFSURrepresents the
contribution of vegetation change to at -mos pheric heating through the modi-fication of the vegetation de pen dent partitioning between sensible and latent fluxes.
Fig. 4 shows the spatial patterns of δF averaged over the 2 heatwave periods, as well as the contributions of δFRAD, δFGRADand δFSURto the mean
change. In June, δF is mainly nega-tive with the most neganega-tive values in the 2 regions where the temperature anomaly is the highest (i.e. north-west and north-east of the Massif Central; compare Fig. 3a). Fig. 4c,e,g show that the largest contributor to δF is δFSUR. It accounts for 78% of δF in
mean (i.e. the relative contribution δFSUR/δF), and results from changes
in the Bowen ratio mainly because of change in the surface sensible heat flux. Differences in incident solar radiation between POT and CUR sim-ulations in June (up to 100 W m−2 locally) also contribute to the change in δF but only marginally (<1%). In contrast, δFGRADlimits the change in
δFSUR, which is of opposite sign and
accounts for 22% of δF. Interestingly,
Fig. 3. Difference in surface air tempera-tures (at 2 m above ground) between the 2 POT and CUR integrations during heat-waves in (a) June and (b) August at 15:00 h UTC. Dashed lines: elevation (m, a.s.l.). Temperature differences above ~0.75°C (or < 0.5°C) are significant at 90% confi-dence level. Simulations: potential (POT) and current (CUR) vegetation distribution
Fig. 4. (a,b) Difference of F (δF) between
POT and CUR simulations for the June and August heatwaves. Contribution to δF from (c,d) cloud cover change (δFRAD), (e,f)
at-mospheric feedback (δFGRAD), and (g,h)
change of partitioning between heating and evaporation (δFSUR). Columns: June
(left) and August (right) heatwaves. Dashed lines: elevation (m, a.s.l.). F = ratio between
downward radiation to turbulent heat fluxes (see Eq. 5). See Fig. 3 for definitions
although δFSURis of opposite sign, its spatial pattern
is the same as that of δFGRADand is correlated (R =
0.32) to a certain degree with the temperature dif -ference over the June heatwave. This highlights the dominant role of the change in turbulent heat fluxes induced by the prescribed LCC.
During the August heatwave, δF is positive in the region where temperature is lower in POT than in CUR (north-east/south-west oriented band and over the Massif Central; see Fig. 3b). This difference is mainly dominated by changes in δFSURwhere trees
have replaced agriculture, and by changes in δFGRAD
where natural grassland has replaced agriculture (see Fig. 2). In both cases, it is the different partition-ing of available energy be tween sensible and latent fluxes caused by the different nature of the vegeta-tion that constrains those changes. We will see in the following that the re sponse of vegetation transpira-tion to heat is mainly re sponsible for this partitranspira-tioning, as a decrease (in crease) in transpiration leads to a larger (smaller) conversion of solar radiation into sen-sible heat flux.
Transpiration represents ~80% of total evapotran-spiration during summer in both POT and CUR simu-lations. Transpiration change is thus a key driver of temperature change and is a relevant indicator of the role of land cover on the modulation of temperature. It strongly depends on the time of the day. Fig. 5 shows the diurnal evolution of transpiration of the 4 main PFTs for both simulations during the heat-waves in June and August, and during the month of July 2003. Transpiration of NC3grass and evergreen
needle leaf trees from the POT simulation are com-pared to that of AC3crops and evergreen broadleaf
trees from the CUR simulation. Broadleaf deciduous trees are also examined. Transpiration of the PFTs temperate broadleaf summergreen trees (TBS), AC3,
evergreen and NC3 (Fig. 5b,c,d,e) are summed to
compute the total transpiration (Fig. 5a). The contri-bution of the other PFTs is negligible (<1%). At 15:00 h UTC, the mean transpiration in the CUR sim-ulation is 0.75 mm d−1larger than in the POT simu -lation during the June heatwave. Conversely, in August, the transpiration in the POT simulation ex -ceeds that of the CUR simulation by 0.45 mm d−1. The transpiration in the CUR simulation decreases during summer from 4 to 2.4 mm d−1, because of the reduc-tion of AC3transpiration (Fig. 5c). In the POT
simula-tion, on the other hand, transpiration remains largely unchanged in the morning, while a substantial reduction (1 mm d−1) appears in the afternoon from 13:00 to 18:00 UTC during the August heatwave. The change in forest transpiration is the main cause of the
afternoon evaporation decrease in POT during the August heatwave (see Fig. 5b). This fall in evapotran-spiration and its underlying mechanism will be fur-ther analyzed in Section 3.2. Concerning the NC3
and evergreen trees, their transpiration rate remains fairly constant during summer (~1 and 0.5 mm d−1, respectively).
For the C3crops, which dominate in the CUR
simu-lation, the transpiration decreases during summer with values in August 2 times smaller than in June (Fig. 5c). In fact, cropland switches from an energy limited evapotranspiration regime (early summer) to a water limited regime (late summer). In POT, the C3
grass transpiration is smaller throughout the summer (Fig. 5e), mainly due to the much smaller LAI than that of crops. As a consequence, grasslands mostly re main in an energy limited evapotranspiration re -gime during the summer months, and an evapotran-spiration decrease for C3 grass is thus less
pro-nounced in contrast to C3crops.
This difference in response over grassland and forested areas has already been highlighted by
Teul-Fig. 5. Mean diurnal cycle of transpiration for the POT (dashed) and CUR (solid) simulations, for (a) the whole vege-tation, (b) the temperate broadleaf summergreen trees (TBS), (c) agricultural C3grass (AC3), (d) the temperate evergreen
trees, and (e) natural C3grass (NC3). June and August values
ing et al. (2010); grass and crops can lose more water through evapotranspiration than trees during heat-waves as long as moisture is not a limiting factor. In the long term, deep-rooted trees benefit from a longer access to soil water, which mitigates the drought effect, whereas the herbaceous vegetation collapses. Consequently the differences in water use (and thereby resilience to heat stress for trees) result in a sign switch at the beginning of July that can be observed for several parameters, such as tempera-ture.
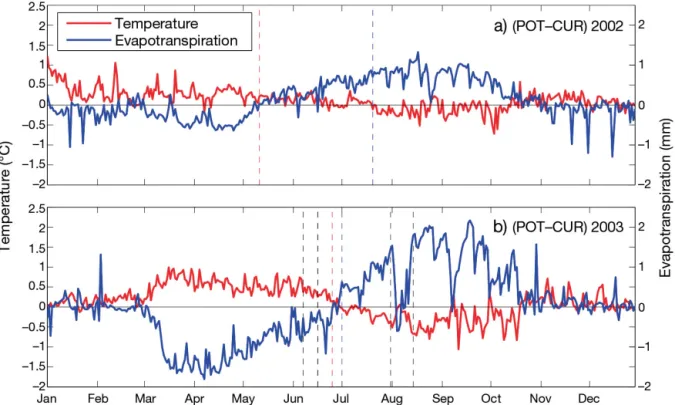
In order to analyse this feature in more depth, Fig. 6 shows the time series (2002 to 2003) for the daily average difference between POT and CUR sim-ulations for surface temperature and evapotranspira-tion (very similar curves are obtained for minimum temperature or temperature at 15:00 h UTC). At the beginning of the years, POT is warmer than CUR (essentially in response to smaller albedo values in POT), but after a few months the situation is the opposite (in response to dominant changes in turbu-lent fluxes). The timing of the switch from warmer to colder surface temperature takes place 2 wk earlier in 2003 than in 2002. The timing of the switch from smaller to larger evapotranspiration rates is shifted from spring to early summer in 2003 compared to
2002. Surface temperature and evapotranspiration differences show a larger variability, amplitude and anti-correlation in 2003 than in 2002 (r = −0.87 and −0.56, respectively). This implies that during 2003 the sensitivity of surface heat fluxes and temperature to LCC in creased compared to radiative (i.e. albedo and cloud cover) and large scale processes. A short ana -lysis of the reflected solar radiation has shown that the most important effect of albedo on climate occurs over the May−September period, where POT stores more radiative energy than CUR (10 W m−2) due to a lower albedo (not shown). Nevertheless this addi-tional energy does not prevent POT from maintain-ing a better land surface coolmaintain-ing efficiency from July to September, and cannot explain the temperature sign switch.
3.2. Analysis of phenological behavior
While Fig. 6 shows that the temperature difference at high and low frequency variability is driven by the evapotranspiration, it also raises a number of issues: 1. Temperature and evapotranspiration differences between POT and CUR have a larger variability and amplitude in 2003 compared to 2002.
Fig. 6. Difference between the POT and CUR simulations for the evapotranspiration (blue) and surface temperature (red) at 15:00 h UTC for (a) 2002 and (b) 2003. Dashed lines — black: limit of June and August heatwaves; blue (red): sign switch in
2. The sign switch in evapotranspiration difference for 2002 occurs in May, while it occurs in July (2 mo later) in 2003.
3. In the afternoon during the August heatwave, there is an important decrease in forest transpiration for the POT simulation, resulting in a reduced tem-perature difference between POT and CUR.
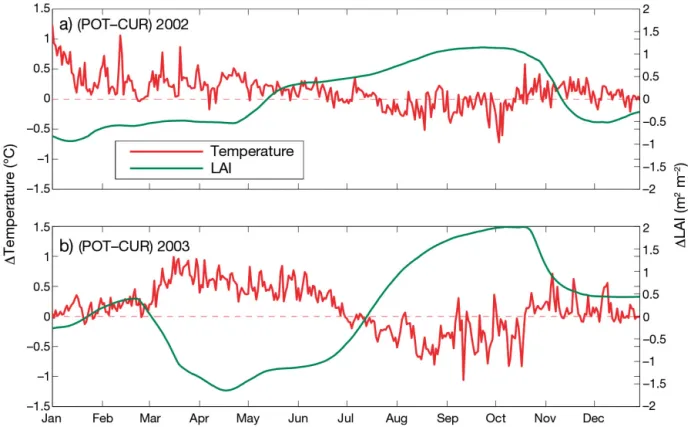
In order to understand these 3 points we look further into the dynamics of vegetation phenology. The LAI and gross primary production (GPP) are di-agnostics of the vegetation condition at a given time. LAI is a partial indicator of the ability of the vegeta -tion to evaporate water from the soil root zone. GPP is an indicator of the instantaneous activity of the plant, positively correlated with stomata opening and eva -potranspiration. Fig. 7 displays the temperature and LAI differences between the POT and CUR simula-tions for 2002 and 2003. The similarities between the two simulations arise because the LAI difference is strongly correlated with evapotranspiration (compare Fig. 6), since larger leaf surface increases evapotran-spiration efficiency and vice versa. The amplitude of the LAI difference is larger in 2003 than in 2002, as it ranges from −1.6 to 2 and −0.9 to 1.1, respectively. The larger temperature differences in 2003 are thus driven by larger LAI difference.
Fig. 8 displays the LAI and GPP in 2002 and 2003 for the 2 simulations. The 2003 vegetation in the CUR simulation shows a more intense LAI development that starts in early March, 1.5 mo before POT. Such a phenomenon has been observed in satellite imagery. For instance, based on a data set covering the period 2000− 2007, Szczypta (2012) and Lafont et al. (2012) reported a long cycle of observed LAI in 2002. For 2003, they reported an early LAI increase and a fast decrease in summer. In an analysis of normalized dif-ference vegetation index (NDVI) time series, Zait -chik et al. (2006) also pointed out the early leaf onset and the summer fall of leaves in 2003. The POT simu-lation has a later and less pronounced leaf onset than CUR in the middle of April (with 2.9 and 3.8 m2m−2
for maximum LAI, respectively). Being dominated by the agricultural PFTs, the CUR phenological cycle, from the point of view of the LAI, is shorter and more sharply peaked. The POT seasonal variations are less peaked because vegetation is composed of a mix of forest and herbaceous vegetation that have different phenological cycles. The evolution of the LAI of herba ceous PFTs is comparable to that of agricultural PFTs in ORCHIDEE, although with an amplitude 4 times smaller, whereas the TBS PFT has a longer growing season extending from May to October,
Fig. 7. Temperature difference at 15:00 h UTC (red) and leaf area index (LAI) difference (green) between the potential (POT) and current (CUR) vegetation distribution simulations for (a) 2002 and (b) 2003
where it reaches its maximum that remains lower than the agri cultural PFTs maximum. In ORCHI DEE, C3 her ba ceous vegetation cannot ex ceed an upper
bound equal to 2.5 m2m−2, whereas this value for C 3
crops is equal to 5 m2 m−2. The LAI difference be
-tween the C3plants is explained by this upper bound.
Three atmospheric parameters can also influence the LAI growth in ORCHIDEE, namely, temperature, rainfall and solar radiation. Cumulated rainfall differ-ence between 2002 and 2003 is not large during the leaf onset from March to June for both simulations (< 25 mm; not shown); however, solar downward radiation and temperature are re spec tively 31 W m−2 (29 W m−2) and 1.6°C (1.26°C) higher during 2003 compared with 2002 for POT (CUR). These favorable spring weather conditions oc cur during the growth period for CUR agriculture PFTs, while it is too early for POT to benefit. For this reason, the LAI difference between the simulations increased in 2003 compared to 2002. These phenology changes induced by the spring weather conditions are the primary cause of point 2 above: the evapotranspiration sign switch occurring in July instead of May for the year 2003.
In spring 2002, in the absence of favorable weather conditions, CUR vegetation shows lower LAI values than in spring 2003. POT vegetation has a leaf onset later than CUR, and is hence less affected by
meteor-ology in spring (Fig. 8a). During the last part of the 2002 summer, POT has an even more productive vegetation with an increased GPP and LAI compared to 2003, probably caused by the absence of a heat-wave and drought.
The GPP values are consistent with the LAI. In 2003, CUR has higher values than POT during the growth phase (3 times larger, with 11.1 and 3.3 gC d−1m−2, respectively), but this phase is 4 mo shorter for CUR (see Fig. 8b). Concerning the POT simula-tion, GPP falls abruptly from 4 to 0.5 gC d−1m−2 dur-ing the August heatwave, which induces a non sig-nificant LAI re duction of 0.3 m2m−2a few days after
the GPP decay. Fig. 5 shows that the transpiration of trees in POT is similar in June, July, and August until 12:00 h UTC. It is consistent with the fact that LAI remains un changed during summer. During the Au gust heatwave, POT transpiration decreases abruptly after 12:00 h, continuing this decline until ~18:00 h UTC, suggesting that past noon, the temper-ature becomes so high that it causes the closing of stomata and a drastic reduction of evapotranspiration and carbon assimilation.
Two environmental factors can inhibit transpiration by stomatal conductance decrease (see Eq. 3): low soil moisture and very high temperature, which reduce the carbon assimilation. Usually temperatures
Fig. 8. Time series of the (a) 2002 and (b) 2003 gross primary production (GPP; blue) and LAI (red) for POT (solid) and CUR (dashed), averaged over the simulation domain. See Fig. 7 for definitions
in Europe are not high enough to reach the critical threshold value for any PFT; However, the August heatwave coincided with the normal peak of summer temperatures (Luterbacher et al. 2004) and surface temperature reached 41°C in south-western France, which is 3°C above the threshold value for TBS trees (38°C). Consequently the low stomatal conductance limits the latent heat flux in most of the domain in POT. This is shown in Fig. 9, which displays the soil moisture (εwater) and temperature (εtemp) factors for
the dominant PFT over the domain at 15:00 h UTC. The quantity εwater does not vary significantly over
the day.
In the POT simulation, the herbaceous PFT has low evaporative capacity and is already severely affected by soil moisture stress and senescence (Fig. 9a). Con-cerning the forests, the relationship between the latent heat flux and TBS εtemp appears clearly from
the high correlation (r = 0.88) between the patterns in Fig. 9c,e. Broadleaf summergreen trees still transpire water at a medium elevation (> 500 m) and north of the domain along the domain boundary. This limita-tion by temperature explains the afternoon transpira-tion reductranspira-tion in POT during the August heatwave (see Fig. 5b). The correlation between the latent heat flux and εtempis lower in CUR (r = 0.60) because there
is little TBS and a majority of croplands (90%), which have a threshold for heat stress factor of 48°C, which is higher than the simulated air temperature during the heatwaves. The lack of transpiration in CUR is related to early death of agricultural PFTs (Stéfanon et al. 2012b) and to soil moisture stress, as attested by the value of εwaterfor crops (Fig. 9b) whereas in POT
it is related to heat stress. Both simulations undergo assimilation limitation that causes stomata closure and a decrease in transpiration, but this closure is induced by different environ-mental factors: high temperature for POT and low soil moisture for CUR.
3.3. Comparison with previous studies
Several studies have investi-gated LCC in the Mediterranean region, but have had conflicting conclusions. As mentioned in the introduction, Anav et al. (2010a) and Zampieri & Lionello (2011) found that the replacement of trees by crops caused in creased evapotranspiration and de creased surface temperature during sum-mers 1981−2000 and 1992−2001 respectively. This is particularly true for heatwave summers. Our results are thus consistent with theirs. However they do not ob -serve a change of sign in the evap-otranspiration and temperature difference during summer. In the CUR simulation, interactions be -tween atmosphere and vegeta-tion phenology play a leading role in the sign reversal. The spring meteorological conditions favor the early and fast development of agricultural vegetation, reducing the soil moisture until it reaches a
Fig. 9. Photosynthesis limitation (see Eq. 3) by (a,b) soil moisture, (c,d) temperature and (e,f) latent heat flux for POT (left column) and CUR (right) for the dominant plant functional types (PFTs) over the domain (broadleaf summergreen trees and crops for POT and CUR, respectively). Values: close to 1 = total absence of stress for plant transpiration, close to 0 = high stress and no transpiration. Results are averaged at 15:00 h UTC over the heatwave period in August 2003. Dashed lines:
critical low value below which crop evaporation is strongly limited. In 2002, the sign of the surface temperature and evapotranspiration differences also switches during summer, but the differences are lower than in 2003. This supports previous findings (Anav et al. 2010a) showing that LCC impact on cli-mate is amplified during heatwaves.
In the afforestation simulation for the 1987−1992 period of Heck et al. (2001), evidence of such a sign switch is shown with a cooling during the early sum-mer and a warming in August. Because of larger LAI and deeper roots, trees transpire larger amounts of water than crops from April to mid-July. However in August, the critical soil moisture stress plays a role in inhibiting any evapotranspiration and enhancing sensible heat flux, thus amplifying the temperature. In our study, we reach the opposite conclusions dur-ing the 2003 summer heatwaves because the LAI of agricultural vegetation is larger than that of forest vegetation from April to mid-July and becomes smaller in August.
4. CONCLUSION
This study analyses the impact on the periods of extreme hot temperatures (summer 2003) of an af -forestation scenario compared with a scenario domi-nated by agricultural vegetation (i.e. potential and current vegetation). Two high resolution simulations with the 2 different vegetation distributions are per-formed over the center of France. We found that reforesting and replacing part of the agriculture with natural prairies play a role in amplifying the temper-ature anomaly from March to June 2003, while it dampens the temperature anomaly from July to October 2003 — with however a limited dampening during the extreme 2 wk period in August. For the 2 heatwaves, the extreme values of temperature anom-aly are modified by 5% and up to 37% (3°C) in spe-cific gridpoints.
During spring 2003, agricultural plants have a greater photosynthetic activity and transpiration than trees because of a faster and stronger growth. The enhanced latent heat flux reduces surface warm-ing durwarm-ing this period until the first heatwave. In July the vegetation starts to be limited by soil moisture, and agricultural plants are the most affected because of their shallow roots; trees can still transpire, and thus have a greater cooling effect than crops.
This cooling capacity is limited during the August heatwave, when very high temperatures inhibit car-bon assimilation in trees during the warmest hours of
the day. With no photosynthetic activity, the stomata close and stomatal resistance increases to its maxi-mum. Crop transpiration during this period is re -duced by the low soil moisture and the decreasing LAI induced by senescence. High elevation areas remain the only location where no limitations take place, due to the lower temperatures.
The favorable weather conditions in spring 2003 amplify the CUR phenological cycle, and thus induce larger LAI differences with respect to 2002. Larger LAI differences mean higher temperature difference between the integrations for 2003, due to the changes in transpiration. Consequently the particu-lar meteorological conditions of 2003 exacerbate the difference between potential and current simulations compared to the more standard 2002 conditions in terms of LAI (Szczypta 2012) and temperature.
Limitation of assimilation by high temperature and induced transpiration inhibition have al ready been found in field experiments (Wang et al. 2008, Bauw-eraerts et al. 2013), but to the best of our knowledge never by modeling. Considering that by the end of the 21st century, summers similar to 2003 could be more frequent (Beniston 2004), climate model users should be cautious about this feedback mechanism when analysing projections of future summer climate and land-surface interactions.
Our experimental set-up, though academic, de -monstrates how choices of land-cover distribution (e.g. trees versus crop extent) and/or species (e.g. tree type) may dampen or amplify extreme tempera-ture events. Impacts of land distribution on local/ regional climate through biophysical feedbacks are indeed almost immediate, while mitigation through changes in greenhouse gases (GHG) is a longer-term process that may be preceded by periods with ad -verse effects of GHG-induced climate change. Our study also shows that land-surface interactions dur-ing summer heatwaves are extremely complex and still require research for a consensus to be reached on their effect on regional climate. Beyond the direct effect of land cover on heatwaves, other non-climatic benefits of forests versus agriculture and vice-versa should be considered. Nevertheless our study consti-tutes one aspect that can be considered in scenarios of land management.
Acknowledgements. This work has been supported by the
Humboldt and MORCE-MED projects funded by the GIS (Groupement d’Intérêt Scientifique) ‘Climat, Environne -ment et Société’. This work has also been carried out in the framework of the LABEX BASC (Biodiversity, Agrosystems, Society and Climate), referred to as ANR-11-LABX-0034.
This work also contributes to the HyMeX program (HYdro-logical cycle in The Mediterranean Experiment, Drobinski et al. 2014) through INSU-MISTRALS support and the GEWEX program of WCRP. We are also grateful to the anonymous reviewers for their valuable and constructive comments on the manuscript. The authors are also grateful to Robert Jones for proofreading the article.
LITERATURE CITED
Anav A, Ruti PM, Artale V, Valentini R (2010a) Modelling the effects of land-cover changes on surface climate in the Mediterranean region. Clim Res 41: 91−104
Bakkenes M, Alkemade J, Ihle F, Leemans R, Latour J (2002) Assessing effects of forecasted climate change on the diversity and distribution of European higher plants for 2050. Glob Change Biol 8: 390−407
Ball JT (1987) A model predicting stomatal conductance and its contribution to the control of photosynthesis under dif-ferent environmental conditions. Prog Photosynthesis Res Proc Int Congress 7th, Providence 10−15 Aug 1986, Vol. 4, Kluwer, Boston, MA, p 221−224
Ballester J, Giorgi F, Rodó X (2010) Changes in European temperature extremes can be predicted from changes in PDF central statistics. Clim Change 98: 277−284
Bauweraerts I, Wertin TM, Ameye M, McGuire MA, Teskey RO, Steppe K (2013) The effect of heat waves, elevated [CO2] and low soil water availability on northern red oak
(Quercus rubra L.) seedlings. Glob Chang Biol 19:
517−528
Beniston M (2004) The 2003 heat wave in Europe: a shape of things to come? An analysis based on Swiss climatologi-cal data and model simulations. Geophys Res Lett 31: L02202, doi:10.1029/2003GL018857
Boisier JP, de Noblet-Ducoudré N, Pitman AT, Cruz F and others (2012) Attributing the impacts of land-cover changes in temperate regions on surface temperature and heat fluxes to specific causes: results from the first LUCID set of simulations. J Geophys Res 117: D12116, doi: 10.1029/ 2011 JD 017106
Bonan GB (2008) Forests and climate change: forcings, feed-backs, and the climate benefits of forests. Science 320: 1444−1449
Cassou C, Terray L, Phillips AS (2005) Tropical Atlantic influence on European heat waves. J Clim 18: 2805−2811 Chalita S, Le Treut H (1994) The albedo of temperate and boreal forest and the Northern Hemisphere climate: a sensitivity experiment using the LMD GCM. Clim Dyn 10: 231−240
Collatz GJ, Ball JT, Grivet C, Berry JA (1991) Physiological and environmental regulation of stomatal conductance, photosynthesis and transpiration: a model that includes a laminar boundary layer. Agric For Meteorol 54: 107−136 Cox PM, Betts R, Collins M, Harris P, Huntingford C, Jones C (2004) Amazonian forest dieback under climate — carbon cycle projections for the 21st century. Theor Appl Climatol 78: 137−156
Davin EL, de Noblet-Ducoudré N (2010) Climatic impact of global-scale deforestation: radiative versus nonradiative processes. J Clim 23: 97−112
de Noblet-Ducoudré N, Boisier JP, Pitman A, Bonan G and others (2012) Determining robust impacts of land-use-induced land cover changes on surface climate over North America and Eurasia: results from the first set of
LUCID experiments. J Clim 25: 3261−3281
Dee DP, Uppala SM, Simmons AJ, Berrisford P and others (2011) The ERA-Interim reanalysis: configuration and performance of the data assimilation system. QJR Mete-orol Soc 137: 553−597
Della-Marta PM, Haylock MR, Luterbacher J, Wanner H (2007) Doubled length of Western European summer heat waves since 1880. J Geophys Res 112: D15103, doi: 10. 1029/ 2007JD008510
Drobinski P, Anav A, Lebeaupin Brossier C, Samson G and others (2012) Model of the Regional Coupled Earth sys-tem (MORCE): application to process and climate studies in vulnerable regions. Environ Model Softw 35: 1−18 Drobinski P, Ducrocq V, Alpert P, Anagnostou E and others
(2014) HyMeX, a 10-year multidisciplinary program on the Mediterranean water cycle. Bull Am Meteorol Soc, doi: 10.1175/BAMS-D-12-00242.1
Ducoudré N, Laval K, Perrier A (1993) SECHIBA, a new set of parameterizations of the hydrologic exchanges at the land−atmosphere interface within the LMD atmospheric general circulation model. J Clim 6: 248−273
Easterling DR, Meehl GA, Parmesan C, Changnon SA, Karl TR, Mearns LO (2000) Climate extremes: observations, modeling, and impacts. Science 289: 2068−2074
Farquhar GD, Caemmerer S, Berry JA (1980) A biochemical model of photosynthetic CO2assimilation in leaves of C3
species. Planta 149: 78−90
Feudale L, Shukla J (2010) Influence of sea surface temper-ature on the European heat wave of 2003 summer. I. An observational study. Clim Dyn 36: 1691−1703
Findell KL, Shevliakova E, Milly PCD, Stouffer RJ (2007) Modeled impact of anthropogenic land cover change on climate. J Clim 20: 3621−3634
Fischer EM, Seneviratne SI, Vidale PL, Lüthi D, Schär C (2007) Soil moisture−atmosphere interactions during the 2003 European summer heat wave. J Clim 20: 5081−5099
Forster P, Ramaswamy V, Artaxo P, Berntsen T and others (2007) Changes in atmospheric constituents and in radia-tive forcing. In: Solomon S, Qin D, Manning M, Chen Z and others (eds) Climate Change 2007: the physical sci-ence basis. Contribution of Working Group I to the Fourth Assessment Report of the Intergovernmental Panel on Climate Change. Cambridge University Press, Cambridge
Gaertner MA, Christensen OB, Prego JA, Polcher J, Gal-lardo C, Castro M (2001) The impact of deforestation on the hydrological cycle in the western Mediterranean: an ensemble study with two regional climate models. Clim Dyn 17: 857−873
Gálos B, Mátyás C, Jacob D (2011) Regional characteristics of climate change altering effects of afforestation. Environ Res Lett 6: 044010, doi:10.1088/1748-9326/ 6/4/ 044 010 Heck P, Lüthi D, Wernli H, Schär C (2001) Climate impacts
of European-scale anthropogenic vegetation changes: a sensitivity study using a regional climate model. J Geo-phys Res 106: 7817−7835
Jackson RB, Randerson JT, Canadell JG, Anderson RG and others (2008) Protecting climate with forests. Environ Res Lett 3: 044006, doi:10.1088/1748-9326/3/4/044006 Klein Tank AMG, Konnen GP, Selten FM (2005) Signals of
anthropogenic influence on European warming as seen in the trend patterns of daily temperature variance. Int J Climatol 25: 1−16
Krinner G, Viovy N, de Noblet-Ducoudré N, Ogeé J and
➤
➤
➤
➤
➤
➤
➤➤
➤
➤
➤
➤
➤
➤
➤
➤
➤
➤
➤
➤
➤
➤
➤
➤
➤
others (2005) A dynamic global vegetation model for studies of the coupled atmosphere−biosphere system. Global Biogeochem Cycles 19: GB1015, doi:10.1029/2003 GB 002199
Lafont S, Zhao Y, Calvet J, Peylin P, Ciais P, Maignan F, Weiss M (2012) Modelling LAI, surface water and carbon fluxes at high-resolution over France: comparison of ISBA-A-gs and ORCHIDEE. Biogeosciences 9: 439−456 Lean J, Rowntree PR (1997) Understanding the sensitivity of
a GCM simulation of Amazonian deforestation to the specification of vegetation and soil characteristics. J Clim 10: 1216−1235
Loveland TR, Reed BC, Brown JF, Ohlen DO, Zhu Z, Yang L, Merchant JW (2000) Development of a global land cover characteristics database and IGBP DISCover from 1 km AVHRR data. Int J Remote Sens 21: 1303−1330
Luterbacher J, Dietrich D, Xoplaki E, Grosjean M, Wanner H (2004) European seasonal and annual temperature variability, trends, and extremes since 1500. Science 303: 1499−1503
Meissner KJ, Weaver AJ, Matthews HD, Cox PM (2003) The role of land surface dynamics in glacial inception: a study with the UVic Earth System Model. Clim Dyn 21: 515−537 Pielke RA, Pitman A, Niyogi D, Mahmood R and others (2011) Land use/land cover changes and climate: model-ing analysis and observational evidence. WIREs Clim Chang 2: 828−850
Pitman AJ, de Noblet-Ducoudré N, Cruz FT, Davin EL and others (2009) Uncertainties in climate responses to past land cover change: first results from the LUCID inter-comparison study. Geophys Res Lett 36: L14814, doi:10. 1029/ 2009 GL039076
Schär C, Vidale PL, Lüthi D, Frei C, Haberli C, Liniger MA, Appenzeller C (2004) The role of increasing temperature variability in European summer heatwaves. Nature 427: 332−336
Skamarock WC, Klemp JB, Dudhia J, Gill DO and others (2008) A description of the Advanced Research WRF Ver-sion 3. NCAR Tech Rep TN-475, NCAR, Boulder, CO Stéfanon M, D’Andrea F, Drobinski P (2012a) Heatwave
classification over Europe and the Mediterranean region.
Environ Res Lett 7: 014023, doi:10.1088/1748-9326/7/1/ 014023
Stéfanon M, Drobinski P, D’Andrea F, Noblet-Ducoudré N (2012b) Effects of interactive vegetation phenology on the 2003 summer heat waves. J Geophys Res 117: D24103, doi:10.1029/2012JD018187
Szczypta C (2012) Space hydrology for the monitoring of Mediterranean droughts. PhD thesis, University of Toulouse
Teuling AJ, Seneviratne SI, Stockli R, Reichstein M and others (2010) Contrasting response of European forest and grass-land energy exchange to heatwaves. Nat Geosci 3: 722−727
Vautard R, Yiou P, D’Andrea F, de Noblet N and others (2007) Summertime European heat and drought waves induced by wintertime Mediterranean rainfall deficit. Geophys Res Lett 34: L07711, doi:10.1029/2006GL028001 Viovy N, de Noblet-Ducoudré N (1997) Coupling water and carbon cycle in the biosphere. Sci Geol Bull 50: 109−121 von Randow C, Manzi AO, Kruijt B, de Oliveira PJ and others (2004) Comparative measurements and seasonal varia-tions in energy and carbon exchange over forest and pas-ture in South West Amazonia. Theor Appl Climatol 78: 5−26
Wang D, Heckathorn SA, Barua D, Joshi P, Hamilton EW, LaCroix JJ (2008) Effects of elevated CO2on the
toler-ance of photosynthesis to acute heat stress in C3, C4, and
CAM species. Am J Bot 95: 165−176
Wramneby A, Smith B, Samuelsson P (2010) Hot spots of vegetation−climate feedbacks under future greenhouse forcing in Europe. J Geophys Res 115: D21119, doi:10. 1029/ 2010JD014307
Zaitchik BF, Macalady AK, Bonneau LR, Smith RB (2006) Europe’s 2003 heat wave: a satellite view of impacts and land−atmosphere feedbacks. Int J Climatol 26: 743−769 Zampieri M, Lionello P (2011) Anthropic land use causes
summer cooling in Central Europe. Clim Res 46: 255−268 Zampieri M, D’Andrea F, Vautard R, Ciais P, de Noblet-Ducoudré N, Yiou P (2009) Hot European summers and the role of soil moisture in the propagation of Mediter-ranean drought. J Clim 22: 4747−4758
Editorial responsibility: Matthias Seaman, Oldendorf/Luhe, Germany
Submitted: August 22, 2013; Accepted: April 2, 2014 Proofs received from author(s): June 9, 2014