HAL Id: hal-01535662
https://hal.sorbonne-universite.fr/hal-01535662
Submitted on 9 Jun 2017HAL is a multi-disciplinary open access
archive for the deposit and dissemination of sci-entific research documents, whether they are pub-lished or not. The documents may come from teaching and research institutions in France or abroad, or from public or private research centers.
L’archive ouverte pluridisciplinaire HAL, est destinée au dépôt et à la diffusion de documents scientifiques de niveau recherche, publiés ou non, émanant des établissements d’enseignement et de recherche français ou étrangers, des laboratoires publics ou privés.
The 2015 edition of the GEISA spectroscopic database
N. Jacquinet-Husson, R. Armante, N.A. Scott, A. Chédin, L Crépeau, C.
Boutammine, A. Bouhdaoui, C. Crevoisier, V. Capelle, C. Boonne, et al.
To cite this version:
N. Jacquinet-Husson, R. Armante, N.A. Scott, A. Chédin, L Crépeau, et al.. The 2015 edition of the GEISA spectroscopic database. Journal of Molecular Spectroscopy, Elsevier, 2016, 327, pp.31-72. �10.1016/j.jms.2016.06.007�. �hal-01535662�
1
The 2015 edition of the GEISA spectroscopic database
N. Jacquinet-Husson 1*, R. Armante 2, N.A. Scott 2, A. Chédin 2, L. Crépeau 2, C. Boutammine 2, A. Bouhdaoui 2, C. Crevoisier 2, V. Capelle 2, C. Boonne 3, N. Poulet-Crovisier 3, A. Barbe 4, D. Chris Benner 5, V. Boudon 6
L.R. Brown 7, J. Buldyreva 8, A. Campargue 9,10, L.H. Coudert 11, V.M. Devi 5 , M.J. Down 12, B.J. Drouin 7, A. Fayt 13, C. Fittschen 14, J.-M Flaud 11, R.R. Gamache 15, J. J. Harrison 16,17, C. Hill 12, Ø. Hodnebrog 18, S.-M Hu 19, D. Jacquemart 20, A. Jolly 11, E. Jiménez 21,
N.N. Lavrentieva 22, A.-W. Liu 19, L. Lodi 12, O.M. Lyulin22, S.T. Massie 23,
S. Mikhailenko 24, H.S.P. Müller 25, O.V. Naumenko 22, A. Nikitin 22, C.J. Nielsen 26,
J. Orphal 27, V.I Perevalov 22, A. Perrin 11, E. Polovtseva 22, A. Predoi-Cross 28, M. Rotger 4, A. A. Ruth 29, S.S Yu 7, K. Sung 7, S.A. Tashkun 22, J. Tennyson 12, Vl.G. Tyuterev 4, J. Vander Auwera30, B.A. Voronin 22, and A. Makie.
1Laboratoire de Météorologie Dynamique/IPSL, CNRS, UPMC Univ. Paris 06, Sorbonne Universités, 75252, Paris, France
2Laboratoire de Météorologie Dynamique/IPSL, CNRS, Ecole Polytechnique, Université Paris-Saclay, 91128, Palaiseau, France
3 Institut Pierre Simon Laplace, Université Pierre et Marie Curie, 75252 Paris, France 4 Université de Reims-Champagne-Ardenne, Groupe de Spectrométrie Moléculaire et
Atmosphérique, 51062 Reims, France
5 The College of William and Mary, Department of Physics, Williamsburg, VA 23187, USA 6 Laboratoire Interdisciplinaire Carnot de Bourgogne, UMR 6303 CNRS-Univ. Bourgogne
Franche-Comté, 9 Avenue Alain Savary, BP 47 870, F-21078 DIJON Cedex, France 7 Jet Propulsion Laboratory, California Institute of Technology, Pasadena, CA 91109, USA
8 Institut UTINAM, UMR 6213 CNRS-Université fédérale Bourgogne Franche-Comté, 16 Route de Gray, F-25030 Besançon cedex, France
9 Université Grenoble Alpes, LIPhy, F-38000 Grenoble, France; 10CNRS, LIPhy, F-38000 Grenoble, France
11 CNRS et Universités Paris EST et Paris 7, Laboratoire Inter-Universitaire des Systèmes Atmosphériques, 94010 Créteil, France
12 Department of Physics and Astronomy, University College London, London WC1E 6BT, United Kingdom
13 Université Catholique de Louvain, Chemin du cyclotron 2, boîte L7.01.07, B-1348 Louvain-la-Neuve, Belgium
14 Université Lille, CNRS, UMR 8522, PC2A, Physicochimie des Processus de Combustion et de l'Atmosphère, F 59000 Lille, France
15 University of Massachusetts Lowell, Department of Environmental Earth and Atmospheric Sciences, Lowell, MA 01854, USA
16Department of Physics and Astronomy, University of Leicester, University Road, Leicester LE1 7RH, United Kingdom
17National Centre for Earth Observation, University of Leicester, University Road, LeicesterLE1 7RH, United Kingdom
18 Center for International Climate and Environmental Research-Oslo (CICERO), P.O. Box 1129 Blindern, NO-0318 Oslo, Norway
19Hefei National Laboratory for Physical Sciences at Microscale, University of Science and Technology of China, Hefei, 230026 China
20 Sorbonne Universités, UPMC Univ Paris 06, CNRS, UMR 8233, MONARIS, Université Pierre et Marie Curie, 4 place Jussieu, F-75005, Paris, France
2 21 Department of Physical Chemistry, Faculty of Chemical Sciences and Technology,
University of Castilla-La Mancha, ES-13071 Ciudad Real, Spain
22 V.E. Zuev Institute of Atmospheric Optics, SB, Russian Academy of Sciences, Academician Zuev square, 634055, Tomsk, Russia
23 Laboratory for Atmospheric and Space Physics, University of Colorado, Boulder, CO, 80303, USA
24V.E. Zuev Institute of Atmospheric Optics, SB, Russian Academy of Science, Akademician Zuev square, 634021, Tomsk, Russia and Mathematical Physics Department, Tomsk
Polytechnic University, 30, Lenin av., 634050, Tomsk, Russia 25 I. Physikalisches Institut, Universität zu Köln, 50937 Köln, Germany 26 Department of chemistry, University of Oslo, Blindern, NO-0315, Norway
27 Institute for Meteorology and Climate Research Centre Karlsruhe/University of Karlsruhe (KIT), 76021 Karlsruhe, Germany
28 Department of Physics and Astronomy, University of Lethbridge, Lethbridge, AB, T1K 3M4, Canada
29 Physics Department and Environmental Research Institute, University College Cork, Cork, Ireland
30 Service de Chimie Quantique et Photophysique, C.P. 160/09, Université Libre de Bruxelles, 50 avenue F.D. Roosevelt, B-1050 Brussels, Belgium
* Corresponding author. Tel: +33169335162; fax: +33169335218 E-mail address: [email protected]
Highlights
GEISA-2015 database release: 5,059,777 entries in the line parameters sub-database 22 molecules updated and 1 new molecule added (SO3)
HDO is given a specific identification code
Important update of the IR cross-sections and aerosols sub-databases
GEISA line parameter database reference for current or planned TIR SWIR space missions
Corresponding author
Dr. Nicole Jacquinet
Phone: +33169335162 Fax: +33169335218 E-mail: [email protected]
3 ABSTRACT
The GEISA database (Gestion et Etude des Informations Spectroscopiques Atmosphériques: Management and Study of Atmospheric Spectroscopic Information) has been developed and maintained bythe ARA/ABC(t) group at LMD since 1974. GEISA is constantly evolving, taking into account the best available spectroscopic data. This paper presents the 2015 release of GEISA (GEISA-2015), which updates the last edition of 2011 and celebrates the 40th anniversary of the database. Significant updates and additions have been implemented in the three following independent databases of GEISA.
The “line parameters database” contains 52 molecular species (113 isotopologues) and transitions in the spectral range from 10-6 to 35,877.031 cm-1, representing 5,059,777 entries, against 3,794,297 in GEISA-2011. Among the previously existing molecules, 20 molecular species have been updated. A new molecule (SO3) has been added. HDO, isotopologue of H2O, is now identified as an independent molecular species. Six new isotopologues have been added to the GEISA-2015 database.
The “cross section sub-database” has been enriched by the addition of 43 new molecular species in its infrared part, 4 molecules (ethane, propane, acetone, acetonitrile) are also updated; they represent 3% of the update. A new section is added, in the near-infrared spectral region, involving 7 molecular species: CH3CN, CH3I, CH3O2, H2CO, HO2, HONO, NH3.
The “microphysical and optical properties of atmospheric aerosols sub-database” has been updated for the first time since 2003. It contains more than 40 species originating from NCAR and 20 from the ARIA archive of Oxford University.
As for the previous versions, this new release of GEISA and associated management software facilities are implemented and freely accessible on the AERIS/ESPRI atmospheric chemistry data center website.
Key words: molecular spectroscopic database, line parameters, cross sections, aerosols, earth and planetary radiative transfer
4
1 Introduction
1:
At the start of the second half of the 20th century, several technologies matured, initiating notable progress in the development of molecular spectroscopy. The progress in the Hamiltonian mechanics led theoreticians to demand more precision and detail spectra, obtained from laboratory or planetary observations [1]. From the mid 1960’s, various scientific communities (Astrophysics, Atmospheric Physics, Metrology and soon after, Climate and Chemistry) required access to databases detailing the spectral characteristics of atmospheric molecular absorption and atmospheric diffusion. As a result, the first standardized spectroscopic database, the so-called “AFGL tape”, oriented towards the Earth’s atmosphere, was initiated in 1973, at the Air Force Geophysics Laboratory USA (McClatchey et al. [2] and Garing and McClatchey [3]). This early contribution was dedicated to a few molecules (H2O, CO2, O3, N2O, CO, CH4, and O2) important in the terrestrial atmosphere and in the infrared spectral domain. It contained approximately 100,000 transitions.
For its own applications related to the radiative transfer in the Earth and planetary atmospheres, the ARA/ABC(t) group at LMD initiated a similar effort that was to lead in the early 1970’s to the creation of GEISA (Gestion et Etude des Informations Spectroscopiques Atmosphériques: Management and Study of Atmospheric Spectroscopic Information), see Chédin et al. [4,5], Husson et al. [6,7], Jacquinet-Husson et al. [8,9,10,11]. Pioneering user friendly management software was an important part of the first issue of GEISA.
At that time, the GEISA archive included major atmospheric absorbers (H2O, CO2, O3, N2O, CO, CH4, O2) as well as complementary species (e.g.: NH3, PH3, C2H4, GeH4, C3H8, C2H2, HC3N, HCOOH, C3H4, NO, SO2, NO2). Some molecules, mainly related to planetary atmospheres (especially those found in the giant planets) like GeH4, C3H8, C2N2, C3H4, HNC, C6H6, and C2HD were also included. Since then, GEISA has been constantly updated to meet the needs of researchers as well as international space agencies, by collecting, archiving and distributing the most accurate, validated available spectroscopic information. One of the features of GEISA, in comparison with other databases such as HITRAN (the descendent of the “AFGL tape” for atmospheric and planetary remote sensing (Rothman et al. [12,13,14]),
5 has been to consider, since its first edition, any isotopologue of a species having symmetry properties different from that of the main isotopologue (e. g. CH3D and CH4, C2HD and C2H2) as an independent molecular species (considered as isotopologues of CH4 andC2H2 in HITRAN, respectively).
The comprehensive GEISA database can be compared to a number of other spectroscopic databases, such as:
- HITRAN [14]
- MIPAS specifically tied to satellite experiments in the Earth’s atmosphere [15]; - the JPL Catalog [16,17] of microwave to sub-millimeter transitions which mainly
contains rotational transitions for a few hundred molecules which can or may be observed in the atmospheres of the Earth or other planets, or in the interstellar- or circum-stellar medium. A small, but increasing number of entries contain infrared transitions;
- the CDMS catalog [18,19] which mostly contains rotational transitions of molecules, on a similar basis as the JPL catalog, related to interstellar medium studies. Some of the molecules are also of relevance for Earth's atmosphere or that of other planets. Furthermore, a number of entries deal with infrared transitions of such molecules.
Certain molecules, mainly related to planetary atmospheres (especially those of the giant planets) are specific to GEISA; these include GeH4, C3H8, C2N2, C3H4, HNC, C6H6. However, GEISA does not include species like HOBr, O, H2 and CS, which are considered in HITRAN. Since the beginning, our focus has been on undertaking evaluations of relevance appropriateness and efficiency of introducing or replacing data. The rapidly evolving capacity of space-borne, ground-based or laboratory observations to deliver more and more detailed, accurate and sTable observed spectra, as well as the constant improvement of radiative transfer models, opens the way to reinforced tests for these evaluations. For example, since the launch of the high spectral resolution infrared sounders AIRS/Aqua and IASI/Metop, in 2003 and in 2006 respectively, an efficient approach has been designed for the validation of GEISA: this is performed interactively through comparisons between forward radiative transfer simulations (e.g. made by the STRANSAC or the 4A models (Scott [20], Scott and Chédin [21]) and observations of spectra made from various sounders collocated over thousands of well-characterized atmospheric and surface situations. Averaging the resulting ‘calculated-observed spectra’ residuals minimizes the random errors coming from both the observations and the imperfect description of the atmospheric state. This efficient approach has also proved
6 capability of evaluating spectroscopic parameters: the resulting SPARTE (Spectroscopic Parameters And Radiative Transfer Evaluation) chain and related results concerning TIR, SWIR and NIR are presented by Armante et al. [22]. Armante et al. use a few representative examples to also demonstrate the relevance of the SPARTE approach to interactively refining spectroscopic parameters
Based on the valuable and sustained support of the international community of spectroscopists concomitant with this validation strategy, the ARA/ABC(t) group continues to extend, maintain and update the GEISA content to incorporate the best available spectroscopic data. Since the launch of Metop-A (24 October 2006), GEISA has been the official reference spectroscopic database used by the international working group (ISSWG) in charge of IASI. GEISA is also involved in the definition of 3 future space missions such as IASI-NG (Crevoisier et al. [23]), MERLIN and MicroCarb.
GEISA and its associated management software facilities are implemented and distributed (in the same way as GEISA-2011) via AERIS/ESPRI atmospheric chemistry data center website. It is used on-line by more than 350 laboratories working in domains which include atmospheric physics, planetary science, astronomy, astrophysics.
This paper describes the latest 2015 GEISA release (hereafter referred to as GEISA-2015) with reference to the GEISA-2011 release and to other similar databases. It provides a detailed description of the newly implemented or corrected data, for each of the three distinct, however complementary, sub-databases: (i) line parameter in Section 2, (ii) infrared, near-infrared and ultraviolet absorption cross-sections in Section 3, (iii) microphysical and optical properties of atmospheric aerosols in Section 4.
2 GEISA-2015 Line parameters database description
2.1 General Overview
The GEISA-2015 line parameters database contains the spectral properties of 52 molecular species (118 isotopologues) corresponding to a total of 5,067,351 entries in the spectral range from 10-6 to 35,877.031 cm-1 (1010 to 0.28 µm). The reference temperature is 296 K.
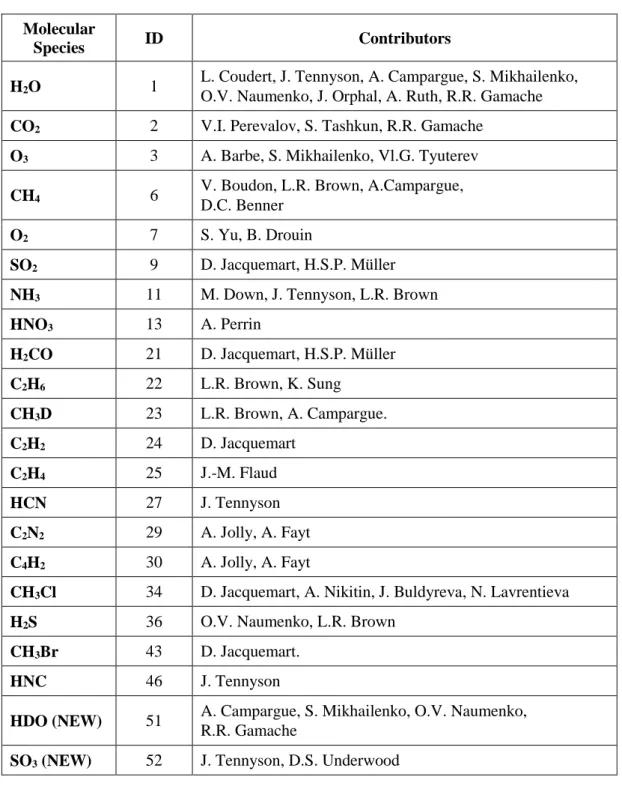
7 The spectroscopic line parameters of 22 of the 50 molecules included in GEISA-2011 have been updated These updates are summarized in Table 1 which gives (i) the GEISA-2015 molecule names; (ii) the corresponding GEISA codes; (iii) the name of the main contributors.
The parameters of 30 molecules, i.e.: N2O, CO, NO, NO2, PH3, OH, HF, HCl, HBr, HI, CLO, OCS, GeH4, C3H8, HC3N, HOCl, N2, H2O2, HCOOH, COF2, SF6, C3H4, HO2, ClONO2, CH3OH, NO+, C6H6, C2HD, CF4, CH3CN, are unchanged from GEISA-2011 with the exception that certain duplicated entries have been removed following technical validations.
Due to the fact that, for atmospheric applications, H2O and HDO have to be taken into account separately in the radiative transfer modeling (different vertical concentration may occur), and also considering their different symmetry properties, it has been decided to consider HDO as an independent molecular species in GEISA-2015. This option was already our choice for C2HD and CH3D. The new identification code for HDO is “51”.
SO3 is a newly added molecular species. The identification code of SO3 is “52”. Details of these different updates are given in paragraphs 2.2.1 to 2.2.22.
8
Table 1
Updated molecular species in the GEISA-2015 edition
Molecular
Species ID Contributors
H2O 1
L. Coudert, J. Tennyson, A. Campargue, S. Mikhailenko, O.V. Naumenko, J. Orphal, A. Ruth, R.R. Gamache
CO2 2 V.I. Perevalov, S. Tashkun, R.R. Gamache
O3 3 A. Barbe, S. Mikhailenko, Vl.G. Tyuterev
CH4 6 V. Boudon, L.R. Brown, A.Campargue, D.C. Benner
O2 7 S. Yu, B. Drouin
SO2 9 D. Jacquemart, H.S.P. Müller
NH3 11 M. Down, J. Tennyson, L.R. Brown
HNO3 13 A. Perrin H2CO 21 D. Jacquemart, H.S.P. Müller C2H6 22 L.R. Brown, K. Sung CH3D 23 L.R. Brown, A. Campargue. C2H2 24 D. Jacquemart C2H4 25 J.-M. Flaud HCN 27 J. Tennyson C2N2 29 A. Jolly, A. Fayt C4H2 30 A. Jolly, A. Fayt
CH3Cl 34 D. Jacquemart, A. Nikitin, J. Buldyreva, N. Lavrentieva
H2S 36 O.V. Naumenko, L.R. Brown
CH3Br 43 D. Jacquemart.
HNC 46 J. Tennyson
HDO (NEW) 51 A. Campargue, S. Mikhailenko, O.V. Naumenko, R.R. Gamache
SO3 (NEW) 52 J. Tennyson, D.S. Underwood
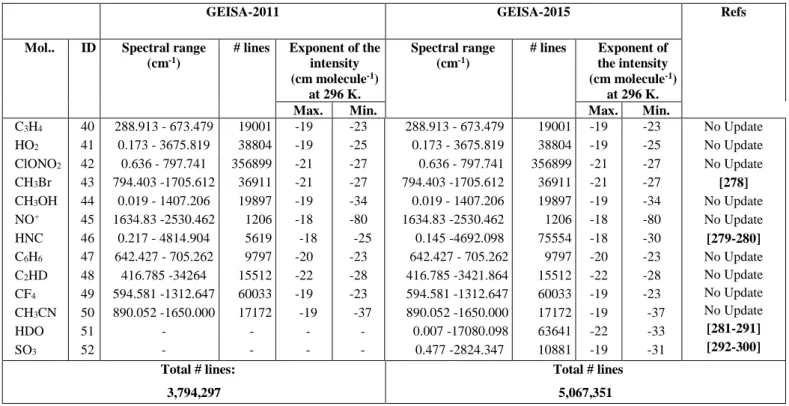
Table 2 summarizes the evolution, since GEISA-2011, of each of the 50 molecular species in the GEISA-2015 line parameters database in term of: (i) spectral range (cm-1); (ii) the number of lines; (iii) the minimum and maximum of the intensities (cm molecule-1 at 296 K), expressed in terms of maximum and minimum values of the intensity exponent. Columns 3
9 to 6 correspond to GEISA-2011 and columns 7 to 10 to GEISA-2015. The molecule names and identification numbers are in the 2 first columns, and the references of their updates in the last column.
Table 2
Contents of the GEISA-2015 line parameters database. Details per molecule of the evolution of GEISA contents since its 2011 edition. Reference temperature is 296 K.
.
GEISA-2011 GEISA-2015 Refs
Mol.. ID Spectral range (cm-1)
# lines Exponent of the intensity (cm molecule-1) at 296 K. Spectral range (cm-1) # lines Exponent of the intensity (cm molecule-1) at 296 K.
Max. Min. Max. Min.
H2O CO2 O3 N2O CO CH4 O2 NO SO2 NO2 NH3 PH3 HNO3 OH HF HCl HBr HI ClO OCS H2CO C2H6 CH3D C2H2 C2H4 GeH4 HCN C3H8 C2N2 C4H2 HC3N HOCl N2 CH3Cl H2O2 H2S HCOOH COF2 SF6 1 2 3 4 5 6 7 8 9 10 11 12 13 14 15 16 17 18 19 20 21 22 23 24 25 26 27 28 29 30 31 32 33 34 35 36 37 38 39 0.007 - 25232.004 5.891 - 12784.053 0.026 - 6395.379 0.838 - 7796.633 3.414 - 8464.882 0.001 - 9199.284 10-6 - 15927.230 10-6 - 9273.214 0.017 - 4092.948 0.498 - 3074.152 0.058 - 5294.501 17.805 - 3601.652 0.012 - 1769.982 0.005 - 35877.031 41.111 - 11535.570 20.240 -13457.841 16.231 - 9758.564 12.509 - 8487.305 0.015 - 1207.639 0.381 - 4199.671 3x10⁻⁶ - 3099.958 706.601 -3000.486 7.7602 - 6510.326 604.774 -9889.038 701.203 -3242.172 1937.371 -224.570 0.006 - 17581.010 700.015 - 799.930 203.955 -2181.690 191.635 - 730.235 463.604 - 759.989 0.0236 - 3799.682 1992.63 -2625.497 674.143 -3172.927 0.043 - 1730.371 2.985 - 4256.547 10.018 - 1889.334 725.005 -2001.348 588.488 - 975.787 67789 413619 389378 50633 13515 240991 6428 105079 68728 104223 29082 20364 669988 42866 107 533 1293 806 7230 33809 37050 27644 49237 11340 18378 824 82042 8983 2577 119480 179347 17862 120 18344 126983 20788 62684 70904 92398 -18 -18 -20 -17 -18 -19 -24 -19 -20 -18 -19 -18 -20 -16 -16 -18 -18 -19 -20 -17 -20 -20 -23 -18 -20 -18 -19 -21 -20 -19 -19 -19 -27 -20 -19 -19 -19 -19 -19 -33 -42 -31 -25 -77 -39 -51 -94 -28 -27 -39 -27 -28 -84 -25 -25 -32 -29 -29 -27 -38 -29 -30 -28 -37 -21 -34 -23 -24 -24 -23 -27 -33 -32 -28 -26 -25 -23 -23 0.052 -25336.949 5.890 -14075.298 0.026 - 6996.681 0.838 - 7796.633 3.414 - 8464.882 0.001 -11501.877 10-6 -15927.804 10-6 - 9273.214 0.017 -4092.948 0.498 - 3074.152 0.058 -6999.429 17.805 - 3601.652 0.012 -1769.982 0.005 - 35877.031 41.111 - 11535.570 20.240 -13457.841 16.231 - 9758.564 12.509 - 8487.305 0.015 - 1207.639 0.381 - 4199.671 0.000 -3099.958 706.601 -3070.971 7.760 -6510.324 604.774 -9889.038 614.740 -3242.172 1937.371 -224.570 0.018 -17581.009 700.015 - 799.930 200.817 -2181.690 189.422 -1302.217 463.604 - 759.989 0.0236 - 3799.682 1992.63 -2625.497 0.872 -3197.961 0.043 - 1730.371 1.030 -1329.780 10.018 - 1889.334 725.005 -2001.348 588.488 - 975.787 191846 534227 405919 50633 13515 4393851 6197 105079 83668 104223 46414 20364 691161 42866 107 533 1293 806 7230 33809 44611 53803 58763 12969 53227 824 138103 8983 71954 417540 179347 17862 120 83043 126983 58650 62684 70904 92398 -18 -18 -20 -17 -18 -19 -24 -19 -20 -18 -19 -18 -20 -16 -16 -18 -18 -19 -20 -17 -20 -20 -23 -18 -20 -18 -19 -21 -20 -19 -19 -19 -27 -21 -19 -19 -19 -19 -19 -36 -30 -31 -25 -77 -39 -54 -94 -30 -27 -39 -27 -28 -84 -25 -25 -32 -29 -29 -27 -39 -29 -30 -28 -37 -21 -32 -23 -24 -24 -23 -27 -33 -32 -28 -30 -25 -23 -23 [24-83] [84-105] [106-131] No Update No Update [132-162] [163-174] No Update [175-182] No Update [183-192] No Update [193-197] No Update No Update No Update No Update No Update No Update No Update [198-206] [207-218 [219-222] [223-226] [227-230] No Update [231-235] No Update [236-239] [240-246] No Update No Update No Update [247-263] No Update [264-277] No Update No Update No Update
10
GEISA-2011 GEISA-2015 Refs
Mol.. ID Spectral range (cm-1)
# lines Exponent of the intensity (cm molecule-1) at 296 K. Spectral range (cm-1) # lines Exponent of the intensity (cm molecule-1) at 296 K.
Max. Min. Max. Min.
C3H4 HO2 ClONO2 CH3Br CH3OH NO+ HNC C6H6 C2HD CF4 CH3CN HDO SO3 40 41 42 43 44 45 46 47 48 49 50 51 52 288.913 - 673.479 0.173 - 3675.819 0.636 - 797.741 794.403 -1705.612 0.019 - 1407.206 1634.83 -2530.462 0.217 - 4814.904 642.427 - 705.262 416.785 -34264 594.581 -1312.647 890.052 -1650.000 - - 19001 38804 356899 36911 19897 1206 5619 9797 15512 60033 17172 - - -19 -19 -21 -21 -19 -18 -18 -20 -22 -19 -19 - - -23 -25 -27 -27 -34 -80 -25 -23 -28 -23 -37 - - 288.913 - 673.479 0.173 - 3675.819 0.636 - 797.741 794.403 -1705.612 0.019 - 1407.206 1634.83 -2530.462 0.145 -4692.098 642.427 - 705.262 416.785 -3421.864 594.581 -1312.647 890.052 -1650.000 0.007 -17080.098 0.477 -2824.347 19001 38804 356899 36911 19897 1206 75554 9797 15512 60033 17172 63641 10881 -19 -19 -21 -21 -19 -18 -18 -20 -22 -19 -19 -22 -19 -23 -25 -27 -27 -34 -80 -30 -23 -28 -23 -37 -33 -31 No Update No Update No Update [278] No Update No Update [279-280] No Update No Update No Update No Update [281-291] [292-300] Total # lines: 3,794,297 Total # lines 5,067,351
Notes: “No Update” in the “Refs.” column indicates that only minor technical corrections were made for the given molecule between GEISA-2011 to GEISA-2015.
(-)Missing data.
Table 3 summarizes, for each individual molecular species implemented in the GEISA-2015 line parameters database, information on each of its associated isotopologues. It is organized as follows: (i) individual GEISA-2015 molecular species names (“Mol.”); (ii) molecular species corresponding identification codes (“ID” codes, defined for the GEISA management software), (iii) each molecule ID associated isotopologue identification codes “Isot ID” (See Appendix C for corresponding this identifier); (iv) to (viii) the number of lines with
associated minimum and maximum wave numbers (cm-1) and intensities (in cm molecule-1 at 296 K).
11 Table 3
The GEISA-2015 line parameters database. Spectral and intensity ranges per molecule and per isotopologue. The third column “Isot ID” indicates the isotopologue identification. The notation used for GEISA in described in the Appendix C
Mol. ID Isot. ID. # lines Minimum Wave number (cm-1) Maximum Wave number (cm-1) Minimum Intensity (cm molecule.-1) at 296 K Maximum Intensity (cm molecule.-1) at 296 K H2O 1 161 119885 0.400560 25336.948790 1.070 x 10⁻³⁰ 2.656 x 10⁻¹⁸ 181 39613 0.052583 19917.617846 8.470 x 10-36 5.270 x 10⁻²¹ 171 26215 0.451497 19945.257171 4.857 x 10⁻³⁵ 9.860 x 10⁻²² 262 5971 5.060500 7979.071900 7.310 x 10⁻³³ 1.751 x 10⁻²⁶ 282 162 6328.068400 6637.658200 1.530 x 10⁻³⁵ 5.640 x 10⁻³⁴ CO2 2 626 170846 345.935822 14075.298241 1.000 x 10⁻³⁰ 3.551 x 10⁻¹⁸ 636 70462 408.380298 13734.963032 1.000 x 10⁻³⁰ 3.741 x 10⁻²⁰ 628 115942 5.890710 12677.181338 1.000 x 10⁻³⁰ 6.800 x 10⁻²¹ 627 72120 10.599802 12726.561843 1.000 x 10⁻³⁰ 1.263 x 10⁻²¹ 638 40143 461.995234 9212.608647 1.000 x 10⁻³⁰ 7.964 x 10⁻²³ 637 23901 493.881436 8061.740848 1.000 x 10⁻³⁰ 1.388 x 10⁻²³ 828 10593 482.813154 8162.742864 1.000 x 10⁻³⁰ 1.317 x 10⁻²³ 728 15206 498.616897 8193.172140 1.000 x 10⁻³⁰ 2.529 x 10⁻²⁴ 838 3111 539.626449 6687.643142 1.002 x 10⁻³⁰ 1.413 x 10⁻²⁵ 727 6623 535.357499 6932.953775 1.001 x 10⁻³⁰ 2.858 x 10⁻²⁵ 738 3621 555.753837 4915.047803 1.000 x 10⁻³⁰ 2.706 x 10⁻²⁶ 737 1659 575.852870 4822.770500 1.004 x 10⁻³⁰ 3.014 x 10⁻²⁷ O3 3 666 249673 0.026300 6996.680800 3.904 x 10⁻²⁹ 4.060 x 10⁻²⁰ 668 44302 0.920900 2767.874110 4.692 x 10⁻²⁸ 7.760 x 10⁻²³ 686 24886 1.176800 2739.289270 9.970 x 10⁻²⁹ 7.560 x 10⁻²³ 667 58171 0.289037 820.380127 5.135 x 10⁻³¹ 5.356 x 10⁻²⁵ 676 28887 0.212814 822.795105 1.433 x 10⁻³¹ 5.827 x 10⁻²⁵ N2O 4 446 34468 0.838022 7796.633112 4.650 x 10⁻²⁶ 1.003 x 10⁻¹⁸ 456 4466 5.028000 5088.905757 5.220 x 10⁻²⁶ 3.423 x 10⁻²¹ 546 4841 4.858000 4992.236153 4.720 x 10⁻²⁶ 3.513 x 10⁻²¹ 448 4412 541.341626 4672.579499 1.614 x 10⁻²⁵ 1.930 x 10⁻²¹ 447 1778 549.366695 4429.961520 1.614 x 10⁻²⁵ 4.017 x 10⁻²² 458 105 2121.769638 2203.982901 1.673 x 10⁻²⁵ 6.637 x 10⁻²⁴ 548 108 2144.997413 2226.290105 1.675 x 10⁻²⁵ 7.631 x 10⁻²⁴ 556 455 1226.535927 3415.767844 1.642 x 10⁻²⁵ 1.210 x 10⁻²³ CO 5 26 5908 3.530098 8464.881965 7.880 x 10-78 4.460 x 10⁻¹⁹ 36 4768 3.414267 8180.218750 3.610 x 10-73 4.690 x 10⁻²¹ 27 748 3.714216 6338.061200 8.190 x 10-40 1.600 x 10⁻²² 28 770 3.629408 6266.577400 7.610 x 10-39 8.320 x 10⁻²² 37 580 1807.870900 6196.551100 1.030 x 10-36 1.680 x 10⁻²⁴ 38 741 3.462498 6123.294200 2.580 x 10-40 8.700 x 10⁻²⁴ CH4 6 211 333339 0.001063 11501.877400 1.030 x 10-39 2.114 x 10⁻¹⁹ 311 106046 0.001063 11318.549800 1.172 x 10-39 2.362 x 10⁻²¹ O2 7 66 1902 0.000001 15927.804099 7.233 x 10-51 8.797 x 10⁻²⁴ 67 13392 0.000001 14537.832826 1.960 x 10-54 3.437 x 10⁻²⁷ 68 903 1.572090 15852.677413 1.186 x 10⁻³⁵ 1.675 x 10⁻²⁶ NO 8 46 103701 0.000001 9273.214340 1.451 x 10-95 2.322 x 10⁻²⁰ 48 679 1601.909400 2038.846100 4.190 x 10⁻²⁸ 1.390 x 10⁻²² 56 699 1609.585400 2060.462500 4.430 x 10⁻²⁸ 2.550 x 10⁻²²
12 Mol. ID Isot. ID. # lines Minimum Wave number (cm-1) Maximum Wave number (cm-1) Minimum Intensity (cm molecule.-1) at 296 K Maximum Intensity (cm molecule.-1) at 296 K SO2 9 626 72903 0.017394 4092.948220 2.864 x 10⁻³⁰ 4.851 x 10⁻²⁰ 646 10765 1060.195581 2500.400420 4.980 x 10⁻²⁴ 2.100 x 10⁻²¹ NO2 10 646 104223 0.497999 3074.152650 4.240 x 10⁻²⁸ 1.302 x 10⁻¹⁹ NH3 11 411 45324 0.058210 6999.428900 2.115 x 10-39 5.493 x 10⁻¹⁹ 511 1090 0.374789 5179.785600 5.460 x 10⁻²⁹ 1.992 x 10⁻²¹ PH3 12 131 20364 8.904310 3601.652010 1.849 x 10⁻²⁸ 2.520 x 10⁻¹⁹ HNO3 13 146 669988 0.011922 1769.982240 3.590 x 10⁻²⁸ 3.130 x 10⁻²⁰ 156 21173 830.370600 922.931350 3.000 x 10⁻²⁵ 3.300 x 10⁻²³ OH 14 61 42711 0.004620 35877.030506 1.500 x 10-85 6.450 x 10⁻¹⁷ 62 90 0.009943 1.824065 2.090 x 10⁻³¹ 5.780 x 10⁻²⁹ 81 65 0.052846 6.325014 1.200 x 10⁻³⁰ 1.200 x 10⁻²⁶ HF 15 19 107 41.110982 11535.570000 1.110 x 10⁻²⁶ 1.440 x 10⁻¹⁷ HCl 16 15 284 20.270297 13457.840907 1.090 x 10⁻²⁶ 5.030 x 10⁻¹⁹ 17 249 20.240304 10994.721087 1.010 x 10⁻²⁶ 1.610 x 10⁻¹⁹ HBr 17 11 642 16.231550 9757.189365 1.528 x 10⁻³² 1.178 x 10⁻¹⁹ 19 651 16.236523 9758.311660 9.450 x 10⁻³³ 1.211 x 10⁻¹⁹ HI 18 17 806 12.509418 8487.304744 1.644 x 10⁻³⁰ 3.423 x 10⁻²⁰ ClO 19 56 3599 0.027699 1207.639162 1.520 x 10⁻²⁹ 3.240 x 10⁻²¹ 76 3631 0.014605 1199.839726 5.090 x 10⁻³⁰ 1.030 x 10⁻²¹ OCS 20 622 19130 0.405713 4199.671388 4.398 x 10⁻²⁶ 1.220 x 10⁻¹⁸ 624 6665 0.395798 4165.233004 6.400 x 10⁻²⁷ 4.720 x 10⁻²⁰ 632 3243 0.404408 4055.089955 1.720 x 10⁻²⁷ 1.200 x 10⁻²⁰ 623 2788 509.006700 4163.068691 4.678 x 10⁻²⁶ 8.430 x 10⁻²¹ 822 1626 0.380587 4045.602054 2.620 x 10⁻²⁸ 2.090 x 10⁻²¹ 634 357 1972.188480 2032.038820 1.010 x 10⁻²³ 5.240 x 10⁻²² H2CO 21 126 40680 0.000000 3099.958130 3.955 x 10-39 7.436 x 10⁻²⁰ 128 1622 0.000016 100.054366 8.054 x 10-36 1.089 x 10⁻²² 136 2309 0.000019 116.701949 3.566 x 10⁻³⁵ 6.314 x 10⁻²² C2H6 22 226 47766 706.601510 3070.971230 4.609 x 10⁻²⁹ 1.873 x 10⁻²⁰ 236 6037 725.602722 918.717163 1.130 x 10⁻²⁸ 1.515 x 10⁻²³ CH3D 23 212 54550 7.760179 6510.324200 3.528 x 10⁻³⁰ 5.714 x 10⁻²³ 312 4213 959.393990 1694.123380 2.768 x 10⁻²⁹ 1.398 x 10⁻²⁵ C2H2 24 221 12684 604.774170 9889.037680 4.425 x 10⁻²⁸ 1.187 x 10⁻¹⁸ 231 285 613.536460 6588.934700 3.820 x 10⁻²⁶ 1.577 x 10⁻²⁰ C2H4 25 211 35132 701.202696 3242.172128 2.764 x 10-37 8.412 x 10⁻²⁰ 311 18095 614.740436 3180.238042 4.852 x 10⁻²⁴ 5.512 x 10⁻²⁰ GeH4 26 411 824 1937.371090 2224.570070 1.960 10-22 3.680 x 10⁻¹⁹ HCN 27 124 136018 0.018640 17581.009367 1.000 x 10⁻³⁰ 7.038 x 10⁻¹⁹ 125 791 2.870485 3550.842326 5.156 x 10⁻³² 2.468 x 10⁻²¹ 134 791 2.879990 3532.251747 1.431 x 10⁻³¹ 7.568 x 10⁻²¹ 224 503 2.415494 2725.191923 1.801 x 10⁻³⁰ 7.317 x 10⁻²³ C3H8 28 221 8983 700.014648 799.929688 1.583 x 10⁻²⁴ 1.810 x 10⁻²² C2N2 29 224 71954 200.817750 2181.689940 1.009 x 10⁻²⁴ 2.478 x 10⁻²⁰ C4H2 30 211 417540 189.422800 1302.216600 1.003 x 10⁻²⁴ 1.074 x 10⁻¹⁹ HC3N 31 124 179347 463.604500 759.988800 1.052 x 10⁻²⁴ 4.041 x 10⁻²⁰ HOCl 32 165 9293 0.023599 3799.249000 1.650 x 10⁻²⁷ 3.590 x 10⁻²⁰ 167 8569 0.349154 3799.681900 7.220 x 10⁻²⁸ 1.140 x 10⁻²⁰ N2 33 44 120 1992.627702 2625.497436 1.590 x 10⁻³⁴ 3.548 x 10⁻²⁸ CH3Cl 34 215 40941 0.886304 3197.758930 9.051 x 10⁻³² 7.152 x 10⁻²¹ 217 42102 0.872753 3197.961060 2.177 x 10⁻²⁷ 2.326 x 10⁻²¹
13 Mol. ID Isot. ID. # lines Minimum Wave number (cm-1) Maximum Wave number (cm-1) Minimum Intensity (cm molecule.-1) at 296 K Maximum Intensity (cm molecule.-1) at 296 K H2O2 35 166 126983 0.043110 1730.370600 5.064 x 10⁻²⁹ 5.582 x 10⁻²⁰ H2S 36 121 38139 1.168413 11329.779860 9.823 x 10⁻³⁰ 1.377 x 10⁻¹⁹ 131 12193 1.097191 11226.586550 1.002 x 10⁻²⁹ 1.080 x 10⁻²¹ 141 8318 1.030566 11071.420170 1.006 x 10⁻²⁹ 5.990 x 10⁻²¹ HCOOH 37 261 62684 10.018282 1889.333730 3.966 x 10⁻²⁶ 5.068 x 10⁻²⁰ COF2 38 269 70904 725.005500 2001.347800 4.740 x 10⁻²⁴ 3.940 x 10⁻²⁰ SF6 39 29 92398 588.488352 975.787491 1.001 x 10⁻²⁴ 1.453 x 10⁻²⁰ C3H4 40 341 19001 288.912585 673.478839 4.230 x 10⁻²⁴ 1.550 x 10⁻²⁰ HO2 41 166 38804 0.172756 3675.818586 1.001 x 10⁻²⁶ 2.744 x 10⁻²⁰ ClONO2 42 564 206861 0.635822 797.741040 7.547 x 10⁻²⁸ 3.850 x 10⁻²² 764 150038 0.928373 790.805380 7.519 x 10⁻²⁸ 1.260 x 10⁻²² CH3Br 43 79 18692 794.403140 1705.611680 9.970 x 10⁻²⁷ 2.580 x 10⁻²¹ 81 18219 795.083120 1696.895670 1.000 x 10⁻²⁶ 2.530 x 10⁻²¹ CH3OH 44 216 19897 0.019265 1407.205540 8.826 x 10⁻³⁵ 3.771 x 10⁻²⁰ NO+ 45 46 1206 1634.831153 2530.462136 6.121 x 10-81 1.186 x 10⁻¹⁹ HNC 46 142 75554 0.145590 4692.098100 1.000 x 10⁻³⁰ 1.262 x 10⁻¹⁸ C6H6 47 266 9797 642.427000 705.262000 4.070 x 10⁻²⁴ 9.490 x 10⁻²¹ C2HD 48 122 15512 416.784700 3421.864100 5.195 x 10⁻²⁹ 9.802 x 10⁻²³ CF4 49 291 60033 594.580718 1312.647564 7.912 x 10⁻²⁴ 4.718 x 10⁻²⁰ CH3CN 50 234 17172 890.051655 1650.000000 1.200 x 10-38 3.824 x 10⁻²⁰ HDO 51 162 53706 0.007002 17080.098180 1.240 x 10⁻³² 2.700 x 10⁻²² 172 175 1234.234730 1598.765470 2.033 x 10⁻²⁷ 9.319 x 10⁻²⁷ 182 9760 0.196882 8748.128100 3.734 x 10⁻³³ 5.646 x 10⁻²⁵ SO3 52 26 10881 0.477672 2824.347247 1.636 x 10⁻³¹ 1.266 x 10⁻¹⁹
The parameters for each spectral line (or molecular vibrational-rotational transition) of 2015 are stored in ASCII, in the “standard format” as previously defined for GEISA-2011. Each entry in GEISA describes the 31 spectroscopic line parameters on a 252 character length record: a detailed description of these entries (identification, format, record length, etc is given in Appendix B and Table 15 herein).
Some modifications have been made to the GEISA-2011 format. The standard default values for fields «O’», « T » and « T’ », (respectively estimated accuracy on the air pressure-shift of the line transition, self-pressure-shift of the line transition and estimated accuracy on the self-pressure-shift of the line transition) have been changed and set to “zero”. This modification was made to avoid potential misunderstanding and thus improper use of these parameters in some applications especially related to forward radiative transfer.
14 This description is given below, in sub-sections 2.2.1 to 2.2.22, for each molecular species identified by its formula associated with its identification code in GEISA. It should be noted that, in the following, wave numbers may be displayed with all their decimal places – as in the database itself – or truncated when such a high detailed information is not required.
2.2.1 H2O (molecule 1)
2.2.1.1 GEISA-2015 H2O update overview
H2O is significantly updated in this 2015 edition of GEISA, with important additions across the whole spectral range (67,789 lines in 2011 have become 191,846 in GEISA-2015). This significant increase of the total number of transitions originates mainly in the inclusion of empirical lists in the GEISA-2015.
The new line lists for H2O in this 2015 edition of GEISA originate from results of 8 participating institutions (in alphabetic order):
● V.E. Zuev Institute of Atmospheric Optics, Russian Federation (IAO)
● Karlsruhe Institute of Technology, Germany (KIT)
● Laboratoire Inter-Universitaire des Systèmes Atmosphériques, France (LISA) ● Laboratoire Interdisciplinaire de Physique, France (LIPhy) ● Netherlands Institute for Space Research, Netherlands (SRON)
● University College Cork, Ireland (UCC)
● University College London, UK (UCL)
● University of Massachusetts, USA (UMASS)
Five isotopologues, i.e., H216O, H217O, H218O, D216O, D218O, are updated in the 2015 release, as summarized in Table 4. This Table lists GEISA-2015 entries that have totally replaced entries of GEISA-2011. They represent 172,680 entries. Their names are listed in the first column of this Table with associated identification codes (see Appendix C). Each line list spectral range, minimum and maximum wave numbers (cm-1), the number of transitions, the mean (Moy.I) and the maximum (Max.I) of the line intensities (cm molecule-1 at 296 K), and the origin of the data are given in columns 2 to 7 of this Table, respectively. The process used to update each isotopologue is described in the sections below.
15
Table 4
General overview of the H2O update in GEISA-2015
Isot. ID Wavenb. min (cm-1) Wavenb. max (cm-1) #lines Moy. I (cm molecule.-1) at 296 K Max. I (cm molecule.-1) at 296 K Origin H216O 161 10.714930 5850.059600 5098.661059 7920.315400 12520 18757 9.9741x10⁻³⁰ 1.001x10⁻²⁹ 2.651x10⁻¹⁸ 1.856x10⁻²⁰ LISA, IAO LIPhy, IAO UMASS H217O 171 0.451497 5850.241200 4174.108380 19945.257171 7905.615600 4299.793100 27547 3659 24 4.857x10⁻³⁵ 1.002x10⁻²⁹ 6.46x10⁻²⁸ 9.860x10⁻²² 6.939x10⁻²⁴ 4.393x10⁻²⁶ UCL LIPhy, IAO SRON, UMASS H218O 181 893.551335 0.052583 4177.931920 5855.542000 1996.530386 19917.617846 4298.236000 7919.033200 974 39918 47 6641 9.9741x10⁻³⁰ 8.47x10-36 2.93x10⁻²⁶ 1.001x10⁻²⁹ 2.651x10⁻¹⁸ 5.270x10⁻²¹ 2.440x10⁻²⁵ 3.647x10⁻²³ LISA UCL SRON LIPhy, IAO UMASS D216O (new) 262 6378.9189 5.060500 6676.1465 7979.071900 225 5746 7.31x10⁻³³ 1.76x10⁻²⁸ 2.640x10⁻³¹ 1.75x10⁻²⁶ UCC, KIT IAO UMASS D218O (new) 282 6328.068400 6637.658200 162 9.41x10⁻³⁵ 5.41x10⁻³⁴ UCC, KIT UMASS 2.2.1.2 H216O update process
The revised line list built using contributions from IAO, LISA and LIPhy was processed in two steps: first, the H216O entries in GEISA-2011 were updated with the new data; then, the resulting line list was evaluated against so called "reference" spectra or "empirical" line lists [24] (see below) before implementation in GEISA-2015. In the spectral range 10.719-5098.661 cm-1, the previous H
216O data were replaced by 12520 lines of Coudert [25], computed from line position and line intensity analysis of two large data sets involving vibrational states up to the second triad. Both analyses were carried out with the Bending-Rotation approach [26]. The reader is referred to Ref. [25] for further information.
For H216O transitions up to the (010) vibrational state, with wavenumbers smaller than 2000 cm-1, a comparison between S, the intensity in the line list built in Ref. [25], and SHitran that from HITRAN-2012 [14] is presented on Fig. 1, The figure compares % intensity difference (S-SHitran)/S for the 3937 transitions common to both line lists. For a line intensity larger than 10-24 cm molecule-1 both sets of intensities agree to better than 10%.
16
Fig. 1. Comparison (S - SHitran) between S, the intensity in the line list built in Ref. [25] and adopted in GEISA-2015, and SHitran from HITRAN-2012 [14]. The intensity difference S - SHitran in % of the average intensity (S + SHitran)/2 is plotted as a function of the base 10 logarithm of SHitran in cm molecule-1 at 296 K. Plus signs (+) correspond to the 1514 transitions belonging to the ν2 band; full circles to the 1623 pure rotational transitions within the ground vibrational state; and full triangles to the 800 pure rotational transitions within the (010) vibrational state. ν2 band transitions in HITRAN-2012 come from Refs.
[25,40]. The 5% agreement observed in many cases stems from the fact that the results of reference [25]
were also used in GEISA-2015.
In the 5850–7920 cm-1 region, the GEISA-2015 list for H216O (and for H217O and H218O as well, see below) uses the empirical line list described in Mikhaïlenko et al. [27], from a joint participation of IAO and LIPhy. This GEISA update list, involving 18757 lines in the spectral range 5850.060-7920.315 cm-1 was obtained by gathering separate line lists recently obtained from spectra recorded using high sensitivity CW-CRDS of natural water [28-32] and is completed with literature data obtained by FTS for the strongest lines by Toth [33]. It has to be noted that there is a large literature suggesting that the intensities of the strong lines from [33] might be seriously in error especially above 8000 cm-1 and around 4000 cm-1; this is not the case in the 5850-8000 cm-1 spectral region considered in GEISA-2015.
The spectral sensitivity of the CW-CRDS recordings (min~ 10-11–10-10 cm-1) allowed the detection of lines with intensities down to the 10-29 cm molecule-1. The list was made mostly complete by including a large number of weak lines with positions calculated using experimentally determined energy levels and intensities computed by S.A. Tashkun [34] using the results of the variational calculations by Schwenke and Partridge [35]. After this first update step, the whole GEISA-2015 H216O line list was processed as follows.
New experimental results of Regalia et al. [36] (3867 transitions in total) have replaced the former GEISA-2011 positions and intensities in the 7924-9393 cm-1 region. The line positions from [37] between 9500 and 14500 cm-1 were recalculated using the calibration factor
17 of 0.99999989 proposed by Tennyson et al. [38]. Then positions and intensities of all new and former H216O data were checked against "reference" spectrum or "empirical" line list in which the positions are obtained from the energy levels derived by Tennyson et al. [38] with the additional inclusion of new experimental data from Refs. [27,30-32,36], and intensities available from variational calculations of Barber et al. [39]. As a consequence of this validation process, the following replacements or additions were made:
1. positions and intensities of about 900 incorrectly assigned lines, mostly coming from the previous GEISA editions, were corrected;
2. positions of all lines which deviated from the empirical data by more than 0.01 cm-1 were corrected;
3. simulated intensities data originating from Toth [40] were replaced by those of Barber et al. [39], mostly for the weakest lines.
Finally all empirical lines [24] with intensities larger than 10-29 cm molecule-1 at 296 K, missing in the initial line list, were added in the spectral region 0-26000 cm-1.
The final H216O GEISA-2015 line list has been supplemented by data from the empirical list generated by Naumenko [24]. GEISA-2015 contains 119,885 entries for the isotopologue H216O compared to 40,920 in GEISA-2011.
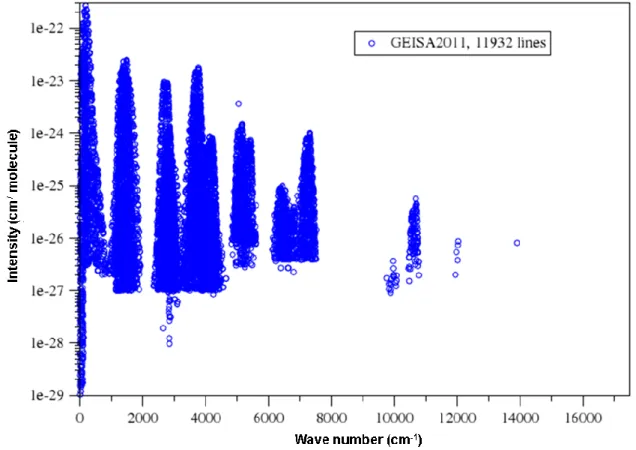
A graphical overview of the GEISA-2015 line intensities for H216O is shown on Fig. 2. The new intensity values cover the spectral regions: 10-5098 cm-1 [25], 5850-7920 cm-1 [27], and 7924-9392 cm-1 [38]. Above 9500 cm-1 and, partly, between 1200 and 8000 cm-1 the line intensities from GEISA-2011 were retained, these include data from Refs. [40, 41].
18
Fig. 2 Log scale graphical display of transition intensities (cm molecule-1 at 296 K) for H 216O.
2.2.1.3 H217O and H218O update process
New line lists provided by UCL, SRON, LIPhy and IAO, have been included in GEISA-2015 update for both H217O and H218O isotopologues. New data from LISA for H218O have been included, as well.
Line positions and intensities of H217O and H218O, from UCL, were taken from the line lists of Lodi and Tennyson [42], and provided new data in the spectral ranges 0.451-19945.257 cm-1 (22508 lines) and 0.052-19917.618 cm-1 (31,926 lines), for H217O and H218O respectively. This study is based on two developments:
First the work on an IUPAC-TG on water spectroscopy [43] which adopted the MARVEL procedure [44,45], to determine precise empirical values for the energy levels of H217O and H218O [46]. These energy levels were used to generate a list of transition frequencies which encompasses all the measured frequencies validated by the IUPAC-TG, and all those other allowed transitions between known energy levels. Then, line intensities were computed using the high accuracy, ab-initio dipole moment
function of Lodi et al. [47] and wave functions generated from a spectroscopically-determined potential energy surface [48]. Lodi and Tennyson developed a procedure for
19 determining the uncertainty in these intensities and, for a few cases where the calculated intensities were deemed unreliable, the empirical ones were retained.
It should be noticed that:
Regalia et al. [36] performed a comprehensive comparison of water absorption in the 6450 to 9400 cm-1 region based on a new experimental study. While their comparisons identified a significant number of issues with the spectroscopic data available in current compilations, the agreement with the H218O and H217O line lists of Lodi and Tennyson was, in general, excellent;
the recent work by Polyansky et al. [49] allows us to significantly increase the number of H218O and H217O energy levels known to experimental accuracy by exploiting the much more extensive list of known H216O levels. This work will be used to further enhance the line lists for the H218O and H217O isotopologues in future editions.
SRON provided updates in the 2.3 µm windows wavelength range which covers the windows used for the retrieval of H2O and the ratio HDO/H2O, by the SCIAMACHY instrument, on board ENVISAT. However, the spectroscopy of water lines in this region remained a large source of uncertainty for these retrievals. Consequently, Scheepmaker et al. [50] updated the spectroscopic line parameters of H217O and H218O in the 4175.123-4298.302 cm−1 spectral range, taking the results of Jenouvrier et al. [51] as the a priori input in their new line list processing method. These additional data have been retained for implementation in GEISA-2015 because they represent an improved spectroscopic dataset which has been tested on a series of ground based high resolution FTS spectra as well as on SCIAMACHY retrievals of H2O and on the ratio HDO/H2O. This improved spectroscopy has led to lower residuals in the FTS spectra compared to alternate available spectroscopic sources and the retrievals have become more robust against changes in the retrieval window. As a result, a total of 71 lines for isotopologues H217O (24 lines) and H218O (47 lines), were included in GEISA-2015, from the supplementary material available in [50].
In the 5850–7920 cm-1 spectral region, the GEISA-2015 list for H217O and H218O uses the empirical line list, from LIPhy and IAO, described in Mikhaïlenko et al. [27]. Two new series of entries, covering respectively, for H217O and H218O, the spectral ranges 5850.241-7905.616 cm-1 (3659 lines) and 5855.542-7919.033 cm-1 (6641 lines) have been implemented in GEISA-2015.
In the 20–2000 cm-1 spectral range, line parameters of H218O were updated based on the line position and line intensity analyses carried out in LISA by Coudert and Chelin [52] using
20 the Bending-Rotation approach [26]. In the line position analysis of Ref. [53], using 173 parameters, the data from Refs [54-60] were fitted up to J=17, Ka=17, and to the first Triad; they were reproduced with a dimensionless standard deviation of 1.2. The line parameters of H218O were updated fitting the limited line intensity data set of Refs. [60,61] involving the ground and (010) states only. 1760 line intensities were reproduced with a unit-less standard deviation of 1.5 using 18 parameters and a line list containing pure rotational and ν2 band transitions was built. An abundance-weighted intensity cut-off of 10-27 cm molecule-1 at 296 K was used assuming an isotopic abundance of 0.199983 %. Fig. 3 compares the intensities in this line list and those in HITRAN-2012 [14] for transitions belonging to the ν2 band of H218O. For this band, the intensity values in HITRAN-2012 were set to ab-initio calculated values given in Ref. [42]. A negative bias, more pronounced for strong lines, can easily be seen (-2.3%). For strong lines with a intensity larger than 10-23 cm molecule-1, the bias could reach -3.4%. The RMS value of the intensity differences is 3.2%. We have retained this line list because, as discussed in Ref. [52], this work both reproduces more accurately the experimental intensities from Refs. [60,61] than the line list of HITRAN-2012 [14] (example of the ν2 band of H218O where the intensity values in HITRAN-2012 were retrieved through ab-initio calculations (see Lodi and Tennyson [42]).
Fig. 3. A comparison between the intensity S of ν2 band transitions comprising the GEISA-2015 updated H218O line list and (SHitran) those from HITRAN-2012 [14] for the 971 transitions in both line lists with a wave number smaller than 2000 cm-1. The intensity difference S - S
Hitran in % of the average intensity (S + SHitran)/2 is plotted as a function of the base 10 logarithm of SHitran in cm molecule-1.
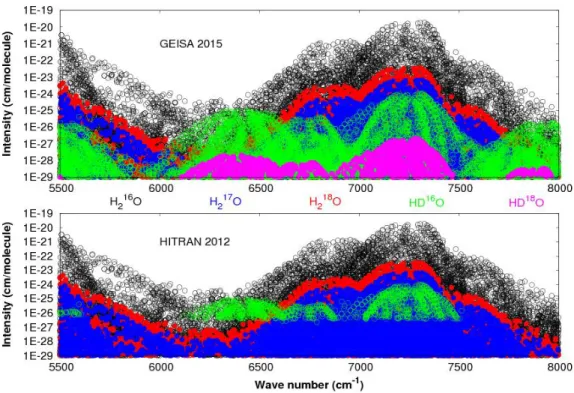
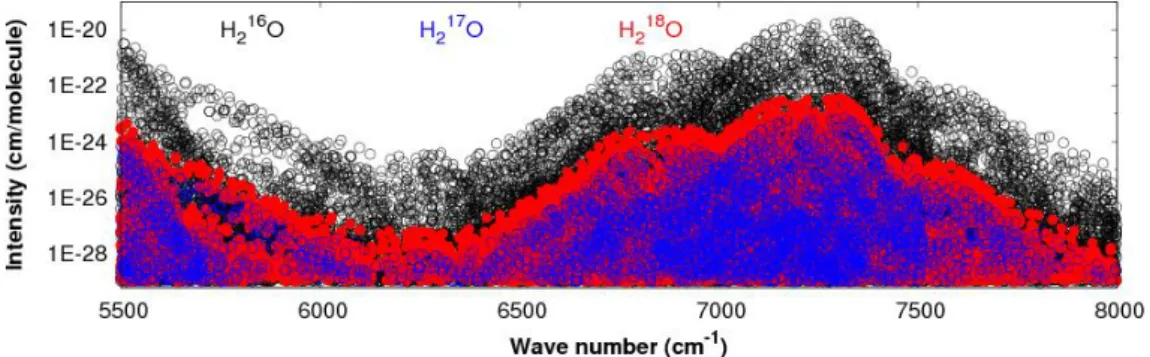
Finally, most of the previous data on H216O, H217O, H218O, in the 5850 - 7920 cm-1 spectral region, were replaced by the new line list (more than 29000 vibration-rotation transitions) of Mikhaïlenko et al. [27]. The advantages of this list, which incorporates all available experimental information, are discussed in [27]. An illustration of this new data set is
21 given, in Fig. 4, by the base 10 logarithm graphical display of intensities (cm molecule-1) for H216O, H217O, H218O (Y-Axis) in the spectral range 5850-7920 cm-1 (X-abscissa).
Fig. 4. Overview of Figline intensities (at 296 K, in logarithmic scale) in the GEISA-2015 line parameter database for water isotopologues, H216O, H217O, H218O, between 5850 and 7920 cm-1. The contribution of the different isotopologues is highlighted (H216O -black, H217O -blue, H218O -red).
2.2.1.4 Implementation of two new isotopologues: D216O and D218O in GEISA-2015
The data for D216O and D218O were originally based on a high resolution (0.02 cm-1) absorption spectrum recorded by Orphal and Ruth [53] for a mixture of D216O and H218O gases and designed to maximise the presence of HD18O. Significant quantities of the isotopologues H218O (~29%), HD16O (~22.5%), H216O (~14.5%), D218O (~9.3%) andD216O (~6.3%) were observed [52] and are at the origin of line lists of two new isotopologues, D216O and D218O, implemented in GEISA-2015.
However several (some unpublished), variational line lists and experimental lower level data exist for D216O [63-67] and D218O [63],[68],[69]. The IUPAC group have recently completed their analysis of D2O isotopologues [70] and these data will be used in a future update.
2.2.1.4.1 D216O:
The new D216O transitions have been implemented in GEISA-2015 in two spectral regions:
- The region 6378.92–6676.15 cm-1 where all observed D216O transitions agree with assignments by Ormsby et al. [64]. 295 lines were included in the analysis, of which 265 were assigned directly to observations including 40 blended lines. Most of the lines belong to the ν1+
22 ν2+ ν3 combination band and calculations agreed with observation within the spectral resolution of 0.02 cm-1. The experimental spectral resolution does not limit the precision of line positions except in the case of blended lines. Hence, for the current GEISA-2015 edition, all blended lines have been deleted from the datasets.
- The region between 5 and 7980 cm-1 contains a list of empirical line positions completed by variational line intensities. The line positions were calculated using the empirical energy levels recommended by an IUPAC task group [70]. Calculated line intensities, available at http://spectra.iao.ru/1366x647/en/mol/survey/1/ and based on the results of Partridge and Schwenke [71].
The list includes 5746 transitions of 18 vibration-rotation bands with maximum values of rotational numbers J and Ka equal to 24 and 14, respectively. This list corresponds to a cut-off
of 1×10-30 cm/molecule at 296K taking into account a natural abundance of 2.4197×10⁻⁸ for D216O.
2.2.1.4.2 D218O:
The D218O transitions between 6328 and 6638 cm-1 were recorded and identified in Down et al. [62] based on variational line list. A set of lower energy levels from Ni et al. [69] was used to determine the upper energy levels. The accuracy of line positions is estimated to be of 0.002-0.004 cm-1. About 150 D218O transitions from [62] approved by the IUPAC analysis [70] are implemented in GEISA-2015. These transitions belong, mostly, to (111)-(000) and (210)-(000) vibrational bands.
2.2.1.5 Line shape parameters
Line shape parameters for water vapor; the air-broadened half-widths, γair, its temperature dependence, nair, the air-induced line shifts, δair, and the self-broadened half-widths, γself, are added to the GEISA-2015 database from a number of sources.
For the three most abundant isotopologues of water, H216O, H218O, and H217O, the air-broadened half-widths, line shifts and self-air-broadened half-widths were added using a sophisticated scheme explained by Gordon et al. [72] that determines and eliminates the experimental outliers and then either uses their averages, if they exist, or the experimental values, or theoretical values calculated using the CRB method (see for instance Refs. [73],[74]),
23 or if no experimental or theoretical value exists, semi-empirical values from Jacquemart et al. [75]. When none of the above data are available, the half-width data are obtained from J-dependent polynomials [76]. The temperature dependence of the half-width is taken from measured values, if no data exist the data are obtained from a polynomial in J” that was developed by Gamache [77] using the data of Birk and Wagner [78] smoothened and extrapolated to J”=50. Note, when there are no data available for H218O or H217O, the corresponding data for H216O are used (if they exist).
For the air-D2O collision system, measured half-widths and line shifts are available [79-82] for a small number of transitions in the ν2, 2ν2- ν2, and ν3 bands. From these data a set of air-broadened half-widths as a function of rotational quantum numbers was made and these data were added to the database neglecting vibrational dependence. To augment the measurement database, the half-width data were taken and the average half-width as a function of J” determined. These data were extrapolated to J”=50 and fit to a polynomial. These data were used for lines for which there are no measured data or rotational transition data. The error in the averaged data was taken to be 50% of the averaged value. There are no measured data on the temperature dependence of the half-width or on coefficient n. The HITRAN H216O-air n values were used for D216O-air with the error set to 50%.
For the D2O-D2O collision system, the half-width, its temperature dependence, and the line shift (rotation band only) data are from the MCRB calculations of Gamache et al. [83]. Again vibrational dependence is assumed negligible for the half-width and its temperature dependence. For transitions for which MCRB calculations are not available, the MCRB data were averaged as a function of J” and extrapolated to J”=50. The average values were then used for transitions for which there were no half-width data. The error in the averaged half-widths was set to 50%.
2.2.2 CO2 (molecule 2)
2.2.2.1 Line list update description
The GEISA-2011 carbon dioxide line list is replaced by the current version of CDSD-296 databank [84] which forms the new GEISA-2015 CO2 line list. The CDSD-296 databank contains calculated line parameters (positions, intensities, air- and self-broadened half-widths, coefficients of temperature dependence of air-broadened half-widths and air pressure-induced
24 line shifts) for twelve sTable isotopic species of CO2(See Table 5 below). This databank was generated for a reference temperature 296 K and an intensity cut-off of 10-30 cm molecule-1. It contains 534,227 lines covering the 6-14,075 cm-1 spectral range. The line positions and intensities were calculated using the method of effective operators and are based on global weighted fits of the effective Hamiltonian and effective dipole moment parameters to the observed data collected from the literature. The fitted sets of the effective Hamiltonian parameters on average reproduce the observed line positions with the residuals about twice the experimental uncertainties. The fitted sets of effective dipole moment parameters reproduce most of the observed line intensities within their experimental uncertainties. Each isotopologue has been considered separately. The sets of the effective dipole moment parameters of the principal isotopologue were used to calculate the line intensities of the minor isotopologues. The isotopologue composition of the current version of CDSD-296, and consequently in GEISA-2015, is presented in Table 5. The isotopologue Identification Codes (ID), respectively in CDSD, HITRAN-2012 and GEISA-2015, are listed in columns 1 to 3; column 4 and 5 detail the chemical formula and the natural abundance corresponding to each isotopologue; the number of lines reported for each species is in column 6. Compared to GEISA-2011, the current version GEISA-2015 includes the spectral line parameters for three additional isotopologues: 17O12C17O, 17O13C18O and 17O13C17O. The line parameters for other minor isotopologues are considerably improved and the spectral ranges extended. These improvements are possible due to the extensive measurements of line parameters of the minor isotopologues performed in Paris [85], Grenoble [89-91], Hefei [86,92-94] and Brussels [95]. The stated errors for the line positions and intensities rely on the measurement errors and on the rough estimates performed for the extrapolated values.
Very recently Polyansky et al. computed an ab-initio dipole moment surface which has been used for the prediction of CO2 intensities below 8000 cm-1 with very high accuracy [96]. This has been combined with energy levels from CDSD-296 to give a new line list for CO2 [97] which will be considered as part of a future update.
25
Table 5
CO2 isotopologues in GEISA-2015 (from Tashkun et al. [84])
CDSD ID HITRAN-2012 ID GEISA-2015 ID Molecular species Abundance #lines 1 1 626 12C16O2 0.9842 170846 2 2 636 13C16O2 1.106 x 10⁻² 70462 3 3 628 16O12C18O 3.947 x 10⁻³ 115942 4 4 627 16O12C17O 7.339 x 10⁻⁴ 72120 5 5 638 16O13C18O 4.434 x 10⁻⁵ 40143 6 6 637 16O13C17O 8.246 x 10⁻⁶ 23901 7 7 828 18O12C18O 3.957 x 10⁻⁶ 10593 8 8 728 17O12C18O 1.472 x 10⁻⁶ 15206 9 9 727 (New) 17O12C17O 1.430 x 10⁻⁷ 6623 10 0 838 18O13C18O 4.446 x 10⁻⁸ 3111 11 Abs 738 (New) 17O13C18O 1.654 x 10⁻⁸ 3621 12 Abs 737 (New) 13C17O2 1.55 x 10⁻⁹ 1659
2.2.2.2 Line shape parameters:
The algorithm to add CO2 line shape parameters to the GEISA-2015 line list uses data from the measurement database [98]. The database values were filtered and outliers removed. However, most of the data in the algorithm rely on recent CRB calculations of the line shape parameters for CO2 broadened by N2, O2, air, and CO2 [99-101]. These calculations show excellent agreement with measurement; average differences of a fraction of a percent and standard deviations of 1-3 %. The CRB calculations allowed the study of the dependence of the line shape parameters on J” values, temperatures, and vibrational bands that are yet to be measured. A study of the vibrational dependence of the half-width and line shift, and the temperature dependence of these parameters was recently completed by Gamache and Lamouroux [102]. From this study they developed an algorithm based on a generalization of the method of Gamache and Hartmann [103] that can predict the line shape parameters for CO2 in collision with N2, O2, air, and CO2 [104]. CRB calculations were used to produce data up to J”=160 and these data were extrapolated to J”=200. The prediction algorithm determines the half-width and the line shift for any vibrational transition with J”≤200 for temperatures in the range 150-2000 K. The accuracy of the algorithm is discussed in Ref. [104].
26 The prediction algorithm uses the rotational and vibrational quantum numbers and temperature as inputs and returns the half-width and line shift for the particular transition at the specified temperature. Given the line shape data at a number of temperatures, the temperature dependence of these parameters can be determined using the power law model
. (1)
It is known that the temperature exponent, n, is strongly dependent on the temperature range chosen [101]. Here the temperature dependence of the air- and self-broadened half-width were determined using the prediction algorithm data for the temperature range 200-350 K (Earth). For applications to other atmospheres, different values should be used. For example the NASA Ames CO2 database [105] contains temperature exponents for 4 temperature ranges corresponding to applications to Mars (150-296 K), Earth (200-350 K), Venus (296-700 K), and high temperature applications (700-2000 K).
Using the algorithm, the half-width, its temperature dependence, and the line shift for both air- and self-broadening of CO2, and the corresponding errors in these parameters were added to the GEISA-2015 CO2 transitions.
g(T) =g
( )
T0 To T é ëê ù ûú n27 2.2.3 O3 (molecule 3)
Forty-six bands of the main ozone isotopologue,16O3, in the 3266-6997 cm-1 spectral region are newly included in the GEISA-2015 database, as summarized in Table 6. A graphical intensity overview of the new data is shown on Fig. 5.
Table 6
Ozone bands newly included or updated in GEISA-2015 line parameter database. Upper and lower state vibrational band identifiers (vi (i=1,2,3)) are given in column 1, with associated number of archived lines, spectral region in cm-1, total intensity in cm molecule-1 at 296 K, and source references, in columns 2 to 5, respectively.
Band # lines Spectral region
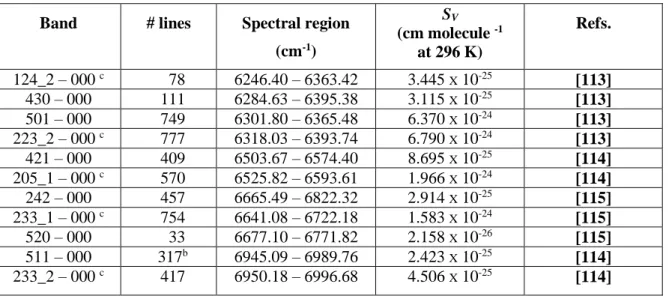
(cm-1) SV (cm molecule -1 at 296 K) Refs. 022 – 000 2616a 3266.51 – 3488.18 1.111 X 10⁻²² [106] 121 – 000 2210a 3373.90 – 3487.30 6.329 X 10⁻²² [106] 220 – 000 684a 3488.15 – 3627.87 2.500 X 10⁻²³ [106] 311 – 100 729 3739.97 – 3826.22 2.398 X 10⁻²³ [107] 005 – 100 508 3742.91 – 3726.13 1.660 X 10⁻²³ [107] 104 – 100 51 3752.69 – 3863.55 8.192 X 10⁻²⁵ [107] 005 – 001 278 3807.31 – 3917.54 9.849 X 10⁻²⁴ [107] 311 – 001 436 3810.30 – 3946.73 9.846 X 10⁻²⁴ [107] 104 – 001 950 3820.17 – 3894.94 2.218 X 10⁻²² [107] 123 – 010 783 4531.73 – 4599.39 6.534 X 10⁻²³ [108] 330 – 010 47 4554.65 – 4601.97 1.830 X 10⁻²⁴ [108] 104 – 000 1093 4802.98 – 4978.61 7.789 X 10⁻²³ [107] 005 – 000 1514 4806.33 – 4938.21 5.300 X 10⁻²² [107] 311 – 000 1053 4827.65 – 4928.49 3.450 X 10⁻²² [107] 203 – 000 1086 4997.30 – 5085.47 1.263 X 10⁻²² [109] 132 – 000 27 5028.06 – 5085.33 1.396 X 10⁻²⁴ [109] 123 – 000 784 5216.76 – 5300.21 5.902 X 10⁻²³ [108] 401 – 000 896 5244.80 – 5319.26 8.153 X 10⁻²³ [108] 330 – 000 43 5252.48 – 4302.26 1.514 X 10⁻²⁴ [108] 024 – 000 2 5271.73 – 5316.28 6.791 X 10⁻²⁶ [108] 015 – 000 622 5625.97 – 5704.62 3.465 X 10⁻²³ [108] 420 – 000 10 5663.20 – 5706.33 3.065 X 10⁻²⁵ [108] 105_1 – 000 c 730 5708.95 – 5790.90 4.943 X 10⁻²³ [111] 312 – 000 14 5753.33 – 5786.12 4.336 X 10⁻²⁵ [111] 421 – 010 303 5815.58 – 5873.74 3.570 X 10⁻²⁵ [114] 133 – 000 702 5852.44 – 5931.22 4.718 X 10⁻²⁴ [114] 411 – 000 444 5895.17 – 5956.76 1.379 X 10⁻²⁴ [114] 233_1 – 000 c 528 5941.73 – 6021.44 7.950 X 10⁻²⁵ [115] 034 – 000 264 5956.88 – 6078.00 8.529 X 10⁻²⁵ [112] 105_2 – 000 c 678 5983.44 – 6071.43 2.097 X 10⁻²⁴ [112] 124_1 – 000 c 999 6019.98 – 6201.30 2.934 X 10⁻²⁴ [112] 223_1 – 000 c 954 6031.75 – 6130.78 1.179 X 10⁻²³ [112] 510 – 000 39 6067.96 – 6136.40 1.275 X 10⁻²⁵ [112] 331 – 000 168 6163.49 – 6207.75 1.371 X 10⁻²⁵ [112] 025 – 000 1003 6225.12 – 6311.46 7.702 X 10⁻²⁴ [113]
28
Band # lines Spectral region
(cm-1) SV (cm molecule -1 at 296 K) Refs. 124_2 – 000 c 78 6246.40 – 6363.42 3.445 X 10⁻²⁵ [113] 430 – 000 111 6284.63 – 6395.38 3.115 X 10⁻²⁵ [113] 501 – 000 749 6301.80 – 6365.48 6.370 X 10⁻²⁴ [113] 223_2 – 000 c 777 6318.03 – 6393.74 6.790 X 10⁻²⁴ [113] 421 – 000 409 6503.67 – 6574.40 8.695 X 10⁻²⁵ [114] 205_1 – 000 c 570 6525.82 – 6593.61 1.966 X 10⁻²⁴ [114] 242 – 000 457 6665.49 – 6822.32 2.914 X 10⁻²⁵ [115] 233_1 – 000 c 754 6641.08 – 6722.18 1.583 X 10⁻²⁴ [115] 520 – 000 33 6677.10 – 6771.82 2.158 X 10⁻²⁶ [115] 511 – 000 317b 6945.09 – 6989.76 2.423 X 10⁻²⁵ [114] 233_2 – 000 c 417 6950.18 – 6996.68 4.506 X 10⁻²⁵ [114]
Notes: a,b) The number of transitions is not the same as that given in the S&MPO databank [116] due to use of a cut-off of respectively 3×10-27 instead of 2×10-26 and 1×10-28 instead of 2×10-28(in cm molecule-1). c) For these bands the additional ranking number is given to distinguish the upper states which could have the same principal normal mode contributions as discussed in [118]; SV is the integrated band intensity computed as a sum of vibration-rotation line intensities with the Imin and Jmax cut-off specified for each band in original publications cited in the last column.
Fig. 5. Overview of line intensities of the supplementary ozone data included in GEISA-2015 in the
3266-6997 cm-1 spectral region. The intensity cut-off is much lower above 5800 cm-1 because the laser CRDS measurements in this range were more sensitive resulting in the detection and assignments of much weaker lines [113-115].
The twenty-four bands up to 5800 cm-1 were obtained from the analysis of FTS recorded in GSMA laboratory of Reims University [106-111,116], while the twenty two other bands were recorded by CW-CRDS in LIPhy laboratory of Grenoble University [112-115]. This new dataset, beginning at 3266 cm-1, was based on results of previous work by Mikhailenko et al. [117] included in GEISA-2011 which covered the spectral range below 3000 cm-1. All these data are implemented in the S&MPO databank (Babikov et al. [116]), jointly developed and maintained by the Institute of
Atmospheric Optics (Tomsk) and Reims University. Relevant details about experimental accuracies for each of the analyzed bands, theoretical models and rovibrational assignments can be found in Refs. [106,111-118].
![Fig. 3. A comparison between the intensity S of ν 2 band transitions comprising the GEISA-2015 updated H 2 18 O line list and (S Hitran ) those from HITRAN-2012 [14] for the 971 transitions in both line lists with a wave number smaller than 2000 cm -1](https://thumb-eu.123doks.com/thumbv2/123doknet/13101744.386062/21.892.288.606.679.919/comparison-intensity-transitions-comprising-updated-hitran-hitran-transitions.webp)
![Fig. 11 shows that, in GEISA-2015, the v 2 band positions are clearly shifted by ~ 0.002 cm -1 , with a maximum difference reaching to 0.055 cm -1 , compared to HITRAN-2012 [14]](https://thumb-eu.123doks.com/thumbv2/123doknet/13101744.386062/51.892.105.653.356.766/positions-clearly-shifted-maximum-difference-reaching-compared-hitran.webp)