HAL Id: halshs-02955190
https://halshs.archives-ouvertes.fr/halshs-02955190
Submitted on 9 Dec 2020HAL is a multi-disciplinary open access archive for the deposit and dissemination of sci-entific research documents, whether they are pub-lished or not. The documents may come from teaching and research institutions in France or abroad, or from public or private research centers.
L’archive ouverte pluridisciplinaire HAL, est destinée au dépôt et à la diffusion de documents scientifiques de niveau recherche, publiés ou non, émanant des établissements d’enseignement et de recherche français ou étrangers, des laboratoires publics ou privés.
Spatial networks
César Ducruet
To cite this version:
César Ducruet. Spatial networks. AAG. International Encyclopedia of Geography, Wiley, 2020, �10.1002/9781118786352.wbieg2059�. �halshs-02955190�
Spatial networks
Dr. César Ducruet
Centre National de la Recherche Scientifique (CNRS) [email protected]
Pre-final version of the entry published in Richardson D. et al. (Eds.) (2020) The International Encyclopedia of Geography, Wiley-Blackwell & Association of American
Geographers, https://doi.org/10.1002/9781118786352.wbieg2059
Abstract
In geography, the spatial dimension of networks has long been taken for granted. This is not the case of natural sciences, of which physics, distinguishing amongst spatial and non-spatial relationships. The core element at stake is thus distance, resulting in time and cost to travel the network and/or to create new links and nodes. Yet in many disciplines, spatial networks remain analyzed in a binary fashion, without taking into account the length of links and the local characteristics of nodes. This article reviews how the spatial dimension of networks is addressed in the geographic literature and in other sciences, concluding to a need for further research in this field.
From graph theory to complex networks
From the 1960s onwards, geographers kept on studying networks from a pure topological perspective, looking at the way nodes (vertices) are connected by links (edges). Graph theory was introduced in geography to measure and describe the topology of many transport and communication networks. Quantitative geographers doing so never explicitly coined their study object ‘spatial network’ because the spatial dimension was seen as inherent to the network, for instance when studying a set of connected cities within a certain region or country. All the different network measures and indices made available at the time were based on the number of nodes and links, without qualifying them by spatial metrics. Perhaps, only the detour index – the difference between straight linear distance and real distance – explicitly addressed the influence of space on network setting. One main reason had been the dominant focus of geographers on technical networks, or networks made of physical infrastructure (e.g. road, rail), which exist in a two-dimensional space and can be characterized as planar
networks, i.e. having nodes at every link intersection. The belief that all networks are spatial did not motivate further efforts to look at the influence of space compared with a non-spatial context. It is only in the 2000s that physicists, pushed by a growing interest for real-world networks, investigated the difference between spatial and non-spatial networks, revisiting existing network models and providing numerous empirical evidences. This shift from graph theory to complex networks was soon embraced by various geographers, but without
necessarily following the same steps, as space continued to be taken for granted or to be a consequence rather than a cause of network structure.
A spatial network as a set of nodes and links embedded in a certain geometry. Such a geometry confers to the network a certain interaction range for nodes to connect and thus to establish links. Nodes, as places, are characterized by locational factors, from simple coordinates on a plane to more advanced attributes such as their size and function.
Recognizing the important legacy of quantitative geography in network studies, Barthelemy (2010) demonstrated that existing network models were insufficient in catching those effects, while “for many critical infrastructures, communication or biological networks, space is relevant: most of the people have their friends and relatives in their neighbourhood, power grids and transportation networks depend obviously on distance, many communication network devices have short radio range, the length of axons in a brain has a cost, and the spread of contagious diseases is not uniform across territories”.
Quantitative geographers mainly devoted their attention to transport, planar networks of small size, with a main emphasis on the shape of infrastructural links. This is explained by the lack of computational power at the time and by the scarcity of data on flows compared with tracks. In their goal to understand and compare the structure and evolution of such networks, geographers did not pay much attention to modelling. In turn, the famous model by Taaffe et al. (1963) on the phased corridor concentration in West Africa did not refer to graph theory. The latter, a branch of mathematics, long remained dominated by the random graph model proposed by Erdos and Renyi (1959), where the distribution of nodes’ degree (i.e. their number of topologically adjacent neighbors) follows a normal or Gaussian distribution. Graph theory kept on analyzing random graphs until physicists, in the late 1990s, formulated new models, closer to real-world phenomena. Watts and Strogatz (1998) proposed the small-world network model, characterized by a shorter average path lenth and a higher average clustering coefficient than a random graph of equal size. The average path length refers to the average number of stops between two nodes and the average clustering coefficient is the proportion of connected triangles in the maximum possible number of triangles in the graph. Barabási and Albert (1999) proposed the scale-free network model, defined by a power-law distribution of nodes’ degree, i.e. containing few large degree nodes and many low degree nodes. Such networks have in common to be more easily navigable due to the presence of hubs, bridges, and cliques.
The topological structure of spatial networks
As natural scientists increasingly criticized the overlooking of space in existing studies, a specific category of ‘spatial network’ gradually emerged in the physics literature (Gastner and Newman, 2004) in opposition to those existing “only in an abstract “network space” where the precise positions of the network nodes have no particular meaning”. Gastner and Newman (2004) demonstrated that most edges are short in terms of kilometric length, since “long edges are presumably more expensive to create and maintain than short ones”, should it be the Internet, the highway network or the airline network (in the United States). It was also remarked by Barthelemy (2003) that long-distance edges have a high probability to connect large nodes or ‘hubs’, while short ones connect mainly smaller nodes with each other and with the hub. The author relates this to the preferential attachment process in complex networks discussed previously by Barabási and Albert (1999), as when a new node is added to the network, it will not only connect a larger existing node but a geographically closer one.
Subsequent works and experiments provided additional clues about the difference made by space (and distance) in the organization and structure of networks. Those concluded to a higher average clustering coefficient in spatial networks due to the importance of proximity in node connectivity, a higher disassortativity as the network grows (negative correlation
between node degrees across node pairs), a higher correlation between degree and betweenness, an increased influence of the barycentre on betweenness values, and an increased cliquishness (Ducruet and Beauguitte, 2014). Other studies using clustering techniques demonstrated that numerous networks are in fact regionalized, such as the global airline network (Guimera et al., 2005), the global maritime network (Kaluza et al., 2010), and the Belgian mobile phone network (Expert et al., 2011), influenced either by physical
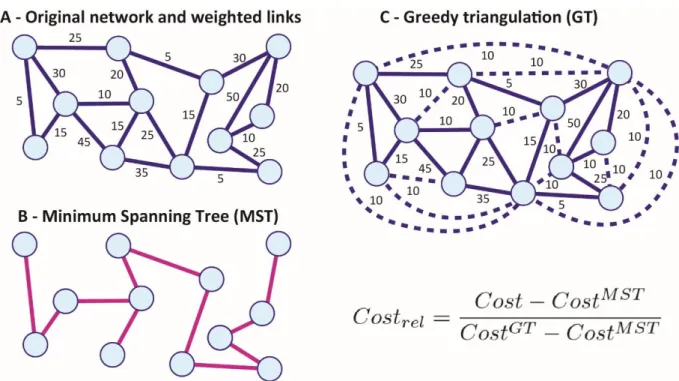
geography constraints or by administrative borders. At the local level, the “relative cost” methodology was used by Cardillo et al. (2006) to compare the spatial structure of many streets networks worldwide (Figure 1).
Figure 1: Methodology for calculating the cost of a spatial network Source: adapted from Rodrigue and Ducruet (2020)
From the original network where edges are weighted by a given metric (e.g. distance, travel time or cost), the Kruskal algorithm extracts the optimal cost route (B), defined by one single line connecting all nodes or Minimum Spanning Tree (MST). The Greedy
Triangulation (GT) consists in adding all possible links between nodes (C) to make it complete without breaking its planarity. This allowed the authors to find direct
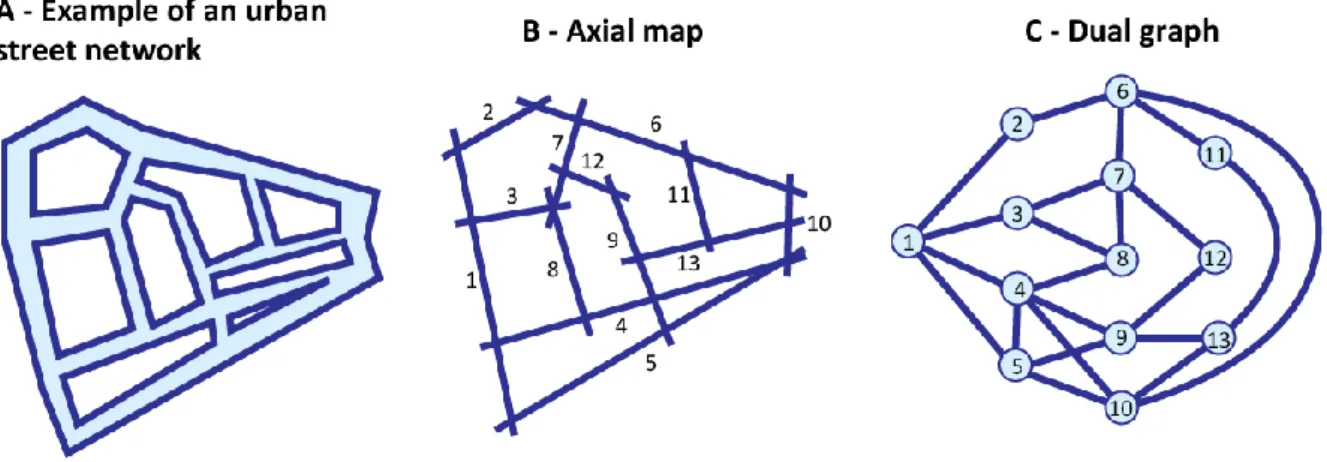
correspondence between network cost and urban planning type. In sociology, the “space syntax” school, also focused on urban streets, proposed to look at the urban network structure from a more “cognitive space” perspective (Hillier and Hanson, 1984). While engineers and most other scientists often considered street segments as edges and their intersections as nodes, it was envisaged to redefine streets based on the visual and name continuity of avenues
and boulevards (Figure 2). Once redefined, these linear objects made of multiple segments are considered as nodes and their mutual intersections as links (axial map), thereby transforming the initially planar graph into a non-planar one (dual graph), providing new – and in some way more realistic – ways to study accessibility and centrality within cities.
Figure 2: The space syntax methodology to analyse urban streets networks Source: adapted from Rodrigue and Ducruet (2020)
Geographers and regional scientists increasingly adopted complex network methods to analyse graphs in a spatial context, from the 2000s onwards. They particularly insisted on the importance for social networks to be considered across space, and in their criticism of graph-theoretical methods, proposed various empirical studies mixing complex network analysis and spatial analysis, from spatial interaction models to Geographic Information Systems (GIS). Yet, the adoption of complex network methods by spatial scientists often left aside space itself, by considering the sole topology of nodes and links (see a review by Ducruet and Beauguitte, 2014). One important difference with natural sciences had been, however, to put a stronger emphasis on nodes’ socio-economic characteristics and their influence on centrality and connectivity. In the global maritime network for instance, as in the work of Gastner and Newman (2004), vessel traffic enormously concentrates over the shortest inter-port links, which are also the most numerous. This is mainly explained by the importance of coastlines on the design of shipping routes, in particular container shipping that follows scheduled port-to-port services along maritime ranges. In turn, ports with higher strength (or total vessel traffic) tend to connect over longer distances, as they are fit with better infrastructure and cargo handling equipment than smaller ports (Ducruet et al., 2018), just like large airports in the airline network (Guimera et al., 2005). These large ports also act as pivots through hub-and-spokes systems along major interregional trade lanes, with high frequency traffic towards secondary nodes for intraregional redistribution. Not only are shorter links weightier; they are also the most diversified in terms of the distribution of traffic types across the network. Thus, the probability for a link (edge) to carry more traffic and more commodities diminishes with distance. Larger ports are also the most diversified, and they impressively centralize the network at the expense of more specialized ones, such as Rotterdam and Singapore. Last but not least, another important feature of spatial networks is the existence of gravitational rules,
whereby traffic volume (or link strength) decreases with distance but increases with (node) size, in accordance with the Newton’s law of gravity and echoing numerous works about spatial interaction in geography and regional science. This was demonstrated in various contexts such as maritime networks (Kaluza et al., 2010), highway networks in Korea (Jung et al., 2008), and mobile phone networks in Belgium (Krings et al., 2009). The latter study demonstrated the importance of taking into account the local characteristics of nodes like population, as “communication intensities scale linearly with city size”.
Spatiality as local socio-economic embedding
The inclusion of node attributes had been particularly fruitful for the study of spatial properties in this particular case. At the level of subnational regions connected by maritime flows, it was found that regions with higher degree and betweenness centrality are also those with a higher interaction range, a higher share of container traffic, and in the meantime concentrate population, Gross Domestic Product (GDP), and tertiary activities. In opposition, regions specialized in the primary sector and solid bulks traffic (e.g. grain, coal) have a low connectivity and interaction range. More advanced localities are thus better connected, as shown in the case of telecommunication flows in the UK for instance (Eagle et al., 2010) but also in other contexts such as the Chinese airline network. At the level of urban areas, larger cities by population kept on concentrating vessel traffic since the late nineteenth century. Such cities are also the most central in the network whatever the metric used (degree
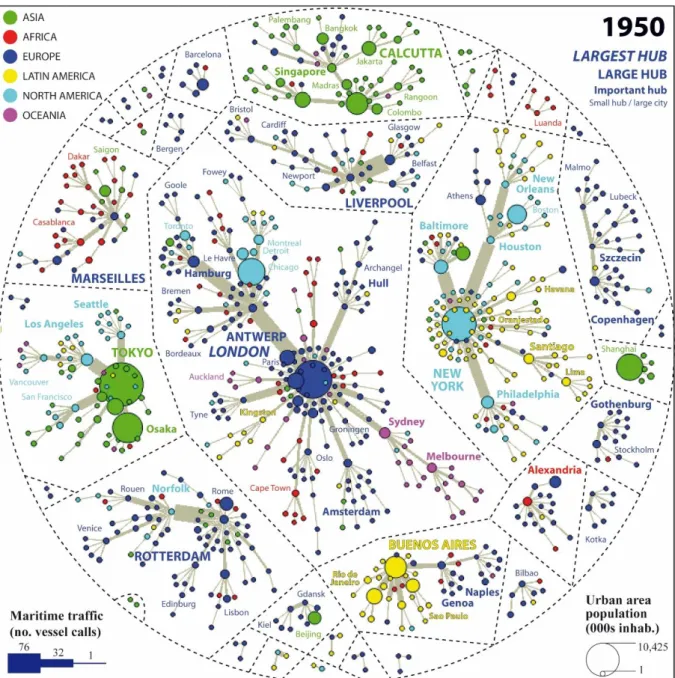
centrality, betweenness centrality, clustering coefficient), are the most diversified in terms of vessel types, and connect at farther distances than smaller cities. Local market size is thus a strong determinant of traffic distribution and network configuration, due to the role of cities as production and consumption centres. The application of single linkage analysis as in the pioneering work of Nystuen and Dacey (1961) on telecommunication flows among Oregon cities served the identification of the network’s backbone and main hubs as well as barrier effects (see Figure 3). This could highlight the isolation effect provoked by political barriers to trade at different dates, as in the case of Barcelona, Gdansk, and Shanghai in 1950, Havana (Cuba) in 1970 and 1980, Tel-Aviv in 1980, but also by war effects (Beirut in 1970) and distance effects, with the recurrent isolation of Melbourne and Sydney. Such isolated subcomponents made of a small number of cities stood apart the main, larger components polarized by the world’s largest cities such as New York, London, and Tokyo. Yet, these “global cities” were gradually replaced overtime by smaller ones at the centre of the network, such as the aforementioned Rotterdam and Singapore, due to the fading port-city relationship and the concentration of major port and shipping services in a few main hubs handling the biggest ships and acting as transhipment nodes between and within regions.
Many other works have compared node centrality with node characteristics such as population, density, and economic features. Numerous algorithms were used to cluster spatial networks and discover barrier effects, understood as the effect of territories on network structure, thereby revealing hidden information often neglected by natural scientists in their primary interest for general laws. Efforts have been made to better visualize spatial networks, especially in the case of non-planar graphs that are often poorly readable when plotted on a map (Rozenblat and Melançon, 2013). Yet, the inclusion of distance parameters in the analysis of spatial networks remains limited to a few works. Another avenue of research has
been to analyse simultaneously several complementary networks, or “networks of networks”, to understand their robustness and the way nodes embed in multiple layers. Overall, spatial network analysis remains highly static in scope, as we do not have many examples of how such networks grow overtime. The future of spatial network research shall thus lean towards the study of an all-encompassing system taking into account distance, node characteristics, and dynamics.
Figure 3: Nodal regions and urban hierarchies in the global maritime network, 1950 Source: Ducruet et al. (2018)
SEE ALSO: Graph Theory; Network Analysis; Transport Geography; Transport and
References and Further Readings
Barabási A.L., Albert R. (1999) Emergence of scaling in random networks. Science, 286(5439): 509-512.
Barthelemy M. (2003) Crossover from scale-free to spatial networks. Europhysics letters, 63: 915.
Barthelemy M. (2010) Spatial networks. Physics Reports, 499:1-101.
Cardillo, A. Scellato, S., Latora, V., Porta, S. (2006) Structural properties of planar graphs of urban street patterns. Physical Review E, 73(2): 066107.
Ducruet C., Beauguitte L. (2014) Network science and spatial science: Review and outcomes of a complex relationship. Networks and Spatial Economics, 14(3-4): 297-316.
Ducruet C., Cuyala S., El Hosni A. (2018) Maritime networks as systems of cities: The long-term interdependencies between global shipping flows and urban development (1890-2010). Journal of Transport Geography, 66: 340-355.
Eagle N., Macy M., Claxton R. (2010) Network diversity and economic development. Science, 328(5981): 1029-1031.
Erdös P., Rényi A. (1959) On random graphs. Publicationes Mathematicae, 6: 290-297. Expert P., Evans T.S., Blondel V.D., Lambiotte R. (2011) Uncovering space-independent communities in spatial networks. Proceedings of the National Academy of Sciences USA, 108(19): 7663-7668.
Gastner M.T., Newman M.E.J. (2004) The spatial structure of networks. The European Physical Journal B, 49: 247-252.
Guimera R., Mossa S., Turtschi A., Amaral L.A. (2005) The worldwide air transportation network: Anomalous centrality, community structure, and cities' global roles. Proceedings of the National Academy of Sciences USA, 102(22): 7794-7799.
Hillier B., Hanson J. (1984) The Social Logic of Space. Cambridge University Press.
Jung W.S., Wang F., Stanley H.E. (2008) Gravity model in the Korean highway. Europhysics Letters Association, 81(4): 48005.
Kaluza P., Kölzsch A., Gastner M.T., Blasius B. (2010) The complex network of global cargo ship movements. Journal of the Royal Society Interface, 7(48): 1093-1103.
Krings G., Calabrese F., Ratti C., Blondel V.D. (2009) Urban gravity: a model for intercity telecommunication flows. Journal of Statistical Mechanics: Theory and Experiment, 7: L07003.
Nystuen J.D., Dacey M.F. (1961) A graph theory interpretation of nodal regions. Papers in Regional Science, 7(1): 29-42.
Rodrigue J.P., Ducruet C. (2020) Graph theory: definition and properties. The Geography of Transport Systems, https://transportgeography.org/?page_id=5976
Rozenblat C., Melançon G. (2013) Methods for Multilevel Analysis and Visualisation of Geographical Networks. Springer.
Taaffe EJ, Morrill RL and Gould PR (1963) Transport expansion in underdeveloped countries: A comparative analysis. Geographical Review, 4: 503-529.
Watts, D.J., Strogatz S.H. (1998) Collective dynamics of 'small-world' networks’. Nature, 393 (6684): 440-442.
Key Words