HAL Id: hal-02180566
https://hal.inria.fr/hal-02180566
Submitted on 11 Jul 2019HAL is a multi-disciplinary open access
archive for the deposit and dissemination of sci-entific research documents, whether they are pub-lished or not. The documents may come from teaching and research institutions in France or abroad, or from public or private research centers.
L’archive ouverte pluridisciplinaire HAL, est destinée au dépôt et à la diffusion de documents scientifiques de niveau recherche, publiés ou non, émanant des établissements d’enseignement et de recherche français ou étrangers, des laboratoires publics ou privés.
Acoustic impacts of geometric approximation at the
level of velum and epiglottis on French vowels
Ioannis Douros, Pierre-André Vuissoz, Yves Laprie
To cite this version:
Ioannis Douros, Pierre-André Vuissoz, Yves Laprie. Acoustic impacts of geometric approximation at the level of velum and epiglottis on French vowels. ICPhS 2019 - International Congress of Phonetic Sciences, Aug 2019, Melbourne, Australia. �hal-02180566�
ACOUSTIC IMPACTS OF GEOMETRIC APPROXIMATION AT THE
LEVEL OF VELUM AND EPIGLOTTIS ON FRENCH VOWELS
Ioannis K. Douros1,2, Pierre-André Vuissoz2, Yves Laprie1
1Université de Lorraine, CNRS, Inria, LORIA, F-54000 Nancy, France, 2Université de Lorraine, INSERM U1254, IADI, F-54000 Nancy, France,
ioannis.douros@loria.fr, pa.vuissoz@chru-nancy.fr, yves.laprie@loria.fr
ABSTRACT
In this work we study the effect of the velum and epiglottis on speech production of five French vow-els. Our purpose is to examine whether it is pos-sible to simplify the geometry of the vocal tract in the framework of articulatory synthesis to achieve a simpler geometric description without changing the acoustic properties. In the present study, we use MRI to acquire the 3D shape of the vocal tract with simultaneous recording of the speech signal. The geometric two-dimensional shape derived from these data was used as an input of numerical acous-tic simulations. The geometrical shape was edited at the level of epiglottis and velum (with or with-out epiglottis, with or withwith-out a constant wall ap-proximation at velum) and the spectra obtained via numerical acoustic simulations were compared with those obtained from audio recordings. This allows the impact of these articulators and geometrical sim-plifications to be assessed.
Keywords: velum, epiglottis, speech production, acoustic simulation, French vowels
1. INTRODUCTION
Geometric modeling of the vocal tract is used in par-ticular to produce input data for articulatory synthe-sis [2]. One of the challenges is to obtain a con-cise description and to remove geometric details that do not change the acoustic parameters significantly, from a perceptual point of view. Those simplifica-tions could lead to a reduction of the number of pa-rameters used to describe the vocal tract geometry, and consequently make the calculation simpler.
In general, more attention is paid to the jaw, tongue, lips and larynx, compared to the velum and epiglottis. The velum is indirectly taken into account more for representing the opening of the velopha-ryngeal port than for its impact on the oral cavity.
Concerning the epiglottis, its position depends on the size of the pharyngeal cavity, and thus on the
tongue position. For a vowel with a large back cavity (as in /i/), the epiglottis stays apart from the back of the tongue. On the other hand, when the back cavity is more constricted (as for /a/), the epiglottis is sometimes pressed against the back of the tongue. Our approach to geometric modeling of the vo-cal tract is based on an articulatory model that in-dependently controls each of the articulators. The first articulator is the mandible (which corresponds to the opening of the jaw) because it influences the tongue and the lips. Two parameters are sufficient to control the opening of the jaw with good preci-sion. The tongue is the articulator that achieves the greatest number of articulation places, and its de-scription must be fine enough to reach a precise po-sition and shape. For this reason, (unlike the Maeda model [10]), we use between 6 and 10 deformation factors. The influence of the jaw is taken into ac-count to determine the influence of the tongue and lips.
The epiglottis is actually a cartilage, and therefore the influence of other articulators that interact with the epiglottis, i.e. the mandible, tongue, and larynx, is decisive. Hence, their contribution through linear regression factors is more important than its intrin-sic deformation factors. Once the midsagittal shape is calculated, it is necessary to find all the resonating cavities, their area functions and the global topology to run the acoustic simulation [6]. Geometrical sim-plifications would allow faster simulations and avoid changes of the global topology when a small cavity appears.
The objective of this work is to investigate the im-pact of geometric simplifications in order to better understand those that can be made without removing important acoustic cues. Unlike Arnela’s work [1], which treats the vocal tract as a whole by transform-ing it into a piece-wise elliptical and then cylindri-cal tube, we treat the articulators separately because articulatory synthesis requires that each of them be controlled independently of each other.
simul-taneous speech recordings of five French vowels to study the articulators’ effects. The real speech sig-nal was used as a reference. We edited the images to remove the velum and the epiglottis and then used acoustic simulations to see how the transfer function of the vocal tract was affected, and, therefore, what the role is of these two articulators in phonation.
2. MATERIALS AND METHODS
2.1. Data
For the purpose of this study, we used an MRI data part of a study approved by an ethics committee and the subject gave written informed consent (Clinical-Trials.gov identifier: NCT02887053). The subject retained for the data acquisition is a healthy male French native speaker at the age of 32, without any reported speaking or hearing problems.
The MRI data (same as described in [5]) was ac-quired on a Siemens Prisma 3T scanner (Siemens, Erlangen, Germany). We used the 3-dimensional cartesian vibe sequence (T R = 3.57 ms, T E = 1.43, FOV= 22 × 20 mm, f lip angle = 9 degrees) for the acquisition. To acquire the speech signal, we used FOMRI III (Optoacoustics, Or Yehuda, Israel) fiber optic microphone. Since the audio recordings were made at the same time as the MRI acquisition, we used FASST toolbox [12] to denoise the speech sig-nal using the denoising algorithm proposed in [11]. Despite the improvement of the signal quality for-mant frequencies cannot be easily determined, espe-cially above 2500 Hz. Values of Table 1 are thus given as an indication, especially those above 2000 Hz, and not as a reference.
2.2. MRI data processing
The process of MRI data is mainly divided in two steps: 1) pre-process the data to make some correc-tions regarding the orientation of the 3D images axis and 2) segment the vocal tract.
To make adjustments to the axis of the 3D images we used 3DSlicer software [8] (http://www.slicer.org). Among its several func-tions, like visualizing and processing various types of medical images such as MRI and CT, 3DSlicer can be used to resample the images using several kinds of interpolation techniques like linear or Lanczos.
For the image segmentation tasks, we used ITK-SNAP software [17]. It is a software designed to segment medical images and offers tools and al-gorithms both for 2D and 3D image segmentation. For example, it provides region competition and
geodesic active contours algorithms for automatic segmentation [3, 18]. As far as manual segmenta-tion is concerned, it offers polygon-based tools and various types of paint brushes in order to specify the segmented region.
2.3. Acoustic simulations
For the purposes of our experiments, we used k-wave toolbox for MATLAB [15] to simulate how the acoustic wave propagates through the vocal tract un-til it reaches the lips. The applications of k-wave toolbox range from acoustic [14] and ultrasound wave propagation [16], [9] to photoacoustic tomog-raphy [13].
Although there are various popular methods for acoustic wave propagation, like finite differences, fi-nite elements and boundary element methods, they generally take a significant amount of time since they require a small time step and a lot of grid points per wavelength. k-wave solves these issues by in-terpolating a Fourier series through all of the grid points to get an estimation of the gradient. This way, the computations are faster since they require less grid points and employ Fast Fourier Transform (FFT) to make the calculations. An issue that arises is that as the wave reaches the grid boundaries, it keeps propagating by entering from the opposite site. To prevent this, k-wave implements an absorb-ing boundary condition called Perfect Match Layer (PML).
3. EXPERIMENTS
The experiment consisted of two parts: 1) image processing and 2) acoustic simulations.
3.1. Image processing
In this experiment we used five vowels of the French language, /a, œ, i, o, y/. First, we used 3Dslicer soft-ware to correct the axis orientation of the 3D images since there was a small angular offset of about −6 degrees in the sagittal field. We used Lanczos in-terpolation to resample the image with the Lanczos filter parameter chosen as a = 4.
When then employed the ITK-SNAP software for semi-automatic segmentation of the vocal tract 3D volume.
The Nearest Neighbourhood algorithm was used to create the probabilistic map to use for the auto-matic segmentation of the vocal tract. We used two classes and 10000 points for consideration as the nearest points for class categorization for the cre-ation of the probabilistic map. Then an active
con-Figure 1: 3D volume of /i/ vowel
tour algorithm was applied and the vocal tract mesh generated (Figure 1).
3.2. Editing of the vocal tract geometry
Since the impact of the 3rd dimension to the acous-tics of the vowels is not very significant [7, 5], we extracted the mid-sagittal slices from the 3D shapes to further process and use for our study. We used the 3D shape as a guide to correct segmentation errors in the mid-sagittal slices (especially in the region of velum and epiglottis) caused by blurring due to im-age interpolation.
For every mid-sagittal slice, three more segmen-tation versions were created by processing the seg-mented images (4 images per vowel in total with the original). In the first version we edited the vocal tract geometry to withdraw the epiglottis, in the sec-ond we used a constant wall approximation at velum (by withdrawing the velum extremity) and in the third version we combined the previously described simplifications (Figure 2). These three versions of every vowel along with the original were the data used in the simulations.
Finally we used meshlab [4] to smooth every mesh by applying Laplacian smoothing filter with step 3. For every vowel, about 5 hours of processing was required, with the biggest amount of time spent on the manual segmentation step.
3.3. Acoustic simulations
The simulation code that we used was built in MAT-LAB environment using k-wave toolbox. The data used as an input are in the form of a 3D surface mesh with sagittal width 1.2mm. We transformed
2D segmentation of /i/ vowel with full
vocal tract
2D segmentation of /i/ vowel without
epiglottis
Spectrum of /i/ vowel with full
vocal tract
Spectrum of /i/ vowel without
epiglottis
2D segmentation of /i/ vowel without
velum
2D segmentation of /i/ vowel without epiglottis
and velum
Spectrum of /i/ vowel without
velum
Spectrum of /i/ vowel without epiglottis
and velum
Figure 2: The four versions of /i/ phoneme (original, without epiglottis, without velum, with-out velum and epiglottis) with the corresponding spectrums below them
the surface mesh into a volumetric representation us-ing voxels and we took the projection of the voxel-based geometry to a 2D plane parallel to the sagittal field. Finally we ran the simulations.
A challenge that we faced was specifying the pa-rameters of the simulation so that there would be a balance between the stability of the simulation, a
good approximation of the realistic conditions and a sufficient duration of simulated signal. In our case, the computational grid has a size of 128 × 128 (coro-nal × axial) with grid spacing dx= dy= 1mm. A PML layer of 10 grid points was added at the bound-aries of every side to solve the issue of circular wave propagation that happens when simulating with k-wave, the problem that was mentioned in the method section. We manually select the source position for every vowel to correspond to the position of the vo-cal folds. As a source, we used a disc of 5 grid point radius that emits a delta pulse of pressure (spread-ing equally in all directions) and 1Pa amplitude. The medium properties inside the vocal tract were cin= 350m/s, din= 1kg/m3and the properties out-side were cout= 1000m/s, dout= 1000kg/m3, where cin, cout are the speed, and din, dout are the densi-ties inside and outside the vocal tract respectively. We simulated the signal for 30ms, with a time of 3 ∗ 10−8, resulting in 1000001 signal samples. The pressure signal was recorded with a sensor placed at the end of the vocal tract and the maximum allowed frequency of the grid was 175KHz. Every simula-tion requires on average 3 hours and 20 minutes.
Finally we computed the transfer function of ev-ery vocal tract and computed the peaks that appear in the frequency domain to compare them with the formants of the original audio signal (Table 1).
4. DISCUSSION
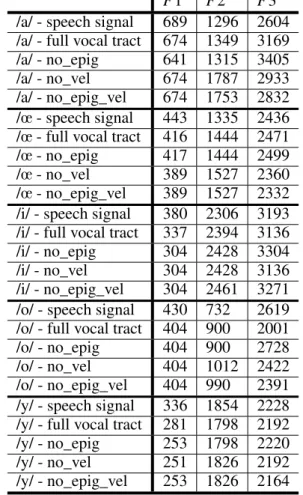
The first remark concerns the values of the formant frequencies of the normal vocal tract without simpli-fications. The lying position and noise in the MRI machine largely explain the deviations from the ex-pected values for these vowels of a male speaker.
The second remark, which is illustrated by Fig-ure 2 is that the original geometry with the small cavity between the epiglottis and tongue root gives rise to a zero in the spectrum. This is all the more pronounced since the epiglottis is well separated from the tongue. In the case of the vowel /i/, it is also noted that a zero appears in the region of F3-F4.
Regarding simplifications, it should be noted in Table 1 that they do not have a very significant im-pact on the first formant. For F2, the velum simpli-fication has a more pronounced effect. The changes at the velum have an impact on the constriction be-tween the front and back cavities of the vocal tract. This mainly affects F2 which is more sensitive to the length of the cavities.
As can be seen on the spectra of numerical sim-ulations, the impact of the epiglottis corresponds to the appearance of a small cavity that adds zeros in
Table 1: speech signal / simulations with full vo-cal tract / simulations without epiglottis (no_epig) / simulations without velum (no_vel) / simulations without epiglottis and velum (no_epig_vel) for-mants computation in Hertz for the five vowels.
F1 F2 F3
/a/ - speech signal 689 1296 2604 /a/ - full vocal tract 674 1349 3169
/a/ - no_epig 641 1315 3405
/a/ - no_vel 674 1787 2933
/a/ - no_epig_vel 674 1753 2832 /œ - speech signal 443 1335 2436 /œ - full vocal tract 416 1444 2471
/œ - no_epig 417 1444 2499
/œ - no_vel 389 1527 2360
/œ - no_epig_vel 389 1527 2332 /i/ - speech signal 380 2306 3193 /i/ - full vocal tract 337 2394 3136
/i/ - no_epig 304 2428 3304
/i/ - no_vel 304 2428 3136
/i/ - no_epig_vel 304 2461 3271 /o/ - speech signal 430 732 2619 /o/ - full vocal tract 404 900 2001
/o/ - no_epig 404 900 2728
/o/ - no_vel 404 1012 2422
/o/ - no_epig_vel 404 990 2391 /y/ - speech signal 336 1854 2228 /y/ - full vocal tract 281 1798 2192
/y/ - no_epig 253 1798 2220
/y/ - no_vel 251 1826 2192
/y/ - no_epig_vel 253 1826 2164 the spectrum, essentially at high frequency since this cavity is small. Nevertheless, the impact of this cav-ity is far from being negligible above 2500Hz when the epiglottis is well separated from the tongue (thus not for /a/) because the zero appears in the region of F3 and/or F4. Further work will focus on the devel-opment of simplification control algorithms to en-sure that they have as little impact as possible on the formants.
5. ACKNOWLEDGEMENT
This work was financed by Lorraine Université d’Excellence (LUE) grant and ANR ArtSpeech.
6. REFERENCES
[1] Arnela, M., Dabbaghchian, S., Blandin, R., Guasch, O., Engwall, O., Van Hirtum, A., Pelorson, X. 2016. Influence of vocal tract geometry sim-plifications on the numerical simulation of vowel sounds. The Journal of the Acoustical Society of America140(3), 1707–1718.
[2] Birkholz, P., Jackel, D. Aug 2003. A three-dimensional model of the vocal tract for speech synthesis. 15th International Congress of Phonetic Sciences - ICPhS’2003, Barcelona, Spain 2597– 2600.
[3] Caselles, V., Kimmel, R., Sapiro, G. 1997. Geodesic active contours. International journal of computer vision22(1), 61–79.
[4] Cignoni, P., Callieri, M., Corsini, M., Dellepiane, M., Ganovelli, F., Ranzuglia, G. 2008. Meshlab: an open-source mesh processing tool. Eurographics Italian Chapter Conferencevolume 2008 129–136. [5] Douros, I. K., Vuissoz, P.-A., Laprie, Y. 2019. Comparison between 2d and 3d models for speech production: a study of french vowels. International Congress on Phonetic Sciences, Melbourne, Aus-tralia.
[6] Elie, B., Laprie, Y. Sept. 2016. Extension of the single-matrix formulation of the vocal tract: con-sideration of bilateral channels and connection of self-oscillating models of the vocal folds with a glottal chink. Speech Communication 82, 85–96. [7] Ericsdotter, C. 2007. Detail in vowel area
func-tions. Proc of the 16th ICPhSSaarbrücken, Ger-many. 513–516.
[8] Fedorov, A., Beichel, R., Kalpathy-Cramer, J., Finet, J., Fillion-Robin, J.-C., Pujol, S., Bauer, C., Jennings, D., Fennessy, F., Sonka, M., others, 2012. 3d slicer as an image computing platform for the quantitative imaging network. Magnetic resonance imaging30(9), 1323–1341.
[9] Jaros, J., Treeby, B. E., Rendell, A. P. 2012. Use of multiple gpus on shared memory multiprocessors for ultrasound propagation simulations. Proceed-ings of the Tenth Australasian Symposium on Par-allel and Distributed Computing-Volume 127. Aus-tralian Computer Society, Inc. 43–52.
[10] Maeda, S. 1990. Compensatory articulation dur-ing speech: Evidence from the analysis and syn-thesis of vocal-tract shapes using an articulatory model. In: Hardcastle, W., Marchal, A., (eds), Speech production and speech modelling. Amster-dam: Kluwer Academic Publisher 131–149. [11] Ozerov, A., Vincent, E., Bimbot, F. 2012. A general
flexible framework for the handling of prior infor-mation in audio source separation. IEEE Transac-tions on Audio, Speech, and Language Processing 20(4), 1118–1133.
[12] Salaün, Y., Vincent, E., Bertin, N., Souviraà-Labastie, N., Jaureguiberry, X., Tran, D. T., Bim-bot, F. 2014. The flexible audio source separation toolbox version 2.0. ICASSP.
[13] Treeby, B. E. 2013. Acoustic attenuation com-pensation in photoacoustic tomography using time-variant filtering. Journal of biomedical optics 18(3), 036008.
[14] Treeby, B. E., Cox, B. 2010. Modeling power law absorption and dispersion for acoustic propagation using the fractional laplacian. The Journal of the Acoustical Society of America127(5), 2741–2748. [15] Treeby, B. E., Cox, B. T. 2010. k-wave:
Mat-lab toolbox for the simulation and reconstruction of photoacoustic wave fields. Journal of biomedi-cal optics15(2), 021314.
[16] Wise, E. S., Treeby, B. E. 2013. Full-wave nonlin-ear ultrasound simulation in an axisymmetric co-ordinate system using the discrete sine and cosine transforms. Ultrasonics Symposium (IUS), 2013 IEEE International. IEEE 1374–1377.
[17] Yushkevich, P. A., Piven, J., Hazlett, H. C., Smith, R. G., Ho, S., Gee, J. C., Gerig, G. 2006. User-guided 3d active contour segmentation of anatom-ical structures: significantly improved efficiency and reliability. Neuroimage 31(3), 1116–1128. [18] Zhu, S. C., Yuille, A. 1996. Region competition:
Unifying snakes, region growing, and bayes/mdl for multiband image segmentation. IEEE transac-tions on pattern analysis and machine intelligence 18(9), 884–900.