Simulation Based Assessment of Heat Pumping Potential in
Non-Residential Buildings – Part 2: Parametric Study
Stephane Bertagnolio1, Pascal Stabat2, Samuel Gendebien1 and Philippe André3 1Thermodynamics Laboratory, University of Liège, Liège, Belgium
2Centre Énergétique et Procédés - Mines Paristech, Paris, France
3Departments of Environmental Sciences and Management, University of Liège, Belgium
Corresponding email: [email protected]
SUMMARY
This paper is the second one in a series of three papers presenting the assessment methodology of heat pump systems developed in the frame of the IEA-ECBCS Annex 48 project. A package of simulation tools is developed in order to assess the energy and environmental performances and costs of various reversibility and heat recovery solutions dedicated to space heating and cooling. This paper presents the results of an extended parametric study aiming in assessing the potential of the considered heat pump systems in the European building stock.
INTRODUCTION
This paper aims to assess the saving potentials in terms of primary energy and CO2 emissions of different heat pump systems in office buildings by means of a parametric study. This study relies on the heat pump systems simulation tools developed in the frame of the IEA-ECBCS Annex 48 project [1]. Four types of air-conditioned office buildings, defined based on a study of the French building stock, are considered for the simulations: from small suburban office buildings (1000 m²) to large office buildings (15000 m²). Five climatic zones, defined to be representative of the Europe-15 are used for the simulations. The HVAC system considered in this study is an air-water system.
Firstly, the methodology of the present study and the considered cases are presented. Secondly, one classical primary HVAC system (S0: boiler+chiller) and four heat pump systems configurations are considered and simulated for each case: (S1) reversible air-to-water heat pump, (S3) dual condenser heat pump, (S5A) air-to-water loop systems and (S5B) ground coupled heat pump. The results of this 100 parametric runs are then presented and compared.
METHODOLOGY
The first step of this study was to generate the heating and cooling demand profiles for the considered cases. This was done by means of the building energy simulation tool Consoclim [2]. Twenty cases have been considered at this stage of the study, based on 5 different climatic zones and 4 types of buildings. Then, 5 different heat pump systems have been considered and compared. Finally, one hundred simulation runs have been done in this parametric study (Figure 1).
Figure 1. Parametric study cases
Climatic zones
Europe-15 is divided into five distinct climatic zones (Figure 2). The locations of a same climatic zone are characterized by similar heating and cooling degree days. Each climatic zone is represented by one location whose typical weather data are available: Athens, Lisbon, Turin, Paris and Munich [3].
a) b)
Figure 2. Climatic zones
Building Types
Four types of buildings are considered in the present study [3]:
- Type 1A: large glazed office buildings with peripheral zones (offices) and core zones (meeting rooms); floor: 15000 m² ; window-to-wall ratio : 35%
- Type 1C: large glazed office buildings with peripheral zones only (offices and meeting rooms); floor: 15000 m² ; window-to-wall ratio : 45%
- Type 2: medium office buildings; floor : 5000 m² ; window-to-wall ratio : 22% - Type 3: small office buildings; floor : 1000 m² ; window-to-wall ratio : 40%
All the buildings have similar orientations, envelope components, internal loads, occupancy profiles, internal setpoints and infiltration and ventilation rates. All these parameters have been fixed to average values. More details about the considered cases are given in [3].
Secondary HVAC system
Only air-water systems (single duct CAV system and fan coil units) are considered in the present study. Fan coil units installed in the zones provide local heating and cooling. The CAV air handling unit provides fresh air and includes a heat recovery system. Humidity control is not taken into account.
In the next steps of this study, all the heating secondary HVAC components are supposed to be operated with low temperature hot water at a (constant) temperature of 45°C. The (constant) chilled water temperature is fixed at 7°C.
Heat pump system configurations
In total, nine heat and cold production systems have been modeled in the frame of this project [1]. Only five heat and cold production systems are considered in the present parametric study:
- System 0: classical separated heat and cold productions (independent boiler and chiller)
- System 1: reversible air-to-water heat pump system sized for cooling (with backup boiler for heating). Priority is given to cooling.
- System 3: dual-condenser heat pump system sized for cooling (with backup boiler for heating). Priority is given to cooling.
- System 5A: reversible ground coupled heat pump (sized for heating) with backup boiler.
- System 5B: ground coupled heat pump (sized for heating) with direct ground cooling and backup boiler.
These configurations correspond to classical primary HP system options available on the market. Water loop and VRF systems, combining the functions of a primary system, a secondary system and a distribution network, will be studied in further papers.
Inputs/Parameters/Outputs
The main inputs of the simulation models developed and used in the frame of this work [1] are the pre-computed hourly heating and cooling demands and the corresponding weather data.
Table 1. Heat pumps rating performance
System EER COP
0 2.5 -
1 2.5 2.7
3 2.5 3.5
5A 3.8 3.6
5B 3.8 3.6
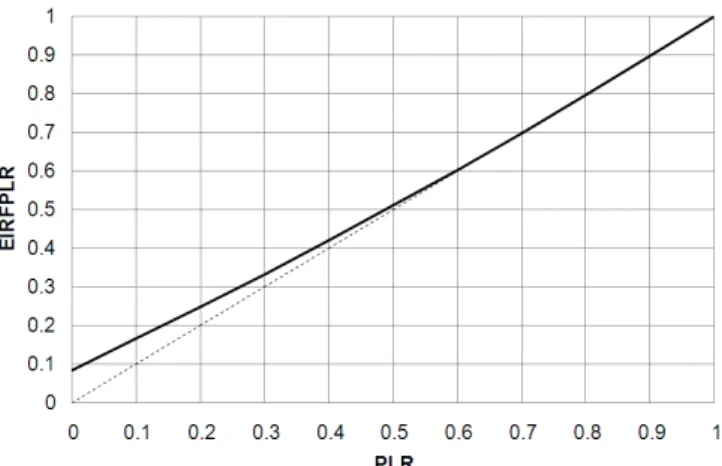
Figure 3. Heat pumps part load performance (Electricity Input Ratio as function of the Part Load Ratio)
The parameters of the models include performance and capacities of the considered HVAC components. The capacities of the equipments vary from case to case and are determined based on the same rules of thumb (depending of the heating and cooling peaks). The rating and full load performance of the heat pumps depend of the configuration and are based on actual manufacturer data (for air-to-water, water-to-water and dual-condenser heat pumps) chosen as representative of the actual heat pump market. On the contrary, the part load performances follow the same generic trend (Figure 3) for the different systems. The rating conditions for each system are defined according to EN14511 [5]. A nominal boiler efficiency of 90% is used for all the simulations.
RESULTS
Final and primary energy consumption
Computed electricity and gas consumptions have been compared in terms of final and primary energy consumptions. Because up to data values of conversion factors were not available, the average EU values given in EN15603 [6] have been used to compare the considered heat pump systems (1, 3, 5A and 5B) to the reference system (0). A conversion factor of 3.31 is used for electricity and a factor of 1.35 is used for natural gas.
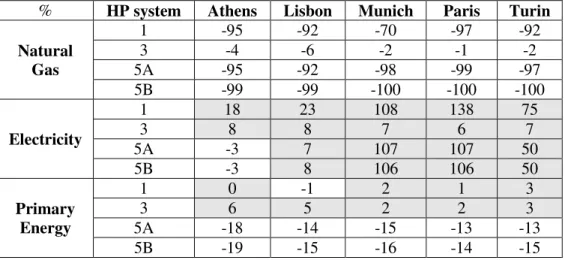
The relative variations (in % of the reference consumption, positive values correspond to an increase of the consumption and negative values correspond to a decrease of the consumption) are given in Table 2. Since the differences between the considered building types are limited, average values are presented. It appears that the reversible heat pump systems (1,5A and 5B) provide larger natural gas savings than heat pump systems able to handle heat recovery only (system 3). This is mainly due to the fact that the selected cases (buildings and climate zones) have rarely simultaneous heating and cooling demands. This trend is confirmed when looking at primary energy savings. It should be noticed that, the very small natural gas savings provided by the system 3 do not balance the increases of the electricity consumption related to the use of the heat pump. This finally results in an increase of the primary energy consumption.
Table 2. Relative energy consumption variation compared to system S0 (average for the four building types considered)
% HP system Athens Lisbon Munich Paris Turin
Natural Gas 1 -95 -92 -70 -97 -92 3 -4 -6 -2 -1 -2 5A -95 -92 -98 -99 -97 5B -99 -99 -100 -100 -100 Electricity 1 18 23 108 138 75 3 8 8 7 6 7 5A -3 7 107 107 50 5B -3 8 106 106 50 Primary Energy 1 0 -1 2 1 3 3 6 5 2 2 3 5A -18 -14 -15 -13 -13 5B -19 -15 -16 -14 -15
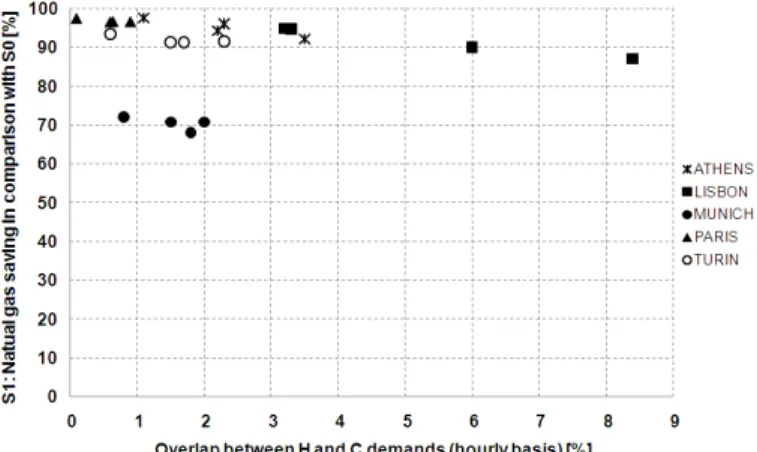
Natural gas savings resulting of the use of the system 1 (reversible air-to-water heat pump- are represented as a function of the percentage of overlap between heating and cooling demands (compared on an hourly basis) in Figure 4. As mentioned above, the potential of this
heat pump system is quite high in the considered cases and decreases slowly as the percentage of overlap between the two demand profiles increases. The effect of the sizing can also be highlighted: on the contrary to the other cases, the high difference between the heating and cooling peaks in Munich leads to a non-sufficient capacity of the heat pump (sized for cooling) in heating mode. The balanced peak demands of Paris and the bigger cooling peaks in Turin, Lisbon and Athens lead to a sufficient capacity of the heat pump in heating mode.
Figure 4. System 1: Natural gas savings Table 3: Average values of EER and COP (S1)
Location EERavg COPavg
ATHENS 2.79 2.19
LISBON 2.79 2.29
MUNICH 2.85 1.97
PARIS 2.81 2.10
TURIN 2.80 2.02
Figure 5. Reversible Air-to-Water heat pump COP (heating mode)
Seasonal performances of the considered systems can also be studied by means of the simulation models used. The values of the average annual heating COP of the reversible air-to-water heat pump are given in Table 3. As expected, COPs are higher in Athens and Lisbon but stay under 2.3 due to low part load operation (air-to-water heat pump sized for cooling). In colder regions (Paris, Munich and Turin), the average annual COPs are lower and vary between 1.97 and 2.1. Indeed, in these regions, even if heat pumps are operating a higher load rate (balanced peak heating and cooling loads), the negative effect of the lower outdoor temperatures leads to lower seasonal performances.
As shown in Figure 6, the reversible air-to-water heat pump (system 1) results in very small primary energy savings in mild climates (Athens and Lisbon). In colder climates (Munich, Paris and Turin), this system leads to an increase of the primary energy consumption since the reduction of the natural gas consumption is more than compensated by the increase of the electricity consumption. Even if the recovery heat pump (system 3) is less adapted than the other systems in the considered cases (smaller recovery potential), it leads to a reduction of
the total primary consumption mainly because of the better EER in cooling mode. Ground coupled heat pump systems (systems 5A and 5B) lead to reductions of total primary energy consumption in all cases (between 13 and 19%) because of their higher COPs in heating mode (water-to-water heat pump with high and quite stable evaporation temperature) and EERs in cooling mode (water cooled chiller with low condensation temperature) compared to other systems.
Figure 6. Annual primary energy consumption per square meter of floor area (Type 1A building)
It should be noticed that the small differences in the results provided by systems 5A and 5B are due to the variations of the EER/COP of the heat pump (different for reversible and a non-reversible machines) since the potential gain related to the use of direct ground cooling stays marginal and has not been highlighted in the present study because of the considered simulation hypotheses.
Of course, the previous observations are highly dependent of the arbitrary conversion factors used to convert gas and electricity consumptions in primary energy consumption and of the performance of the considered units. For example, the reversible air-to-water heat pump provides more than 97% of the heating demand of the building located in Paris with an average annual heating COP of 2.10 (compared to a boiler efficiency of 90%) but leads to an increase of 1.7% the primary consumption within the meaning of the European standards (conversion factor of 3.31 for electricity and 1.35 for natural gas). In the meaning of the French standard (2.58 for electricity and 1 for natural gas), the same results lead to an increase of 4.1% of the primary energy consumption.
CO2 emissions
The seasonal performance of the HP systems can also be compared in terms of CO2 emissions. National average annual values of CO2 emissions per consumed kWh of electricity for Greece, Portugal, Germany, France and Italy have been used for the comparison [7]. The same average CO2 emission rate for natural gas has been used for the five considered countries.
In Athens (highest average CO2 emission rate in Europe-15: 0.814 kg CO2/kWh), the reversible air-to-water heat pump (systems) lead to a slight increase of the annual CO2
emissions (+5%). Indeed the ratio of the “electrical” CO2 emission rate (0.814 kg/kWh) to the “gas” CO2 emission rate (0.231 kg/kWh) do not allow to decrease the global CO2 emissions with this system. Some reductions of CO2 emissions (between 14%) are possible but are mainly due to the better cooling EER of the systems 5A and 5B (allowing consistent reduction of the electricity consumption related to cold production). Situations in Munich and Turin are similar and only ground coupled systems can lead to sensible reductions of the annual CO2 emissions (Figure 7 and Table 4).
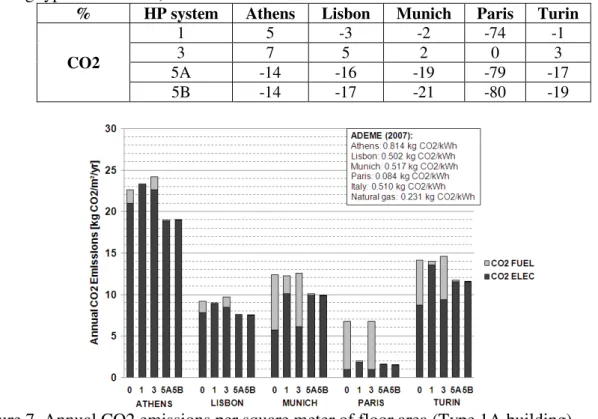
Table 4. Percentage of CO2 emissions variations compared to system S0 (average for the four building types considered)
% HP system Athens Lisbon Munich Paris Turin
CO2
1 5 -3 -2 -74 -1
3 7 5 2 0 3
5A -14 -16 -19 -79 -17
5B -14 -17 -21 -80 -19
Figure 7. Annual CO2 emissions per square meter of floor area (Type 1A building)
The very low CO2 emission rate of France (due to the large part of the electricity produced by nuclear plants) leads to very important reduction of the total CO2 emissions of the considered buildings (between, and 74 and 80%). Only the recovery heat pump system (system 3) does not lead to a sensible reduction of the CO2 emissions. It also appears that the very simple reversible air-to-water heat pump system with a quite low seasonal COP (2.1) can provide environmental performance as good as high performance ground coupled heat pump systems.
DISCUSSION
The simulation models developed in the frame of the IEA-ECBCS Annex 48 project can be use to perform extensive parametric studies. The major influences (effects of the temperature of heat sources and sinks, part load behavior…) and components (heat pump, heat source and heat sink, auxiliaries…) are taken into account in the present models.
Four buildings located in five climate zones and equipped with 5 different heat pump systems have been considered in the present study. The analysis of the simulation results led to the following observations:
- Better performances could be obtained by using more efficient heat pumps (higher rating COPs) and low temperature emitters (radiant heating system).
- Only primary HVAC system consumptions have been considered in the present study. This methodology is efficient to assess the potential of such systems but does not allow optimizing the system operation (including secondary HVAC system).
- Sizing and part load performances have a large influence on the seasonal performance of a heat pump system.
- In general, heat pump systems are interesting in terms of CO2 emissions and primary energy consumption only if the global efficiency of the considered electrical network is sufficiently high. In some European countries, improvements should be brought to electrical power plants before considering heat pump systems as an opportunity for space heating.
- In countries where the CO2 emission rate per produced kWh is quite low (because of the intensive use of renewable energy sources or nuclear plants to produce electricity, as in France), even very simple heat pump systems (such as reversible air-to-water heat pump) can lead to interesting environmental results.
- If the CO2 emission rate per produced kWh is high (e.g. in Greece), only high performance heat pump systems (e.g. ground coupled heat pump systems) should be considered for space heating. Low COP systems could even lead to supplemental CO2 emissions.
- In the case of building retrofit and design studies, sophisticated heat pump systems should only be considered if a global energy efficiency approach aimed to reduce building’s global energy consumption (including lighting, appliances, mechanical ventilation…) is followed.
The present study should be completed by considering buildings with higher simultaneous heating and cooling demands (to assess the potential of recovery systems) and integrated heat pump systems (WLHP or VRF systems).
ACKNOWLEDGEMENT
This work is performed with the support of the Walloon Region of Belgium and of IEA-ECBCS programme.
REFERENCES
1. Bertagnolio, S., Stabat, P., Soccal, B., Gendebien, S., André, P. 2010. Simulation based assessment of heat pumping potential in non-residential buildings – Part 1: Modeling. Clima 2010 conference, Antalya, Turkey.
2. Consoclim. 2002. Cahier des Algorithmes – version 2.3. In-french.
3. Stabat, P., Andre, P., Bertagnolio, P. et al. 2010. Analysis of bulding heating and cooling demands in the purpose of assessing the reversibility and heat recovery potentials. IEA-ECBCS Annex48 project final report. www.ecbcs-48.org
4. Stabat, P., Marchio, D. 2009. Opportunities for reversible chillers in office buildings in Europe. Building Simulation: An International Journal. Vol. 2, pp. 95-108.
5. EN 14511-2-2008 Air conditioners, liquid chilling packages and heat pumps with electrically driven compressors for space heating and cooling – Part 2: test conditions.
6. EN 15603-2007. Energy performance of buildings – Overall energy use and definition of energy ratings.
7. ADEME. 2007. Guide des facteurs d’émissions – calcul des facteurs d’missions et sources bibliographiques utilisées. Bilan carbone version 5.0.