2013 DATA UPDATE:
TRENDS AND MARKET FORCES SHAPING SMALL COMMUNITY
AIR SERVICE IN THE UNITED STATES
Michael D. Wittman
MIT International Center for Air Transportation
MIT Small Community Air Service White Paper No. 6
Report No. ICAT-2014-03
May 2014
MIT International Center for Air Transportation (ICAT)
Department of Aeronautics & Astronautics
Executive Summary
What is the Purpose of this Report?
This document is an update to MIT Small Community Air Service White Paper No. 1—Trends
and Market Forces Shaping Small Community Air Service in the United States
1. This report
provides updated analysis and data appendices including 2013 schedule data. This will allow
readers to investigate the continuing effects of U.S. airline capacity discipline and the changes in
available domestic service at the 462 U.S. airports examined in the earlier report. As with the
2013 report, the data contained in this report has been sourced from Diio Mi.
How Has Available Domestic Air Service in the U.S. Changed Since 2012?
Our 2013 report on trends and market forces shaping small community air service in the U.S.
showed that many smaller U.S. airports saw levels of available domestic flights and seats fall
from 2007-2012 as a result of an economic downturn, high and volatile fuel prices, and a U.S.
airline management strategy called “capacity discipline.” Through capacity discipline, airlines
kept levels of domestic capacity growth low relative to historical levels despite a recovery in the
U.S. economy. Capacity discipline has been in place in the U.S. since 2010, and the strategy has
proved to be profitable as airlines removed economically unviable service and duplicate
connectivity to secondary hubs.
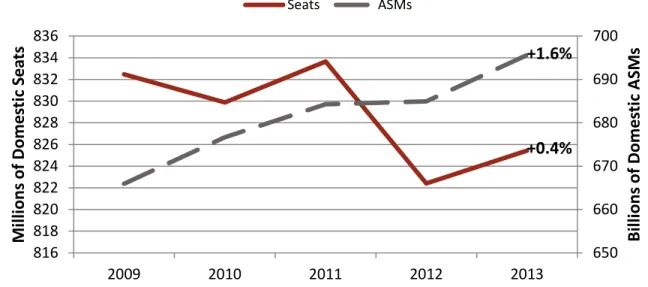
As the data in this report’s appendices show, capacity discipline is still in full force in the United
States. Scheduled domestic flights decreased by 1.1% from 2012-2013, while available seats
(seat-departures) increased by 0.4% over the same period. This reflects a continuing trend of
upgauging and an increase in average stage length as airlines continue to remove 50-seat regional
jets from service. Figure 1 shows how available domestic seats and ASMs increased from
2012-2013, despite a 1.1% decrease in available departures over the same period.
Figure 1: Changes in Domestic Seats and ASMs from 2009-2013 (Source: Diio Mi)
1
Wittman, M.D. and W.S. Swelbar, MIT ICAT; Report No. ICAT-2013-02; May 2013
650
660
670
680
690
700
816
818
820
822
824
826
828
830
832
834
836
2009
2010
2011
2012
2013
Bi
lli
on
s
of
Dome
sti
c
A
SM
s
M
ill
ion
s
of
Dome
sti
c
Se
ats
Seats
ASMs
+1.6%
+0.4%
As was the case from 2007-2012, smaller airports continue to see larger reductions in scheduled
domestic flights than larger airports. Table 1 shows the percent change in domestic flights by
FAA airport hub type from 2012-2013; smaller airports
2saw a 2.9% decrease in available flights
over the last year, as compared to a 0.2% reduction at the 29 large-hub airports. In total, 61.1%
of domestic departures at the U.S. originated at one of the 29 large-hub airports in 2013.
Airport Type
% change in
domestic flights
(2012-2013)
% change in
domestic seats
(2012-2013)
Large Hub
-0.2%
1.0%
Medium Hub
-2.1%
0.3%
Small Hub
-3.0%
-1.4%
Non-Hub and EAS
3-4.2%
-2.5%
All Smaller Airports
All Airports
-2.9%
-1.1%
0.6%
0.4%
Table 1: Percent change in scheduled domestic flights by FAA hub type; 2012-2013 (Source: Diio Mi)
While network carriers continue to practice capacity discipline, reducing their scheduled
domestic departures by 0.8% from 2012 to 2013, some LCCs started to cut capacity at a faster
pace. Southwest Airlines and AirTran Airways reduced their joint scheduled departures by 4.0%
from 2012-2013. Although JetBlue Airways saw a 5.5% increase in departures over the same
period, and Frontier Airlines saw a significant reduction in scheduled service as the airline
transitioned to an ultra-low-cost carrier (ULCC) business model. Established ULCCs saw
significant growth in departures on the order of 10.4% from 2012-2013, but these carriers are
still only a small part of the U.S. domestic market. ULCCs departures represented only 1.4% of
the available domestic capacity in the United States in 2013.
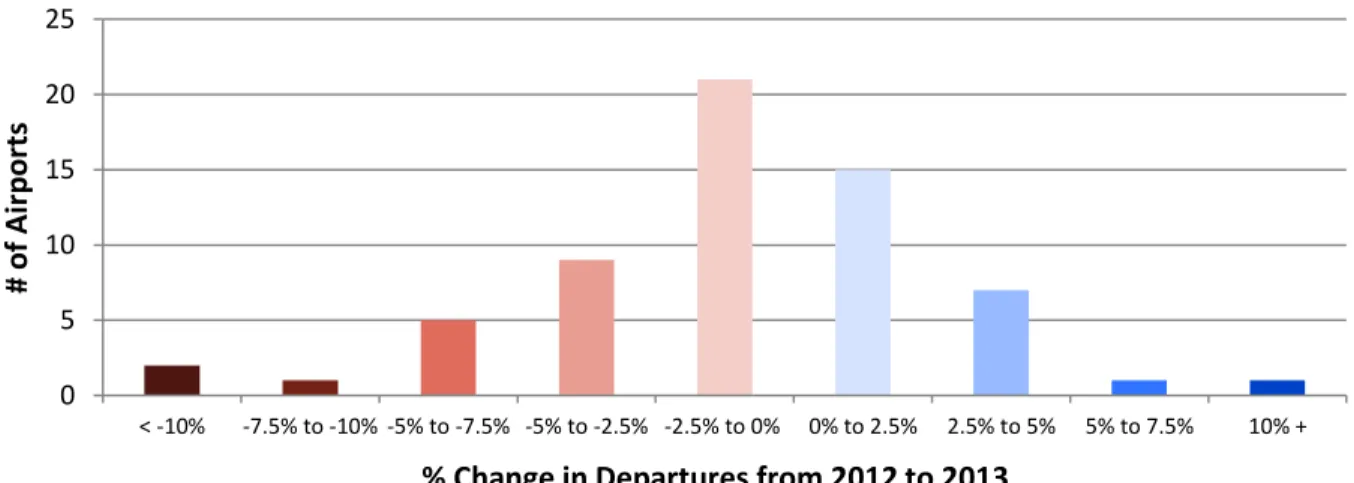
Among large- and medium-hub airports, the majority of airports saw reductions in available
capacity. As Figure 2 shows, 38 airports saw decreases in departures from 2012-2013, whereas
24 airports saw departure growth.
Figure 2: % Change in Available Domestic Departures among Large- and Medium-Hub Airports, 2012-2013
2
We define “smaller airports” as airports classified as FAA medium-hubs or below.
0
5
10
15
20
25
< -10% -7.5% to -10% -5% to -7.5% -5% to -2.5% -2.5% to 0% 0% to 2.5% 2.5% to 5% 5% to 7.5% 10% +#
o
f A
ir
p
o
rts
Among large-hub and medium-hub airports, Table 2 shows the ten airports that saw the largest
increases and decreases in available capacity from 2012 to 2013. Much of the capacity growth
during the last year was in Texas, with DFW, HOU, and AUS all showing departure growth of at
least 4%. New Orleans International Airport (MSY) continued its strong growth and has emerged
as a winner from the capacity discipline period. Meanwhile, several previous AirTran hubs, BWI
and MKE, saw decreases in available departures over the last year. Memphis International
Airport (MEM) saw the largest decrease in departures as Delta Air Lines ceased hub operations
at that airport.
Airport
2012
Flights
2013
Flights
% Change in
Flights
% Change in
Seats
MSY : New Orleans Intl
43,723
48,802
11.6%
11.4%
HOU : William P Hobby
56,103
59,294
5.7%
8.4%
DFW : Dallas/Ft Worth Intl
288,002 301,155
4.6%
2.8%
AUS : Austin-Bergstrom Intl
48,434
50,481
4.2%
4.6%
RSW : Southwest Florida
31,465
32,425
3.1%
3.2%
OMA : Eppley Airfield
27,007
25,429
-5.8%
-0.9%
BWI : Baltimore/Wash Intl
114,371 107,008
-6.4%
-1.0%
ABQ : Albuquerque Intl
34,485
31,283
-9.3%
-6.2%
MKE : General Mitchell Fld
48,171
41,274
-14.3%
-10.7%
MEM : Memphis Intl
58,263
39,822
-31.7%
-28.0%
Table 2: Large- and medium-hub airports with the largest changes in capacity 2012-2013 (Source: Diio Mi)
At smaller airports, network carriers continue to remove mainline aircraft and shift service
predominantly to regional carriers. At smaller airports, 88% of United flights, 84% of US
Airways flights, 71% of Delta flights, and 69% of American flights were operated by regional
aircraft in 2013. However, the 37-50 seat regional jet continues to be removed from small airport
service. As shown in Figure 3, Delta Air Lines reduced its use of small RJs at smaller airports by
12.7% over the last year alone. United and American will likely follow suit in 2014. Some of this
service is being replaced by larger 76-seat regional jet flights, but much of this scheduled service
to smaller communities is being removed entirely.
Figure 3: Scheduled 37-50 Seat RJ Departures at Smaller Airports, 2012-2013 (Source: Diio Mi)
150000
200000
250000
300000
350000
400000
450000
500000
2010
2011
2012
2013
#
of
De
p
ar
tu
re
s
DL+NW
UA+CO
AA
US
What Capacity Trends Should We Be Watching for 2014?
Capacity discipline is certainly here to stay in the United States in the short term. Increases in
unit costs and the current success of the capacity discipline strategy in generating stable
profitability have induced airlines to keep projected capacity growth low over the next year. Any
net capacity growth will likely come at “battleground” airports such as SEA, SLC, LAX, HOU,
and DAL, as airlines continue to bolster domestic feed for enhanced international operations at
large airports. We do not expect to see any network carrier or LCC increase domestic departures
by more than 6% in the coming year. Although ultra-low-cost carriers like Spirit, Frontier, and
Allegiant may see more significant growth, these airlines represent only a small fraction of the
domestic market.
Although U.S. airlines are currently practicing system-wide capacity discipline, competitive
pressures are causing changes in service at many individual airports. As such, there are a series
of regional and airline-specific domestic capacity trends that bear watching for the remainder of
2014:
Fallout from AA/US slot divestitures at LGA and DCA, and impacts on airlines receiving
those slots;
Liberalization and growth at DAL (and loss of existing service in smaller airports in
Texas and nearby states) following the expiration of the Wright Amendment;
Delta-Alaska competitive relationship and capacity growth at SEA and SLC;
Effects of a pilot shortage on regional and ultra-regional carriers in the smallest markets;
Rationalization of the combined AA/US schedule as the combined carrier completes the
merger; and
Competitors picking up the leftovers at former network carrier hubs.
Each of these trends could continue to affect growth in capacity at local markets, and airport
officials will need to pay attention to those trends that could affect their region. However, on the
whole, capacity growth will likely be modest over the next year. Airlines continue to carefully
deploy their available capacity and target only those operations that will be likely to turn a profit.
Small airports will likely continue to need the support of incentive packages to induce new
service or, in some cases, maintain existing service. Removal of 50-seat jets in small markets
will certainly continue and likely spread to all carriers, although maintenance cost incentives will
likely keep these aircraft in operation.
In sum, while some domestic markets will show minor growth, the general attitude among U.S.
carriers is a focus on international expansion with limited new domestic activity. As such, we
expect capacity discipline to remain in effect domestically in the U.S. at least through 2015.
Acknowledgements
The author would like to thank Peter Belobaba, William Swelbar, and the members of the MIT
Airline Industry Consortium for financial support and for helpful comments on earlier drafts of
this work. All opinions are those of the author.
Appendix A: Summary of Scheduled Domestic Capacity for Large Hub Airports
Notes: Tables show enplaned passengers (2012 data), as well as scheduled domestic departures and available seats at each airport for the years 2012 and 2013.
Departures, seats, and airline service data were sourced from Diio Mi. Enplaned passenger data sourced from the Federal Aviation Administration Passenger
Boarding and All-Cargo Data for U.S. Airports. All FAA hub definitions are current as of May, 2014.
Airport Enplaned Pax
(2012) Departures (2012) Departures (2013) % Change Flights 12-13 Seats (2012) Seats (2013) % Change Seats 12-13
ATL : Hartsfield Intl 45,798,928 417,559 409,100 -2.0% 49,736,427 50,113,363 0.8%
BOS : Logan International 14,293,695 143,526 147,460 2.7% 15,579,589 16,173,497 3.8%
BWI : Baltimore/Wash Intl 11,186,444 114,371 107,008 -6.4% 14,305,787 14,159,729 -1.0%
CLT : Charlotte-Douglas Intl 20,033,816 243,814 248,607 2.0% 23,350,859 24,431,983 4.6%
DCA : Washington National 9,462,231 137,761 141,100 2.4% 12,968,444 13,317,414 2.7%
DEN : Denver International 25,799,841 286,387 272,317 -4.9% 30,457,093 29,628,466 -2.7%
DFW : Dallas/Ft Worth Intl 28,022,904 288,002 301,155 4.6% 31,944,332 32,828,036 2.8%
DTW : Wayne County 15,599,879 193,833 193,498 -0.2% 17,348,563 17,762,578 2.4%
EWR : Newark Intl 17,055,993 148,082 150,180 1.4% 14,871,343 15,151,853 1.9%
FLL : Ft Lauderdale Intl 11,445,103 82,226 81,560 -0.8% 11,826,581 11,762,681 -0.5%
HNL : Honolulu Intl 9,225,848 65,684 65,440 -0.4% 8,468,474 8,501,560 0.4%
IAD : Dulles International 10,816,216 111,537 109,615 -1.7% 9,677,101 9,228,296 -4.6%
IAH : Houston Intcntl 19,039,000 193,456 193,959 0.3% 18,319,231 18,172,031 -0.8%
JFK : John F Kennedy Intl 24,520,981 120,595 118,385 -1.8% 14,912,986 14,716,391 -1.3%
LAS : Mccarran Intl 19,959,651 160,027 155,027 -3.1% 22,783,490 23,081,839 1.3%
LAX : Los Angeles Intl 31,326,268 231,014 235,285 1.8% 28,431,938 29,577,693 4.0%
LGA : La Guardia 12,818,717 171,585 170,662 -0.5% 17,070,831 17,181,133 0.6%
MCO : Orlando Intl 17,159,427 126,347 121,519 -3.8% 18,389,089 17,908,377 -2.6%
MDW : Midway 9,436,387 91,681 92,069 0.4% 12,265,085 12,988,494 5.9%
MIA : Miami International 18,987,488 81,031 82,835 2.2% 11,302,646 11,170,672 -1.2%
MSP : Minneapolis-St Paul 15,943,878 182,125 187,225 2.8% 18,345,264 19,149,749 4.4%
ORD : O'Hare International 32,171,795 383,248 388,172 1.3% 34,008,845 34,008,431 0.0%
PHL : Philadelphia Intl 14,589,337 187,445 184,048 -1.8% 16,743,889 16,460,707 -1.7%
PHX : Sky Harbor Intl 19,560,870 185,855 179,985 -3.2% 23,541,485 23,324,929 -0.9%
SAN : Lindbergh Field 8,686,621 79,272 80,491 1.5% 10,496,716 10,807,845 3.0%
SEA : Seattle/Tacoma Intl 16,121,123 133,169 135,660 1.9% 17,278,072 17,840,708 3.3%
SFO : San Francisco Intl 21,284,236 172,568 171,610 -0.6% 20,644,958 20,956,226 1.5%
SLC : Salt Lake City Intl 9,579,840 115,579 114,818 -0.7% 11,462,596 11,630,767 1.5%
TPA : Tampa International 8,218,487 74,351 74,361 0.0% 10,055,318 10,008,800 -0.5%
Appendix B: Summary of Scheduled Domestic Capacity for Medium Hub Airports
Airport Enplaned Pax
(2012) Departures (2012) Departures (2013) % Change Flights 12-13 Seats (2012) Seats (2013) % Change Seats 12-13
ABQ : Albuquerque Intl 2,630,574 34,485 31,283 -9.3% 3,758,909 3,526,675 -6.2%
ANC : Anchorage Intl 2,249,717 42,019 41,889 -0.3% 3,017,946 3,140,362 4.1%
AUS : Austin-Bergstrom Intl 4,606,252 48,434 50,481 4.2% 5,850,877 6,121,075 4.6%
BDL : Bradley Intl 2,647,610 32,146 31,712 -1.4% 3,265,741 3,335,193 2.1%
BNA : Nashville Metro 4,797,102 64,468 66,219 2.7% 6,483,858 6,899,167 6.4%
BUF : Buffalo Niagara Intl 2,592,630 34,990 34,725 -0.8% 3,245,218 3,248,127 0.1%
BUR : Hollywood-Burbank 2,027,203 25,963 24,574 -5.3% 3,065,944 2,909,377 -5.1%
CLE : Hopkins Intl 4,346,941 79,574 79,642 0.1% 5,657,777 5,622,045 -0.6%
CMH : Port Columbus Intl 3,095,575 47,405 46,748 -1.4% 4,022,695 4,070,720 1.2%
CVG : Cincinnati 2,937,850 53,970 51,660 -4.3% 3,827,317 3,627,748 -5.2%
DAL : Love Field 3,902,628 47,294 47,525 0.5% 5,977,576 6,025,880 0.8%
HOU : William P Hobby 5,043,737 56,103 59,294 5.7% 7,230,445 7,838,265 8.4%
IND : Indianapolis Intl 3,586,422 49,641 49,003 -1.3% 4,491,335 4,462,347 -0.6%
JAX : Jacksonville Intl 2,579,023 30,863 30,943 0.3% 3,349,524 3,273,527 -2.3%
MCI : Kansas City Intl 4,866,850 61,421 59,864 -2.5% 6,455,148 6,561,885 1.7%
MEM : Memphis Intl 3,359,668 58,263 39,822 -31.7% 4,318,545 3,110,160 -28.0%
MKE : General Mitchell Fld 3,710,384 48,171 41,274 -14.3% 4,758,447 4,248,762 -10.7%
MSY : New Orleans Intl 4,293,624 43,723 48,802 11.6% 5,438,543 6,059,157 11.4%
OAK : Metro Oakland Intl 4,926,683 49,283 47,139 -4.4% 6,604,446 6,558,837 -0.7%
OGG : Kahului 2,861,278 36,590 34,888 -4.7% 3,446,227 3,437,537 -0.3%
OMA : Eppley Airfield 2,018,738 27,007 25,429 -5.8% 2,498,381 2,475,402 -0.9%
ONT : Ontario Intl 2,142,393 22,290 21,150 -5.1% 2,801,324 2,605,810 -7.0%
PBI : Palm Beach Intl 2,796,359 24,174 24,095 -0.3% 3,400,592 3,261,007 -4.1%
PDX : Portland Intl 7,142,620 77,887 78,991 1.4% 8,452,893 8,781,682 3.9%
PIT : Pittsburgh Intl 3,892,338 51,627 52,073 0.9% 4,824,219 5,015,505 4.0%
RDU : Raleigh-Durham 4,490,374 61,658 60,533 -1.8% 5,708,550 5,748,573 0.7%
RSW : Southwest Florida 3,634,152 31,465 32,425 3.1% 4,192,434 4,327,347 3.2%
SAT : San Antonio Intl 4,036,625 41,740 42,057 0.8% 4,928,902 4,962,489 0.7%
SJC : San Jose Municipal 4,077,654 42,471 43,735 3.0% 5,421,168 5,674,292 4.7%
SJU : Luis Munoz Marin Intl 4,204,478 42,870 41,233 -3.8% 4,367,379 4,288,947 -1.8%
SMF : Sacramento International 4,357,899 46,131 44,533 -3.5% 5,575,029 5,488,642 -1.5%
SNA : John Wayne Airport 4,381,172 40,384 39,929 -1.1% 5,429,952 5,491,538 1.1%
STL : Lambert International 6,208,750 83,605 82,668 -1.1% 8,365,199 8,482,306 1.4%
Appendix C: Summary of Scheduled Domestic Capacity for Small Hub Airports
Airport Enplaned Pax
(2012) Departures (2012) Departures (2013) % Change Flights 12-13 Seats (2012) Seats (2013) % Change Seats 12-13
ACY : Atlantic City Intl 663,142 4,406 3,501 -20.5% 739,896 568,309 -23.2%
ALB : Albany County 1,222,354 21,522 20,631 -4.1% 1,574,799 1,555,636 -1.2%
AMA : Amarillo Intl 389,284 7,370 7,449 1.1% 617,191 620,868 0.6%
AZA : Williams Gateway Airport 744,685 4,883 4,651 -4.8% 748,112 767,168 2.5%
BHM : Birmingham Municipal 1,412,483 22,248 19,791 -11.0% 2,122,541 1,887,918 -11.1%
BIL : Logan Intl 440,277 9,146 7,672 -16.1% 556,727 473,309 -15.0%
BLI : Bellingham Muni 577,028 4,976 5,129 3.1% 592,569 686,713 15.9%
BOI : Boise Air Term/Gowen 1,307,505 17,476 17,694 1.2% 1,656,923 1,676,564 1.2%
BTR : Ryan (Baton Rouge, LA) 406,318 9,817 9,883 0.7% 494,935 510,641 3.2%
BTV : Burlington Intl 615,026 11,625 11,361 -2.3% 784,852 762,458 -2.9%
BZN : Gallatin Field 434,038 6,509 6,281 -3.5% 514,393 505,426 -1.7%
CAE : Columbia Metropolitan 487,435 11,977 11,940 -0.3% 684,202 672,478 -1.7%
CAK : Akron/Canton Regional 910,712 12,426 12,382 -0.4% 1,135,876 1,110,213 -2.3%
CHS : Charleston Afb Muni 1,283,970 20,802 22,096 6.2% 1,675,211 1,831,690 9.3%
CID : The Eastern Iowa Airport 491,806 11,601 11,506 -0.8% 649,457 658,692 1.4%
COS : Peterson Field 836,998 13,657 11,106 -18.7% 1,098,868 860,755 -21.7%
DAY : Dayton International 1,289,758 22,054 21,416 -2.9% 1,649,363 1,590,297 -3.6%
DSM : Des Moines Airport 1,018,188 17,436 17,464 0.2% 1,255,307 1,321,737 5.3%
ECP : Northwest Florida Beaches 422,750 5,784 4,847 -16.2% 641,417 550,661 -14.1%
ELP : El Paso Intl 1,442,102 20,667 20,011 -3.2% 2,259,125 2,129,900 -5.7%
EUG : Eugene, Oregon-Airport 407,124 7,995 8,021 0.3% 495,382 529,960 7.0%
EYW : Key West Intl 370,637 9,273 8,790 -5.2% 486,341 512,371 5.4%
FAI : Fairbanks Intl 450,436 14,792 14,593 -1.3% 759,657 758,165 -0.2%
FAR : Hector Field 369,969 6,911 7,542 9.1% 475,729 510,048 7.2%
FAT : Fresno Yosemite 640,350 12,780 12,845 0.5% 730,189 762,349 4.4%
FNT : Bishop (Flint, MI) 412,326 6,830 6,688 -2.1% 531,225 539,546 1.6%
FSD : Foss Field (Sioux Falls, SD) 453,007 7,963 8,347 4.8% 542,870 580,803 7.0%
GEG : Spokane International 1,456,279 17,713 16,555 -6.5% 1,869,280 1,760,313 -5.8%
GPT : Gulfport Biloxi International 394,110 6,287 6,107 -2.9% 412,286 425,395 3.2%
GRR : Gerald R. Ford International 1,063,153 18,032 18,526 2.7% 1,339,647 1,410,358 5.3%
GSO : Piedmont Triad Intl 889,135 18,645 16,428 -11.9% 1,203,367 1,180,176 -1.9%
GSP : Greenville/Spartanbg 936,288 17,858 17,015 -4.7% 1,276,004 1,243,578 -2.5%
GUM : Agana Field 1,477,926 3,090 2,621 -15.2% 213,888 214,037 0.1%
HPN : Westchester County 893,184 17,848 15,883 -11.0% 1,149,228 965,906 -16.0%
HRL : Valley International 375,472 4,386 4,348 -0.9% 461,640 442,714 -4.1%
HSV : Madison County 578,993 11,811 10,515 -11.0% 842,999 747,879 -11.3%
ICT : Mid-Continent 735,270 12,107 12,194 0.7% 961,353 999,639 4.0%
Airport Enplaned Pax (2012) Departures (2012) Departures (2013) % Change Flights 12-13 Seats (2012) Seats (2013) % Change Seats 12-13
ISP : Long Island Macarthur 667,603 7,930 7,473 -5.8% 905,490 810,623 -10.5%
ITO : Hilo International 641,904 7,270 7,162 -1.5% 841,012 813,460 -3.3%
JAN : Allen C Thompson Fld 611,592 11,717 11,171 -4.7% 855,207 821,964 -3.9%
KOA : Keahole 1,367,091 19,086 19,425 1.8% 1,719,327 1,669,935 -2.9%
LBB : Lubbock Intl 475,767 7,935 7,133 -10.1% 665,976 622,181 -6.6%
LEX : Blue Grass 535,541 11,692 11,799 0.9% 690,657 709,591 2.7%
LGB : Long Beach Municipal 1,554,846 14,397 13,476 -6.4% 1,852,260 1,706,857 -7.9%
LIH : Lihue 1,308,549 14,576 13,342 -8.5% 1,649,540 1,601,494 -2.9%
LIT : Adams Field 1,111,442 18,210 16,462 -9.6% 1,573,724 1,485,546 -5.6%
MAF : Midland-Odessa Regl 497,193 8,162 9,415 15.4% 688,980 728,444 5.7%
MDT : Olmsted State 657,074 15,367 14,052 -8.6% 845,000 816,237 -3.4%
MHT : Manchester Boston 1,210,189 16,320 15,425 -5.5% 1,464,474 1,447,159 -1.2%
MLI : Quad-City 396,460 9,158 8,495 -7.2% 527,045 508,985 -3.4%
MSN : Truax Field 799,053 14,110 15,274 8.2% 947,324 1,065,644 12.5%
MYR : Myrtle Beach Afb 722,775 9,236 10,256 11.0% 948,383 1,066,521 12.5%
OKC : Will Rogers World 1,801,650 25,921 25,975 0.2% 2,463,642 2,488,530 1.0%
ORF : Norfolk Intl 1,651,440 27,479 26,909 -2.1% 2,264,945 2,269,295 0.2%
PIE : St. Petersburg International 436,030 3,061 3,366 10.0% 460,526 548,185 19.0%
PNS : Pensacola Regional 740,852 12,995 12,124 -6.7% 936,076 945,953 1.1%
PSP : Palm Springs Muni 867,720 12,488 12,181 -2.5% 924,573 909,971 -1.6%
PVD : T Francis Green St 1,809,322 22,832 22,079 -3.3% 2,206,740 2,278,441 3.2%
PWM : Portland Intl Jetprt 799,136 13,559 13,313 -1.8% 1,003,354 1,054,877 5.1%
RIC : Richard E Byrd Field 1,582,565 27,129 26,616 -1.9% 2,042,239 2,086,865 2.2%
RNO : Reno/Tahoe Intl 1,685,333 20,532 19,230 -6.3% 2,353,960 2,191,405 -6.9%
ROC : Monroe County 1,202,903 21,829 20,573 -5.8% 1,576,028 1,509,774 -4.2%
SAV : Savannah Intl 789,663 13,344 13,257 -0.7% 1,041,695 1,048,271 0.6%
SBA : Santa Barbara Muni 370,600 11,177 10,681 -4.4% 475,422 469,233 -1.3%
SDF : Standiford Field 1,642,790 27,132 28,225 4.0% 2,185,688 2,350,091 7.5%
SFB : Central Florida Region 873,069 4,866 5,271 8.3% 744,094 875,109 17.6%
SPN : Saipan International 411,735 N/A N/A N/A N/A N/A N/A
SRQ : Sarasota-Bradenton 637,264 5,973 5,615 -6.0% 748,575 694,907 -7.2%
STT : Cyril E. King Airport 649,691 13,405 13,553 1.1% 783,903 769,210 -1.9%
SYR : Clarence E Hancock 974,293 19,469 18,692 -4.0% 1,267,327 1,222,402 -3.5%
TUL : Tulsa International 1,324,202 20,909 20,380 -2.5% 1,967,505 1,961,869 -0.3%
TUS : Tucson International 1,710,649 21,007 19,493 -7.2% 2,184,186 1,998,127 -8.5%
TYS : Mc Ghee Tyson 846,278 18,273 17,855 -2.3% 1,066,544 1,069,581 0.3%
VPS : Ft. Walton Beach Airport 373,542 8,074 7,790 -3.5% 478,988 476,043 -0.6%
XNA : NW Arkansas Regional 546,845 14,412 14,106 -2.1% 812,264 800,112 -1.5%
Appendix D: Summary of Scheduled Domestic Capacity for Non-Hub and EAS Airports
Airport Enplaned Pax
(2012) Departures (2012) Departures (2013) % Change Flights 12-13 Seats (2012) Seats (2013) % Change Seats 12-13 ABE : Allentown/Bethlehem/Ea 350,066 8,150 6,650 -18.4% 471,032 396,132 -15.9%
ABI : Abilene Regional Airport 74,523 2,439 2,754 12.9% 106,087 125,728 18.5%
ABR : Aberdeen Municipal 24,822 718 745 3.8% 35,900 37,250 3.8%
ABY : Dougherty County 33,494 999 1,036 3.7% 49,950 51,800 3.7%
ACK : Nantucket Memorial 179,128 17,482 18,947 8.4% 213,817 234,463 9.7%
ACT : Waco Municipal 59,836 2,221 1,704 -23.3% 102,475 83,370 -18.6%
ACV : Arcata 61,705 3,691 3,306 -10.4% 107,314 98,680 -8.0%
ADQ : Kodiak Airport 78,749 6,310 6,378 1.1% 165,658 164,734 -0.6%
AEX : Alexandria Intl Airport 189,476 4,192 3,993 -4.7% 190,038 192,084 1.1%
AGS : Bush Field 271,740 5,762 5,852 1.6% 322,009 337,858 4.9%
AHN : Athens Municipal N/A 704 626 -11.1% 5,838 6,260 7.2%
AIA : Alliance Municipal N/A 875 677 -22.6% 16,625 12,863 -22.6%
AKN : King Salmon 35,803 6,061 2,893 -52.3% 89,015 66,252 -25.6%
ALO : Waterloo Municipal 19,522 669 676 1.0% 30,396 29,744 -2.1%
ALS : Alamosa Municipal 6,959 1,062 1,054 -0.8% 20,178 20,026 -0.8%
ALW : Walla Walla 31,832 655 675 3.1% 49,780 51,300 3.1%
ANI : Aniak 15,220 2,925 2,826 -3.4% 43,188 39,388 -8.8%
AOO : Blair County 3,256 948 937 -1.2% 32,232 31,858 -1.2%
APN : Alpena County Regl 13,011 691 630 -8.8% 34,550 31,500 -8.8%
ART : Watertown Municipal 16,988 626 631 0.8% 27,544 27,764 0.8%
ASE : Aspen 214,892 5,195 4,661 -10.3% 345,526 306,894 -11.2%
ATW : Outagamie County 229,248 5,415 5,372 -0.8% 311,178 315,593 1.4%
ATY : Watertown Municipal 6,254 1,059 1,430 35.0% 25,633 27,170 6.0%
AUG : Augusta State 4,791 1,011 1,239 22.6% 9,099 11,151 22.6%
AVL : Asheville Municipal 318,395 7,842 7,639 -2.6% 421,357 462,455 9.8%
AVP : Wilkes-Barre/Scrantn I 222,060 6,586 5,849 -11.2% 317,582 291,053 -8.4%
AZO : Battle Creek Intl 127,517 3,960 3,996 0.9% 196,623 193,182 -1.8%
BED : Hanscom Field 11,097 168 - -100.0% 5,040 - -100.0%
BET : Bethel 148,168 23,409 23,707 1.3% 330,579 341,291 3.2%
BFD : Bradford Regional N/A 941 938 -0.3% 17,879 17,822 -0.3%
BFF : Scottsbluff County 10,356 1,399 1,661 18.7% 26,581 31,559 18.7%
BFI : Boeing Field Intl 23,078 2,667 2,564 -3.9% 26,579 23,856 -10.2%
BFL : Meadows Field 152,456 3,771 3,744 -0.7% 179,018 177,818 -0.7%
BGM : Link Field/Broome Co 105,494 3,680 3,338 -9.3% 150,067 135,258 -9.9%
BGR : Bangor International 302,610 4,431 4,608 4.0% 292,197 314,936 7.8%
BHB : Bar Harbour 10,006 1,163 1,255 7.9% 23,167 19,695 -15.0%
BID : Block Island 10,841 3,108 2,958 -4.8% 27,972 26,622 -4.8%
Airport Enplaned Pax (2012) Departures (2012) Departures (2013) % Change Flights 12-13 Seats (2012) Seats (2013) % Change Seats 12-13
BJI : Bemidji Municipal 22,374 702 753 7.3% 35,100 37,650 7.3%
BKW : Raleigh County Meml 2,534 639 625 -2.2% 21,726 21,250 -2.2%
BLD : Boulder City 200,400 472 N/A N/A 4,275 N/A N/A
BMI : Bloomington/Normal 240,181 4,574 4,016 -12.2% 299,892 275,449 -8.2% BPT : Jefferson County 5,571 680 1,155 69.9% 23,120 55,536 140.2% BQK : Glynco Jetport 31,284 955 1,018 6.6% 47,750 50,930 6.7% BQN : Borinquen 215,448 1,681 1,508 -10.3% 259,335 228,908 -11.7% BRD : Crow Wing 15,630 658 914 38.9% 32,900 45,700 38.9% BRL : Burlington Muni 7,887 1,383 1,303 -5.8% 13,112 12,314 -6.1%
BRO : South Padre Isl Intl 86,090 2,328 2,500 7.4% 116,400 123,674 6.2%
BRW : Barrow Wbas 43,673 3,269 3,187 -2.5% 105,435 117,504 11.4%
BTM : Silver Bow County 20,895 703 750 6.7% 35,150 37,500 6.7%
CDC : Cedar City Municipal 15,881 646 624 -3.4% 27,060 31,200 15.3%
CDR : Chadron Municipal N/A 839 1,002 19.4% 15,941 19,038 19.4%
CDV : Mile 13 Field 16,061 1,124 1,093 -2.8% 86,044 85,313 -0.8%
CEC : Jack Mc Namara Field 12,547 1,008 989 -1.9% 30,240 29,670 -1.9%
CEZ : Cortez Municipal Aiport 7,548 1,161 987 -15.0% 22,059 18,753 -15.0%
CGI : Cape Girardeau Muni 6,232 1,253 1,252 -0.1% 11,277 11,268 -0.1%
CHA : Lovell Field 313,861 7,760 7,249 -6.6% 414,819 406,529 -2.0%
CHO : Albemarle 230,097 7,291 7,103 -2.6% 315,382 316,846 0.5%
CIC : Chico Muni 19,269 1,287 1,091 -15.2% 38,610 32,730 -15.2%
CIU : Chippewa County 19,824 654 673 2.9% 32,700 33,650 2.9%
CKB : Benedum 10,153 962 952 -1.0% 34,556 34,216 -1.0%
CLD : McClellan-Palomar 48,474 2,370 N/A N/A 71,100 N/A N/A
CLL : Easterwood Field 70,551 2,819 2,733 -3.1% 124,409 124,896 0.4%
CLM : William R Fairchild 5,853 1,088 1,086 -0.2% 10,929 10,188 -6.8%
CMI : Willard University 86,408 2,278 2,329 2.2% 110,060 112,520 2.2%
CMX : Houghton County Meml 25,545 733 797 8.7% 36,650 40,002 9.1%
CNM : Cavern City Air Term 2,776 1,014 655 -35.4% 8,112 6,352 -21.7%
CNY : Canyonlands Field 7,955 994 1,037 4.3% 18,886 19,703 4.3%
COD : Yellowstone Regional 28,551 919 835 -9.1% 42,670 41,750 -2.2%
COU : Columbia Regional 41,573 924 1,039 12.4% 46,200 54,110 17.1%
CPR : Casper 88,013 2,304 2,477 7.5% 117,028 136,798 16.9%
CRP : Corpus Christi Intl 313,969 7,246 6,992 -3.5% 494,183 497,218 0.6%
CRW : Yeager 272,901 8,049 7,364 -8.5% 383,663 363,977 -5.1%
CSG : Columbus Airport 74,336 2,115 1,655 -21.7% 97,686 79,701 -18.4%
CVN : Clovis Municipal N/A 637 656 3.0% 12,103 12,464 3.0%
CWA : Central Wisconsin 120,449 3,487 3,340 -4.2% 173,138 165,350 -4.5%
CYS : Cheyenne Municipal 15,010 1,972 2,157 9.4% 39,815 40,983 2.9%
Airport Enplaned Pax (2012) Departures (2012) Departures (2013) % Change Flights 12-13 Seats (2012) Seats (2013) % Change Seats 12-13
DDC : Dodge City Municipal 6,155 1,462 1,437 -1.7% 27,778 27,303 -1.7%
DEC : Decatur 7,753 1,882 1,878 -0.2% 17,800 17,748 -0.3% DHN : Dothan 46,452 1,354 1,375 1.6% 67,700 68,750 1.6% DIK : Dickinson 23,729 1,571 2,168 38.0% 47,130 81,240 72.4% DLG : Dillingham Muni 39,877 2,573 1,716 -33.3% 58,270 44,741 -23.2% DLH : Duluth International 158,569 3,592 3,601 0.3% 207,322 204,152 -1.5% DRO : La Plata 186,567 4,036 3,635 -9.9% 247,675 239,384 -3.3%
DRT : Del Rio Intl 11,632 700 175 -75.0% 29,752 8,750 -70.6%
DUJ : Jefferson County 5,074 1,305 1,272 -2.5% 24,795 24,168 -2.5%
DUT : Emergency Field 30,735 995 867 -12.9% 10,695 9,333 -12.7%
DVL : Devils Lake Muni 2,976 958 1,058 10.4% 18,202 20,102 10.4%
EAR : Kearney Muni 12,480 1,316 1,090 -17.2% 29,184 31,248 7.1%
EAT : Pangborn Field 51,347 1,631 1,034 -36.6% 84,614 78,584 -7.1%
EAU : Eau Claire Municipal 22,907 729 729 0.0% 36,450 36,450 0.0%
EGE : Eagle County Regl 167,914 2,150 1,947 -9.4% 287,968 253,733 -11.9%
EKO : Elko Municipal 33,310 1,000 1,075 7.5% 30,000 32,250 7.5%
ELD : Goodwin Field 3,059 1,255 1,252 -0.2% 11,314 11,636 2.8%
ELM : Celmira/Corning Regl 145,243 3,848 3,251 -15.5% 213,439 191,972 -10.1%
ELY : Yelland N/A 327 77 -76.5% 6,213 1,463 -76.5%
ENA : Kenai Municipal 99,955 9,220 9,522 3.3% 174,104 172,146 -1.1%
ERI : Erie Intl 109,185 3,510 3,507 -0.1% 149,253 145,606 -2.4%
ESC : Delta County 13,480 1,232 628 -49.0% 61,600 31,400 -49.0%
EVV : Dress Regional 164,767 4,710 4,734 0.5% 231,568 232,104 0.2%
EWB : New Bedford Muni 12,256 2,618 2,541 -2.9% 23,562 22,869 -2.9%
EWN : Simmons Nott 125,873 3,547 3,470 -2.2% 174,396 170,050 -2.5%
FAY : Fayetteville Muni 255,406 6,161 6,679 8.4% 334,649 355,304 6.2%
FBS : Friday Harbor SPB N/A 1,156 848 -26.6% 6,936 7,918 14.2%
FCA : Glacier Natl Park 192,439 3,301 N/A N/A 233,215 N/A N/A
FKL : Chess-Lambertin N/A 1,254 1,240 -1.1% 23,826 23,560 -1.1%
FLG : Pulliam Field 62,472 2,260 1,849 -18.2% 98,531 92,528 -6.1%
FLO : Florence Municipal 67,745 2,071 1,991 -3.9% 93,254 87,083 -6.6%
FMN : Farmington Municipal 16,337 2,305 1,599 -30.6% 43,795 30,381 -30.6%
FNL : Ft Collins/Loveland Mu 34,817 227 - -100.0% 34,050 - -100.0%
FOD : Fort Dodge Municipal 5,625 1,007 1,076 6.9% 24,527 20,444 -16.6%
FOE : Forbes Afb N/A - - N/A - - N/A
FRD : Friday Harbor 11,555 1,040 N/A N/A 10,400 N/A N/A
FSM : Fort Smith Municipal 84,751 2,431 2,421 -0.4% 119,873 120,630 0.6%
FWA : Ft Wayne Muni/Baer 280,732 6,573 6,348 -3.4% 359,244 359,327 0.0%
GAL : Galena 14,563 2,975 2,633 -11.5% 35,408 30,890 -12.8%
GBD : Great Bend Municipal N/A 641 625 -2.5% 12,179 11,875 -2.5%
Airport Enplaned Pax (2012) Departures (2012) Departures (2013) % Change Flights 12-13 Seats (2012) Seats (2013) % Change Seats 12-13
GCK : Garden City Muni 18,375 1,122 728 -35.1% 34,918 32,794 -6.1%
GCN : Grand Canyon Natl Park 336,716 155 155 0.0% 1,865 1,635 -12.3%
GCW : Grand Canyon West 147,794 472 N/A N/A 4,275 N/A N/A
GDV : Dawson Community N/A 627 632 0.8% 11,913 11,568 -2.9%
GFK : Grand Forks Intl 137,953 2,552 3,005 17.8% 169,202 194,348 14.9%
GGG : Gregg County 18,787 680 716 5.3% 33,154 33,694 1.6%
GGW : Glasgow Intl N/A 581 633 9.0% 11,039 11,587 5.0%
GJT : Walker Field 217,369 5,275 5,103 -3.3% 280,503 289,631 3.3%
GLH : Greenville Municipal 5,181 837 938 12.1% 37,821 31,481 -16.8%
GNV : J R Alison Municipal 190,461 5,311 5,746 8.2% 247,137 269,567 9.1%
GRB : Austin-Straubel Fld 282,973 7,132 6,778 -5.0% 401,970 378,548 -5.8%
GRI : Grand Island Air Pk 56,138 897 906 1.0% 63,312 67,342 6.4%
GRK : Gray Aaf 183,501 5,545 4,949 -10.7% 279,993 256,403 -8.4%
GST : Gustavus 9,509 1,828 3,682 101.4% 26,126 42,162 61.4%
GTF : Great Falls Intl 186,790 3,788 3,744 -1.2% 269,829 268,481 -0.5%
GTR : Golden Triangle Regl 38,856 1,007 1,016 0.9% 50,350 50,800 0.9%
GUC : Gunnison County 31,181 601 614 2.2% 47,841 47,864 0.0%
HDN : Yampa Valley 99,969 1,789 1,442 -19.4% 163,775 136,700 -16.5%
HGR : Washington County 10,207 1,374 1,329 -3.3% 20,650 24,531 18.8%
HHH : Hilton Head 60,372 2,665 N/A N/A 98,618 N/A N/A
HIB : Chisholm 11,921 1,041 638 -38.7% 52,050 31,900 -38.7%
HLN : Helena 95,374 2,713 2,428 -10.5% 159,587 149,542 -6.3%
HNH : Hoonah 9,564 1,956 3,817 95.1% 17,292 34,502 99.5%
HOM : Homer Municipal 39,167 3,265 2,132 -34.7% 59,696 47,076 -21.1%
HON : W W Howes Municipal N/A 1,111 1,405 26.5% 21,109 26,695 26.5%
HOT : Memorial Field N/A 1,152 939 -18.5% 10,368 8,727 -15.8%
HRO : Boone County 5,347 1,466 1,237 -15.6% 13,194 11,241 -14.8%
HTS : Tri-State/Milton 105,548 2,072 1,763 -14.9% 139,531 124,981 -10.4%
HVN : Tweed-New Haven 36,975 1,376 1,396 1.5% 52,485 51,652 -1.6%
HVR : Havre City-County N/A 627 632 0.8% 11,913 11,568 -2.9%
HYA : Barnstable Municipal 95,717 11,654 12,533 7.5% 108,911 117,808 8.2%
HYS : Hays Municipal 10,381 1,986 1,977 -0.5% 37,734 37,563 -0.5%
IAG : Niagara Falls Intl 88,571 586 667 13.8% 90,184 114,165 26.6%
IDA : Fanning Field 160,456 3,456 3,150 -8.9% 215,890 195,763 -9.3%
IFP : Laughlin Bullhead Intl 110,799 1 15 1400.0% 162 2,397 1379.6%
IGM : Kingman Municipal N/A 732 940 28.4% 13,908 17,860 28.4%
IMT : Ford 8,755 693 680 -1.9% 34,650 34,000 -1.9%
INL : Falls International 15,240 644 658 2.2% 32,200 32,900 2.2%
IPL : Imperial County 5,491 727 1,196 64.5% 21,810 16,580 -24.0%
Airport Enplaned Pax (2012) Departures (2012) Departures (2013) % Change Flights 12-13 Seats (2012) Seats (2013) % Change Seats 12-13
ISN : Sloulin Field Intl 40,667 2,031 2,882 41.9% 66,110 130,020 96.7%
ITH : Tompkins County 119,608 3,815 3,573 -6.3% 163,944 152,507 -7.0%
IWD : Gogebic County 2,532 691 677 -2.0% 15,487 12,863 -16.9%
JAC : Jackson Hole 274,343 3,243 3,335 2.8% 359,212 364,362 1.4%
JBR : Jonesboro Municipal 4,730 942 940 -0.2% 8,799 8,884 1.0%
JHW : Jamestown Municipal 3,173 1,393 1,389 -0.3% 26,467 26,391 -0.3%
JLN : Joplin Municipal 24,489 730 728 -0.3% 35,060 35,174 0.3%
JMS : Jamestown Municipal 3,544 1,153 1,328 15.2% 29,220 25,232 -13.6%
JNU : Juneau Intl 353,048 11,073 18,080 63.3% 611,864 676,359 10.5%
JST : Johnstown/Cambria 6,986 1,040 1,267 21.8% 35,360 43,078 21.8%
KSM : Saint Marys 12,711 1,694 1,703 0.5% 26,183 25,859 -1.2%
KTN : Ketchikan Intl 103,136 11,208 11,263 0.5% 467,842 398,185 -14.9%
LAN : Capital City 200,836 4,479 4,721 5.4% 295,291 304,012 3.0%
LAR : General Brees Field 8,131 1,467 729 -50.3% 29,127 21,870 -24.9%
LAW : Lawton Municipal 55,678 1,875 1,783 -4.9% 85,721 83,991 -2.0%
LBE : Westmoreland County 79,531 587 884 50.6% 92,672 142,304 53.6%
LBF : Lee Bird Field 11,210 1,034 1,247 20.6% 19,646 23,693 20.6%
LBL : Liberal Municipal 10,487 1,123 1,250 11.3% 21,337 23,750 11.3%
LCH : Lake Charles Muni 56,815 2,370 2,081 -12.2% 100,826 93,532 -7.2%
LEB : Lebanon Regional 10,191 2,290 2,308 0.8% 20,610 20,772 0.8%
LFT : Lafayette Regional 226,504 6,164 6,372 3.4% 307,792 302,073 -1.9%
LMT : Klamath Falls Airport 15,237 823 730 -11.3% 24,690 21,900 -11.3%
LNK : Lincoln Municipal 135,085 3,295 3,253 -1.3% 164,750 162,650 -1.3%
LNS : Lancaster 5,779 1,650 1,568 -5.0% 14,979 14,675 -2.0%
LNY : Lanai City 45,692 2,937 2,931 -0.2% 78,697 127,180 61.6%
LRD : Laredo Intl 102,247 2,600 2,562 -1.5% 144,176 137,991 -4.3%
LSE : La Crosse Municipal 97,321 2,964 2,693 -9.1% 139,176 125,532 -9.8%
LUP : Kalaupapa 3,186 1,098 102 -90.7% 8,784 816 -90.7%
LWB : Greenbrier Valley 10,849 710 701 -1.3% 28,772 23,678 -17.7%
LWS : Nez Perce County 62,197 1,672 1,661 -0.7% 109,782 108,946 -0.8%
LWT : Lewistown Municipal N/A 1,255 671 -46.5% 23,845 12,749 -46.5%
LYH : Preston-Glenn Field 79,889 2,081 2,063 -0.9% 102,646 103,220 0.6%
MAZ : El Mani 5,856 1,462 1,460 -0.1% 13,158 13,140 -0.1%
MBL : Blacker 2,822 362 218 -39.8% 12,095 4,648 -61.6%
MBS : Tri City 134,801 3,572 3,324 -6.9% 187,496 166,216 -11.3%
MCE : Merced Municipal 3,724 1,331 710 -46.7% 25,289 13,490 -46.7%
MCK : Mccook Municipal N/A 1,036 987 -4.7% 19,684 18,753 -4.7%
MCN : Lewis B. Wilson Airport N/A 1,359 805 -40.8% 10,872 18,930 74.1%
MCW : Mason City Municipal 6,029 1,311 1,426 8.8% 30,303 27,094 -10.6%
MEI : Key Field 14,432 697 651 -6.6% 31,943 21,837 -31.6%
Airport Enplaned Pax (2012) Departures (2012) Departures (2013) % Change Flights 12-13 Seats (2012) Seats (2013) % Change Seats 12-13 MFR : Jackson County 313,638 6,355 6,156 -3.1% 380,676 372,750 -2.1% MGM : Dannelly Field 182,313 5,179 4,843 -6.5% 260,360 242,672 -6.8% MGW : Morgantown Municipal 10,239 1,081 1,251 15.7% 36,754 42,534 15.7% MHK : Manhattan Municipal 69,038 1,763 1,793 1.7% 85,588 88,004 2.8% MKG : Muskegon County 17,816 729 729 0.0% 36,450 36,450 0.0% MKK : Molokai 72,421 8,621 7,554 -12.4% 141,036 130,250 -7.6%
MKL : Mckellar Field N/A 1,201 1,183 -1.5% 11,216 11,830 5.5%
MLB : Cape Kennedy 215,300 2,449 2,442 -0.3% 257,075 260,328 1.3%
MLS : Miles City Municipal N/A 1,132 476 -58.0% 21,508 9,044 -58.0%
MLU : Monroe Municipal 101,034 3,358 3,353 -0.1% 162,845 161,451 -0.9%
MMH : Mammoth Yosemite 27,495 686 825 20.3% 50,396 59,150 17.4%
MOB : Mobile Municipal 277,432 6,780 7,062 4.2% 388,978 391,344 0.6%
MOD : Modesto Municipal 14,741 1,299 1,093 -15.9% 38,970 32,790 -15.9%
MOT : Minot International 222,188 3,986 4,054 1.7% 274,667 294,845 7.3%
MQT : Marquette County 38,302 978 N/A N/A 48,900 N/A N/A
MRY : Monterey Peninsula 196,268 6,147 6,039 -1.8% 277,677 286,715 3.3%
MSL : Muscle Shoals 4,160 641 625 -2.5% 29,364 20,976 -28.6%
MSO : Johnson-Bell Field 303,886 5,136 4,866 -5.3% 358,950 340,297 -5.2%
MSS : Richard Field 4,964 1,095 1,095 0.0% 9,855 9,855 0.0%
MTJ : Montrose County 75,296 1,710 1,742 1.9% 100,170 120,472 20.3%
MVY : Marthas Vineyard 50,484 6,864 6,484 -5.5% 81,734 85,905 5.1%
MWA : Williamson County 11,411 1,879 1,878 -0.1% 16,911 16,902 -0.1%
OAJ : Albert J Ellis 174,358 4,675 4,847 3.7% 249,317 245,679 -1.5%
OGS : Ogdensburg Municipal 5,033 1,095 1,095 0.0% 9,855 9,855 0.0%
OLF : Wolf Point Intl 2,987 966 907 -6.1% 18,354 16,793 -8.5%
OME : Nome 59,807 9,075 8,935 -1.5% 183,795 175,963 -4.3%
OTH : North Bend Municipal 18,283 1,711 1,488 -13.0% 32,678 29,115 -10.9%
OTZ : Ralph Wien Memorial 63,032 9,225 9,188 -0.4% 172,616 164,698 -4.6%
OWB : Daviess County 30,795 1,138 1,056 -7.2% 38,528 28,041 -27.2%
PAH : Barkley Regional 20,734 731 729 -0.3% 36,550 36,450 -0.3%
PBG : Plattsburgh Intl Airport 112,493 1,504 1,659 10.3% 139,910 188,377 34.6%
PDT : Pendleton Municipal 5,066 1,145 1,149 0.3% 10,353 11,400 10.1%
PGA : Page 23,462 1,897 1,527 -19.5% 34,963 27,703 -20.8%
PGD : Charlotte County Airport 99,897 703 1,154 64.2% 108,175 191,564 77.1%
PGV : Pitt-Greenville 61,987 1,741 1,686 -3.2% 85,438 81,635 -4.5%
PHF : Newport News/Wmsburg 314,139 7,246 6,574 -9.3% 454,871 364,317 -19.9%
PIA : Greater Peoria 286,507 6,878 6,840 -0.6% 387,304 394,446 1.8%
PIB : Hesler/Noble Field 13,857 640 625 -2.3% 29,314 20,976 -28.4%
PIH : Pocatello Municipal 22,214 991 981 -1.0% 33,990 36,690 7.9%
Airport Enplaned Pax (2012) Departures (2012) Departures (2013) % Change Flights 12-13 Seats (2012) Seats (2013) % Change Seats 12-13 PLN : Emmet County 24,864 808 816 1.0% 40,400 40,800 1.0%
PPG : Pago Pago Intl 49,213 110 117 6.4% 28,600 30,341 6.1%
PQI : Presque Isle Muni 12,412 1,182 1,078 -8.8% 40,188 36,652 -8.8%
PRC : Prescott Mun 5,152 1,288 1,402 8.9% 24,472 26,638 8.9%
PSC : Tri-Cities 329,833 5,934 5,893 -0.7% 417,032 411,953 -1.2%
PSE : Ponce 95,787 835 792 -5.1% 125,050 111,350 -11.0%
PSG : Petersburg Municipal 18,800 727 726 -0.1% 78,480 78,336 -0.2%
PUB : Pueblo Memorial 9,812 1,238 1,194 -3.6% 27,845 22,686 -18.5%
PUW : Moscow Regional 38,547 960 969 0.9% 72,960 73,644 0.9%
PVC : Provincetown Muni 11,580 2,260 2,176 -3.7% 20,340 19,584 -3.7%
PVU : Provo Municipal 29,755 366 194 -47.0% 35,684 31,295 -12.3%
RAP : Rapid City Regional 252,592 5,735 5,544 -3.3% 339,167 357,603 5.4%
RDD : Redding Municipal 29,175 1,737 1,196 -31.1% 48,694 35,380 -27.3%
RDM : Roberts Field 229,736 5,389 5,424 0.6% 304,758 300,056 -1.5%
RFD : Greater Rockford 106,412 693 644 -7.1% 99,126 104,085 5.0%
RHI : Oneida County 11,119 776 1,042 34.3% 35,407 52,100 47.1%
RIW : Riverton Municipal 13,189 1,135 1,249 10.0% 23,072 31,365 35.9%
RKD : Knox County Regional 15,720 1,316 1,309 -0.5% 11,844 11,781 -0.5%
RKS : Sweetwater County 28,270 2,193 1,941 -11.5% 65,790 58,230 -11.5%
ROA : Roanoke Municipal 315,877 8,982 8,891 -1.0% 455,963 461,878 1.3%
ROP : Rota 13,206 1,580 N/A N/A 50,024 N/A N/A
ROW : Roswell Industrial 34,652 1,042 1,040 -0.2% 46,548 46,498 -0.1%
RST : Rochester Municipal 105,371 3,235 3,318 2.6% 154,082 164,168 6.5%
RUT : Rutland State 5,916 1,155 1,095 -5.2% 10,395 9,855 -5.2%
SAF : Santa Fe County Muni 47,847 1,484 2,724 83.6% 66,372 106,722 60.8%
SBN : St Joseph County 299,592 6,417 6,172 -3.8% 381,746 398,148 4.3%
SBP : San Luis Obispo Cty 127,336 4,910 4,738 -3.5% 171,848 175,489 2.1%
SBY : Wicomico County 76,372 2,344 2,108 -10.1% 107,105 87,576 -18.2%
SCC : Prudhoe / Deadhorse 43,837 1,837 1,949 6.1% 85,019 103,059 21.2%
SCE : State College 137,599 4,736 4,497 -5.0% 199,192 190,244 -4.5%
SCK : Stockton Airport 63,149 444 443 -0.2% 67,560 75,543 11.8%
SDY : Richard Municipal 11,858 1,117 1,390 24.4% 21,223 25,310 19.3%
SGF : Springfield Branson Re 364,689 8,061 7,997 -0.8% 458,058 458,331 0.1%
SGU : St George Municipal 53,977 2,034 1,787 -12.1% 88,860 85,630 -3.6%
SHD : Shenandoah Valley 15,179 1,400 1,108 -20.9% 49,472 42,040 -15.0% SHR : Sheridan County 12,889 1,096 1,042 -4.9% 24,883 30,006 20.6% SHV : Shreveport Regional 276,460 7,795 7,720 -1.0% 399,570 393,770 -1.5% SIT : Sitka 68,222 1,265 1,242 -1.8% 182,160 178,939 -1.8% SJT : Mathis Field 56,301 1,422 1,746 22.8% 72,885 86,152 18.2% SLK : Adirondack 6,018 1,243 1,168 -6.0% 11,187 10,512 -6.0% SLN : Salina Municipal 3,526 942 939 -0.3% 8,478 8,466 -0.1%
Airport Enplaned Pax (2012) Departures (2012) Departures (2013) % Change Flights 12-13 Seats (2012) Seats (2013) % Change Seats 12-13
SMX : Santa Maria Public 44,737 1,549 1,464 -5.5% 68,126 73,657 8.1%
SOW : Show Low 3,852 1,372 1,005 -26.7% 26,068 19,095 -26.7%
SPI : Springfield Capital 65,756 2,069 1,954 -5.6% 106,557 106,289 -0.3%
SPS : Sheppard Afb 38,836 1,292 1,402 8.5% 65,620 69,320 5.6%
STS : Sonoma County 105,728 1,870 1,955 4.5% 142,120 148,580 4.5%
STX : Alexander Hamilton 200,727 8,620 7,841 -9.0% 282,554 243,354 -13.9%
SUN : Friedman Memorial 47,734 2,029 2,145 5.7% 79,224 83,976 6.0%
SUX : Sioux Gateway 27,168 674 677 0.4% 33,700 33,850 0.4%
SVC : Grant County N/A 670 623 -7.0% 12,730 11,837 -7.0%
SWF : Newburgh Stewart 185,389 3,757 3,219 -14.3% 225,248 193,144 -14.3%
TBN : Forney Aaf 7,894 1,513 1,512 -0.1% 13,617 13,608 -0.1%
TEX : Telluride 7,828 776 574 -26.0% 14,744 10,906 -26.0%
TIQ : Tinian 10,203 4,715 N/A N/A 37,720 N/A N/A
TLH : Tallahassee Muni 331,296 8,201 7,676 -6.4% 449,193 441,663 -1.7%
TOL : Toledo Express 78,757 1,600 1,654 3.4% 95,059 105,616 11.1%
TRI : Tri City Arpt, Tn-Regi 206,904 5,048 4,701 -6.9% 277,508 273,294 -1.5%
TUP : Lemons Municipal 8,191 1,302 1,875 44.0% 57,042 62,928 10.3%
TVC : Cherry Capital 179,879 4,457 4,539 1.8% 231,078 236,191 2.2%
TVF : Thief River Falls Regi 2,819 865 621 -28.2% 27,147 11,799 -56.5%
TWF : City County 26,059 1,076 1,220 13.4% 32,400 36,600 13.0%
TXK : Texarkana Municipal 28,080 1,055 1,162 10.1% 44,287 56,437 27.4%
TYR : Pounds Field 73,841 2,773 2,702 -2.6% 113,628 121,296 6.7%
UIN : Baldwin Field 10,165 1,897 1,878 -1.0% 17,073 16,902 -1.0%
UNK : Unalakleet 13,070 3,422 3,852 12.6% 49,483 56,987 15.2%
VCT : County-Foster 4,597 438 1,252 185.8% 12,492 11,716 -6.2%
VDZ : Valdez Municipal 16,087 1,661 1,375 -17.2% 36,681 34,429 -6.1%
VEL : Vernal 7,370 980 964 -1.6% 18,620 18,580 -0.2%
VIS : Visalia Municipal 3,354 1,448 869 -40.0% 27,512 16,511 -40.0%
VLD : Valdosta Regional 37,030 1,034 1,034 0.0% 51,700 51,700 0.0% VQS : Vieques 56,266 5,966 5,556 -6.9% 58,343 55,865 -4.2% WRG : Wrangell Airport 11,434 727 726 -0.1% 78,480 78,336 -0.2% WRL : Worland Municipal 2,795 615 624 1.5% 11,685 11,856 1.5% WYS : Yellowstone 4,965 280 272 -2.9% 8,400 8,160 -2.9% YAK : Yakutat 10,100 724 722 -0.3% 78,264 78,264 0.0%
YKM : Yakima Air Terminal 57,673 2,222 1,036 -53.4% 90,188 78,736 -12.7%
YNG : Youngstown Muni 40,102 247 280 13.4% 37,642 46,513 23.6%
YUM : Yuma International 81,377 3,195 N/A N/A 135,058 N/A N/A