Affinity Flow Fractionation For Label-Free
Cell Sorting
By
Suman Bose
B.Tech., Indian Institute of Technology Kharagpur, India (2007) M.Tech., Indian Institute of Technology Kharagpur, India (2007)
S.M., Massachusetts Institute of Technology, USA (2009)
Submitted to the Department of Mechanical Engineering in Partial Fulfillment of the Requirements for the Degree of
Doctor of Philosophy in Mechanical Engineering
at the
MASSACHUSETTS INSTITUTE OF TECHNOLOGY February 2014
© 2014 Massachusetts Institute of Technology. All rights reserved
Signature of Author
Department of Mechanical Engineering September 27th, 2013
Certified by
Rohit Karnik
Associate Professor of Mechanical Engineering Thesis Supervisor Accepted by
David E. Hardt
Professor of Mechanical Engineering Graduate Office
Affinity Flow Fractionation For Label-Free Cell Sorting
bySuman Bose
Submitted to the Department of Mechanical Engineering on September 27th, 2013 in partial fulfillment of the requirements for the Degree of Doctor of Philosophy in
Mechanical Engineering. ABSTRACT
Capture and isolation of flowing cells from body fluids such as peripheral blood, bone marrow or pleural effusion has enormous implications in diagnosis, disease monitoring, and drug testing. However, in many situations the conventional methods of cell sorting are of limited use due to complex sample preparation steps, high costs, or low sensitivity. Drawing inspiration from nature, a novel platform technology for cell separation known as Affinity Flow Fractionation (AFF) was developed. AFF relies on interaction of cells with asymmetric patterns of weak adhesive molecules allowing for continuous sorting of cells with high purity without irreversible capture of cells. Cells are sorted in a single step, which is a significant advance over conventional immunocapture methods, especially for point-of-care and point-of-use applications.
In this work, first, the interaction of cells under shear flow with asymmetric patterns of weak adhesive molecules was studied systematically to highlight the underlying mechanism of AFF at a phenomenological level. Next, an optimized separation device was fabricated and its performance was characterized using model cell lines. A detailed predictive mathematical model, which accounts for the major transport processes involved in cell separation by AFF, was developed and the results validated using experiments.
Finally, AFF was applied for rapid isolation of neutrophils from blood, which is important for several applications where conventional procedures involve multiple steps and time-intense manual skills. It was demonstrated that asymmetric patterns of P-selectin, a weak adhesive molecule involved in cell trafficking, can directly draw neutrophils out of a continuously flowing stream of blood, with high purity (92%). As cells exhibiting non-specific adhesion are not drawn out of the flowing stream, an ultrahigh 400,000-fold enrichment of leukocytes over erythrocytes is achieved. Moreover, the sorted neutrophils remain viable, unaltered, and functionally intact. The lack of background erythrocytes enabled direct enumeration of neutrophils by a
neutrophils for diagnosis of sepsis, genetic analysis, HLA typing, assessment of chemoreadiness, and other applications.
Weak molecular interactions govern a large number of important physiological processes such as stem cell homing, inflammation, immune modulation and cancer metastasis. Yet, currently there are no effective technologies that can separate cells based on weak interactions alone. We believe, AFF would fulfill this un-met need in the area of cell sorting and enabling new discoveries.
Keywords: Microfluidics, Cell sorting, cell rolling, selectin, blood, point-of-care, neutrophils.
Thesis Committee:
Prof. Rohit Karnik, Associate Professor of Mechanical Engineering, MIT. (Thesis Supervisor)
Prof. Roger D. Kamm, Professor of Mechanical and Biological Engineering, MIT
Prof. Jeffrey M. Karp, Associate Professor of Medicine, Harvard Medical School, Brigham and Women’s Hospital.
Acknowledgements………..…..………..9
List of Abbreviations………..………...10
List of Symbols……….……….…..11
List of Figures and Tables……….…………...……12
1. Introduction……….……….….15
1.1 Principles of cell sorting……….………..…..16
1.2 Microfluidic cell sorting and clinical relevance………...17
1.3 Affinity based separation: use of moderate to low affinity molecules………...20
1.4 Asymmetric weak adhesive interactions: Towards AFF………..…..21
2. Studying Interaction Of Cells With Asymmetric Receptor Patterns……….…..25
2.1 Introduction ……….……25
2.2 Materials and Methods……….…….….28
2.2.1 Materials……….…28
2.2.2 Fabrication of Patterned Substrates……….……….…29
2.2.3 Cell Rolling Experiments in a Flow Chamber……….……30
2.2.4 Data Analysis……….………30
2.2.5 Simulation of Cell Rolling Trajectories………35
2.3 Results and Discussion………..….35
2.3.1 Effect of Edge Angle on the Rolling Behavior of HL60 Cells ………..37
2.3.2 Effect of Shear Stress on Rolling Behavior of HL60 Cells ………...39
2.3.3 Effect of P-selectin Density on Rolling Behavior of HL60 Cells……….40
2.3.4 Detachment of cells rolling along an edge modeled as a Poisson process...…….41
2.3.5 Prediction of cell trajectories on a receptor-patterned substrate………...46
2.4 Conclusion………..………49
Acknowledgements………..………50
3. Creating functional surfaces……….…………...51
3.1 Introduction………....………51
3.2 Design considerations……….……...…52
3.3 Background………..………..…52
3.4 Microfluidic device design ……….……….…..56
3.5 Screening of surface functionalization protocol ………...………….57
3.6 Immobilization of P-select………..……….….…… 60
3.7 Final fabrication protocol ………..……65
3.8 Characterization of substrate ………..…...67
3.9 Conclusion………..……68
Acknowledgements………..… …...68
4. Separation of model cell lines……….……… 69
4.1 Introduction………..………..………69
4.2 Experimental setup for cell separation……….………..……70
4.3 Separation of HL60 cells from K562 cells………..…………...……70
4.4 Separation metrics………...…73
4.5 Mathematical Modeling of separation process ……….……….……...76
4.5.2 Estimation of the model parameters………..…………...………77
5.1 Introduction………..………..………85
5.2 Sorting of neutrophils from blood ………..………...…86
5.3 Purity and efficiency ………..…...……88
5.4 Characterization of sorted cells ………...…………90
5.4.1 Hematological analysis ………..….……90
5.4.2 P-selectin binding ………...….…91
5.4.3 Activation assay ………..……….………….………...……92
5.4.4 Phagocytosis assay ……….…….…94
5.5 Label-free detection of neutrophil activation in blood ………....…..95
5.6 Conclusion ……….………..…..…98
6. Conclusions and Discussion ………....…..…101
It gives me great pleasure to thank the people who have made this work possible.
I feel very fortunate to have the opportunity to work closely with Prof. Rohit Karnik. Rohit is an extraordinary teacher, adviser, mentor and a friend. Rohit allowed immense creative freedom in my research and let me follow my path, while at the same time providing necessary guidance and support, which ultimately helped me develop confidence, passion and conviction in my work. Rohit’s passion for science, commitment to his students, principles and life vision has been truly inspiring for me, and hopefully I can carry his teachings into my career ahead.
Next, I would like to thank Prof. Jeff Karp who has been like a second adviser to me. Jeff had been instrumental in shaping up the project right from its conception and especially in realizing the clinical aspect of the work. Jeff’s enthusiasm about translational research was one of the key factors that motivated me to pursue a career in translational medicine. Also, I would like to thank Prof. Roger Kamm who has given many valuable suggestions and insightful comments on the work. Despite his busy schedule, Roger has been very generous with his time and has always provided great career advices.I would also like to thank Dr. Ulrich von Adrian and Dr. David Sloane who provided a number of great suggestions about the project.
Next, I would like to thank my colleagues whom I have worked closely in my grad school on various projects - Chia-Hua Lee, Chong Shen, Rishi Singh, Mikhail Hanewich Hollatz, Cheryl Cui, Weian Zhao, Minhee and Lim. Working together with Chia was a great experience, which I will miss. She has been an amazing colleague and a great friend. I feel privileged to have had the opportunity to mentor Chong, Rishi and Mikhail. This work would not have been successful without their hard work and dedication. While mentoring them was a great experience, I have probably learned more than I have taught my students.
I owe a special thanks to all my friends whom I have met over the years at MIT. These were probably some of the best minds I have come across. They have been motivating, inspiring, and all the amazing time I spend with these people made graduate life memorable. Thanks Marco –for all the late night beer, life philosophies and for cheering me up after failed experiments, Jongho – for your friendship, dinner and coffees, Sankha –for the evening strolls, ‘adda’ and your support, Ioannis – for pushing me when I would give up. I would also like to thank – Sean, Tarun, Sung-Young, Jason, Mike, Sunandini, Jong-Min, Maria, Tom and Sumeet. It was my pleasure to know you guys and thank you for all your support.
Last, but not the least, I would like to specially thank my mom, dad and my family in India. Today, I have reached this position because of what they have taught me, values they instilled in me, sacrifices they made, their love and support.
AFM Atomic force microscope APC Allophycocyanin
BSA Bovine serum albumin CD Cluster of differentiation
CDF Cumulative distribution function CTC Circulating tumor cell
DC Dendritic cells
DPBS Dulbecco’s Phosphate Buffered Saline DSP Dithiobis succinimidyl propionate E.R Enrichment ratio
EC Endothelial cells
EDTA Ethylenediaminetetraacetic acid ELISA Enzyme linked immunosorbent assay ESL-1 E-selectin ligand 1
FACS Fluorescence activated cell sorting FBS Fetal bovine serum
FC Flow cytometry
FITC Fluorescence isothiocyanate HBSS Hank’s Balanced Salt Solution HIV Human Immunodeficiency Virus MACS Magnetic activated cell sorting MHC Major Histocompatibility Complex MSC Mesenchymal stem cells
NHS N-hydroxysuccinimide
NSAID Non-steroidal anti-inflammatory drug PDF Probability distribution function PDMS Polydimethylsiloxane
PE Phycoerythrin PEG Polyethylene glycol PNAd Peripherial node addressin POC Point of care
PSGL-1 P-selectin glycoprotein ligand 1 RBC Red blood cells
SAM Self assembled monolayer SD Standard deviation
SEM Scanning electron microscope VCAM Vascular cell adhesion molecule WBC White blood cells
English symbols
b distance between patterns
d lateral displacement of cell
D Mean displacement of the cell population
D* Normalized D
g gravitational acceleration
h channel height
L Length of travel for a cell
L* Normalized L
le edge tracking length
Neff Number of effective bands on which the cells rolled on
P∞ Probability of attachment from free stream
P0 Probability of reattachment of a rolling cell on the next downstream band
Pattach Net attachment probability of a cell flowing over a number of bands
Peff Net average probability of attachment of a cell on a single band
pi purity of input sample
ps purity of sorted sample
pw purity of waste sample
pnt, sorted purity of non-target cells in sorted sample
pnt,input purity of non-target cells in input sample
pt,input purity of target cells in input sample
pt,sorted purity of target cells in sorted sample
Q flow rate
r recovery of target cells
ve,x component of edge velocity along fluid flow
ve,y component of edge velocity normal to fluid flow
ve velocity of rolling cells on pattern edge
Vfluid,x velocity of the fluid
vp velocity of rolling cells on plain region
w channel width
wc width of cell stream
wp width of patterned region
z height of cell from channel floor
Greek symbols
α edge inclination angle λ mean of Poisson distribution µ viscosity
σ Standard deviation of displacements of cells τ wall shear stress
Figures
Figure 1.1: Cell sorting: Principles and applications.
Figure 1.2: Procedure of performing diagnostic tests with a centralized laboratory. Figure 1.3: Affinity Flow Fractionation of cells.
Figure 2.1. Studying interaction of cells with asymmetric receptor patterns Figure 2.2. Schematic diagram for patterning of P-selectin on a gold substrate Figure 2.3. Flow chart describing the cell tracking and analysis algorithm. Figure 2.4. Characterization of P-selectin patterned substrates for cell rolling. Figure 2.5. Tracks of HL60 cells rolling on P-selectin lines.
Figure 2.6. Effect of edge inclination angle α on rolling behavior of HL60 cells Figure 2.7. Effect of shear stress τ on rolling behavior of HL60 cells
Figure 2.8. Effect of P-selectin incubation concentration on rolling behavior of HL60 cells
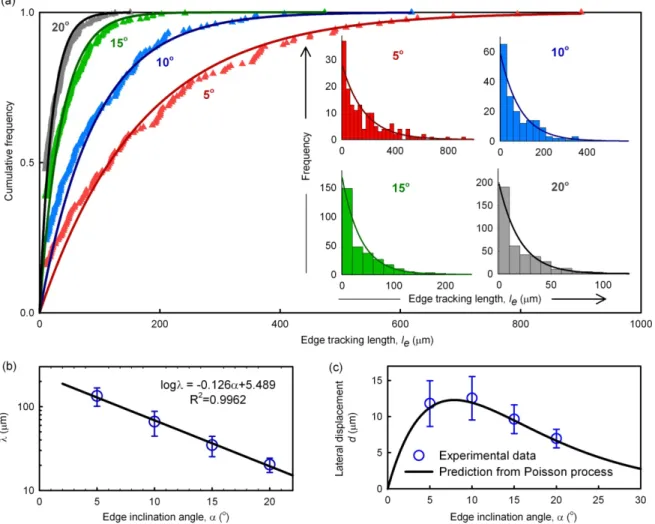
Figure 2.9. Detachment of cells rolling along an edge is well described by a Poisson distribution.
Figure 2.10. Probability distribution of net lateral displacement of HL-60 cells after rolling on consecutive bands of P-selectin patterns as obtained from Monte Carlo
simulations and experimental observations.
Figure 3.1. Schematic showing the different mechanisms though which proteins can interact with solid substrates.
Figure 3.2. Design of the separation channel.
Figure 3.3. Rolling velocity of HL60 cells at different shear stress on substrates functionalized with P-selectin using different functional groups. Figure 3.4. Passivation of glass.
Figure 3.5. Immobilizing P-selectin with proper orientation on the substrate Figure 3.6. Testing immunogenicity of rolling surfaces prepared using different
immobilization protocols.
Figure 3.7. Schematic for fabrication and assembly of separation devices Figure 4.1. Schematic of the experimental setup for cell separation Figure 4.2. Separation characterization using HL60 and K562 cells. Figure 4.3. Performance of separation
Figure 4.4. Schematic description of the key processes governing the transport of cells inside the separation device.
Figure 4.5. Schematic of parameters used in mathematical model.
Figure 4.6. Edge tracking length of HL60 cells and neutrophils on P-selectin patterns Figure 4.7. Theoretical modeling of cell separation in the device.
Figure 5.1. Direct isolation of neutrophils from blood using AFF. Figure 5.2. Purity of sorted neutrophils.
Figure 5.3. Purity of the samples determined by flow cytometric analysis. Figure 5.4. P-selectin binding affinity of the input and sorted fractions. Figure 5.5. Activation assay of sorted neutrophils.
Figure 5.6. Phagocytosis activity of neutrophils in whole blood and sorted fraction. Figure 5.7. Detecting neutrophil activation using activation-dependent cell sorting.
Figure 6.1. Applications of Affinity Flow Fractionation of cells
Tables
Table 1.1: Clinical applications of cell sorting
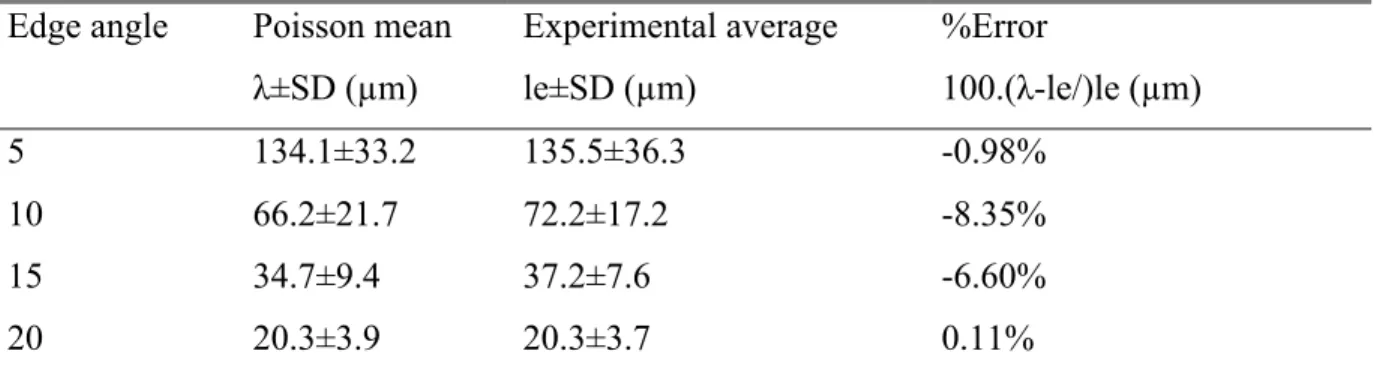
Table 2.1. Comparison of the experimental and Poisson average value of λ. Table 5.1. Comparison of AFF with other blood cell separation methods
1
Introduction
Isolation of cells from complex mixtures is of immense importance in disease diagnosis1,2, stem cell therapeutics4, genetic analysis5, and biological research. The samples of interests vary in composition and complexity, and can range from simple cell suspensions, complex mixtures such as - blood, peritoneal fluids, cerebrospinal fluids and bronchial aspirate or even tissue samples such as bone marrow. Blood, which is a common clinical sample, is composed of a wide variety of cells of different shapes and sizes. The abundance of cells also vary over a wide range, with RBCs present in the order of 5 billion per mL, leukocytes at 10 million per mL and rare cells such as antigen specific T cells, circulating tumor cells and stem cells at 1 or less per mL of blood6. Thus a variety of techniques have been developed to address the needs for different applications.
In clinical diagnostics, RBC and WBC counts and leukocyte differentials are routinely used to diagnose infections, anemia, parasitimea, hematological diseases, stress and variety of other disorders2. Cell based therapies also require isolation and purification of the donor cells before transferring them to the recipient. Enrichment of CD34+ cells and depletion of T-cells from umbilical chord blood7 and bone marrow, followed by ex vivo expansion increases efficacy of stem cell graft treatment8-11. Similarly, mesenchymal
stem cells (MSCs) are usually rare in adult tissue and needs to be isolated from donor tissue (marrow and adipose tissue) and expanded ex vivo before transferring to recipient12-15. With many new cell based therapies being recently approved by FDA16 or in the pipeline, cell isolation methods are certainly going to take center stage in the therapeutics market17-24. Table 1.1 summarizes the major clinical applications of cell sorting.
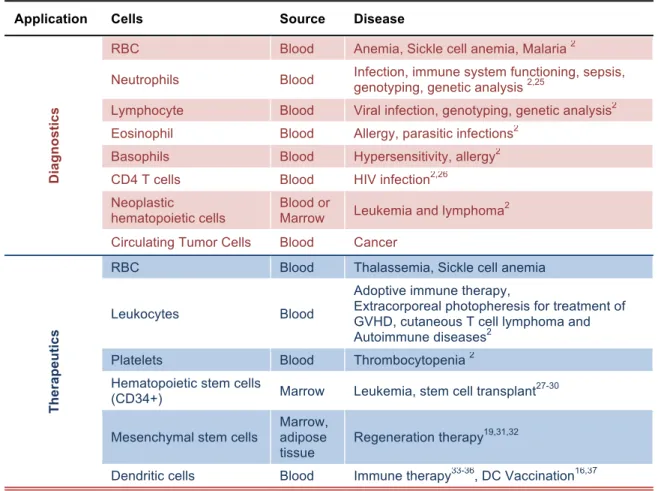
Table 1.1. Clinical applications of cell sorting
Application Cells Source Disease
Di a g n o s ti c s
RBC Blood Anemia, Sickle cell anemia, Malaria 2
Neutrophils Blood Infection, immune system functioning, sepsis, genotyping, genetic analysis 2,25
Lymphocyte Blood Viral infection, genotyping, genetic analysis2
Eosinophil Blood Allergy, parasitic infections2
Basophils Blood Hypersensitivity, allergy2
CD4 T cells Blood HIV infection2,26
Neoplastic
hematopoietic cells
Blood or
Marrow Leukemia and lymphoma
2
Circulating Tumor Cells Blood Cancer
Th e ra p e u ti c s
RBC Blood Thalassemia, Sickle cell anemia
Leukocytes Blood
Adoptive immune therapy,
Extracorporeal photopheresis for treatment of GVHD, cutaneous T cell lymphoma and Autoimmune diseases2
Platelets Blood Thrombocytopenia 2 Hematopoietic stem cells
(CD34+) Marrow Leukemia, stem cell transplant27-30 Mesenchymal stem cells
Marrow, adipose
tissue Regeneration therapy
19,31,32
Dendritic cells Blood Immune therapy33-36, DC Vaccination16,37
1.1 Principles of cells sorting
A number of parameters such as – shape, size, density, deformability, membrane electrical impedance and intracellular and extracellular protein expression have been used to differentiate and isolate cells38. Physical parameters such as shape, size, density, stiffness and membrane conductance provide only a moderate degree of specificity to cell type, and correlation to clinical condition is often weak. On the other hand, isolation based on expression of proteins provides a more specific approach to identification and
isolation of cell populations and if often more widely used in clinics and laboratories2. Cluster of differentiation (CD) proteins, which are expressed on cell surface, are used as surface markers to immunophenotype cells into different sub groups, and are often the target for specific cell isolation techniques39.
Specific cell surface molecules are often detected though molecules (ligands, antibody, aptamer), which specifically bind to the target marker. The antibody can be ‘tagged’ with a - fluorescent molecules that enable fluorescent based sorting (FACS), magnetic nanoparticle to pull the target cells out of the solution (MASC) or just used to capture cells on a solid surface (Affinity based separation). These methods are shown in Fig 1.1. While a number of variations on this theme are possible, it is important to note that all of these methods rely upon specific receptor-ligand interactions on the cell surface.
Figure 1.1. Cell sorting: Principles and applications. Sorting of cells based on specific surface marker relies on using antibody-antigen interactions to produce a signal. Popular methods of separation are fluorescence based sorting (FACS), magnetic based sorting (MACS) and affinity capture.
Cell sorting and counting is performed as a routine process in the clinics and forms a major process in disease diagnosis. Most commonly, blood counts are performed using automated counters, which use a combination of Coulter principle and light scattering pattern to identify major blood cell types i.e Red blood cells (erythrocytes), granulocytes, monocytes and lymphocytes2. However, further immunotyping of blood cells into further subgroups requires identification of specific CD surface marker and is commonly done though FACS2.
Figure 1.2. Procedure of performing diagnostic tests with a centralized laboratory involves transportation, storage and sample preparation which adding to the time and cost of performing tests. Microfluidic chips can pack several functionalities from sample collection, processing and analysis into a single disposable and inexpensive unit allowing for diagnostic tests to be performed near the patient.
The workflow of clinical samples from the patient to the hematology labs usually involves multiple transportation and sample preparation steps that are time consuming and labor intensive, adding to the cost and time required preforming these tests. Because of the physical distance between the patient and diagnostic instrument especially in resource limited settings, obtaining a simple blood count may take anywhere between a day upto a week, delaying diagnosis and treatment. Point-of-care (POC) devices which perform diagnostic test on the patient’s bed side offers a solution to this problem40-42. An ideal POC device would be resource independent, fast, require less or little manual
intervention and inexpensive. Microfluidics offers a great alternative to the traditional diagnostic methods since they have the potential to pack the functionalities of sample preparation and analysis into a single unit (see Fig 1.2), consumes very little reagents and are fast and inexpensive43-46.
While a large number of microfluidics POC devices have been developed and commercially adopted for performing clinical chemistry and immunodiagnostics47-54, development of devices for hematological tests remains limited55. The Toner group developed a CD4+ T-cell counter though capture of CD4+ cells on antibody coated microfluidic channel56,57 and developed methods to quantify the levels of such cells in blood though electrical impedance measurement though the channel58. Daktari Diagnostic Inc has commercialized the CD4 chip for monitoring HIV treatment in developing countries. The same group also developed chips based on immunocapture for isolation of circulating tumor cells (CTCs) for monitoring of cancer metastatis59 and isolation of granulocyte from trauma and burn patients for genomic and proteomic studies5. A number of other studies have looked at immunocapture based sorting of cells within microchannels with the focus on modifying the channel geometry60,61 or surface topographies62 to enhance cell-surface interaction increasing efficiency. In an alternative approaches to immunocapture, cells pre-labeled with magnetic particles63 or dielectric particles64 have been sorted from a cell mixture inside a microfluidic chip with high efficiency and purity. Microfluidics MACS have been used to isolate viable CTCs for single cell genomics65 and could potentially be used to filter bacteria from blood of septic patients66. However, the requirement for labeling and high cost of the magnetic beads makes MACS based techniques more suitable for laboratory scale cell processing and analysis tool, impacting its use as a POC instrument.
A number of techniques have also been developed for label-free sorting of cells based on non-specific characteristics67. On-chip lysis of RBC though osmotic shock has been reported to isolate leukocyte suitable for genomic analysis68. Several groups have developed microfluidic filters that perform size-based separation of cells allowing sorting of different cellular component of blood - RBC, leukocytes and platelets6. On similar lines, interaction of cells with microstructures inside channel have been leveraged to isolate cells based on deformability69 and detect diseases such as sickle cell anemia70.
Recently, spiral microchannel with trapezoidal cross section have been used to isolate leukocytes71 and CTCs72 from diluted blood using differences in density between the cell types. Differences in electric and magnetic properties of RBCs and WBCs have been used to attempt at separating the cell types using dielectrophoresis73 and MACS74. For a more comprehensive review of different cell sorting techniques, the readers are directed elsewhere75,76. A review of the current microfluidic devices that have been commercialized can be found here77.
1.3 Affinity based separation: use of moderate to low affinity molecules
Affinity based separation has been widely used for achieving label-free and surface marker specific sorting of cells. However, the use of high-affinity antibodies as affinity molecules limits the usability of these devices since retrieval of the sorted sample is at best difficult if not impossible. Counting of cells trapped inside microfluidic channels poses a problem in obtaining easy reliable counts and might require uses of microscope or other equipment. For example, the CD4 cell counting device developed by the Toner group and Daktari requires successive rinses with several buffers actuated in sequence by an external instrument to enumerate the captured cells. In contrast to antibodies, other molecules having low affinity have also been investigated for affinity based fractionation of cells.
Lectins – which are a class of carbohydrate binding proteins, have been used for sorting cells though affinity columns78. Binding of lectins is relatively non-specific to cell types and depends on a number of factors like metabolic state, stage of cell division and differentiation and surface protein glycosylation. Lectins affinity columns have been thus used to isolate stem cells based on differentiation or homing potential79-82.
Physiological weak affinity adhesive interactions have also been exploited in an interesting manner in vivo for cell separation. Nature has evolved a number of molecules that exhibit weak, yet relatively specific adhesive interactions including bacterial adhesion molecules83, selectins involved in homing of circulating cells84, and MHC-II molecules on antigen presenting cells that exhibit weak affinity towards the T-cell receptor85. Selectins – glycoproteins involved in cell trafficking, have been particularly
studied extensively and used for cell separation purpose. A brief review of the phenomenon of cell trafficking along with different ligands involved is presented below. Selectin coated surfaces have been proposed for separation of leukemia cells based on their differential rolling velocity86. In another approach, P-selectin coated microtubes
have been used to capture CD45+ cells and CTCs from whole blood87,88 and selectin
co-Cell rolling: A brief synopsis
The immune system serves as to protect the body against harmful foreign objects and is critical for our survival. A major role of the immune system is to traffic different immune cells present in the blood to their target sites in the organ. This is achieved though a process called ‘cell rolling’, wherein the endothelial cells express weak affinity ligands, which interacts with the receptors on the surface of the leukocytes allowing them to latch on and stick to the endothelium3. Due to the weak nature of the interactions, the drag force on the cell due to blood flow break the bonds at the trailing edge of the cell allowing the cell to ‘roll’ forward such that new bonds can be formed at the leading edge. Next, specific signaling molecules called ‘chemokines’ acts upon the rolling cells initiating activation of other high-‐affinity surface adhesive molecules that allows for arrest of the cell on the endothelium. Then, the cell transmigrates though the endothelium and extravasates into the tissue.
Figure. Rolling of leukocytes on endothelium mediated through selectins. Source: Janeway’s Immunobiology 8th ed, GS.
Cell rolling is mediated by glycoproteins known as selectins, primarily expressed on endothelial cells, which interacts with a variety of ligands on leukocyte surface. Apart from leukocytes, stem cell and cancer cells also exhibit cell rolling. A list of selectins and corresponding ligands are listed below.
Selectin Expression Function Leukocytes Ligands EC Other L-‐selectin Constitutive on all Leuk, except effector/
memory T cells Lym homing, inflammation PSGL-‐1 PNAd (CD34) Mannose receptor, versican, sulfatide E-‐selectin Inflamed EC, hemangioblast, constitutive in skin and bone marrow inflammation s-‐Le x, s-‐Lea, PSGL-‐1, ESL-‐1 s-‐Lex, glycolipids P-‐selectin EC, platelets Inflammation, hemostasis PSGL-‐1 PNAd CD24
Leuk: leukocyte, EC: endothelial cell, Lym: lymphocyte, PSGL-‐1: P-‐selectin glycoprotein ligand 1, PNAd: Peripheral node addresin, s-‐Le: sialyl lewis, ESL-‐1: E-‐selectin ligand-‐1. Source: IM701 Lecture notes 2009 (Uli Von Adrian).
patterned with antibody has shown enhanced cell capture efficiency than antibody alone89. Lee and coworkers developed a microfluidic device with selectin coated micropillars and demonstrated the feasibility of using such devices for cell separation application90. Sorting is based on the fact that cells that interact strongly with the selectin are retained longer in the device while the weakly interacting cells would be washed out faster. However, the above-mentioned devices perform batch processing requiring multiple wash steps. Karnik and coworkers recently developed a microfluidic device that combined the principles of hydrophoresis with selectin based affinity separation91. Cells that interacted with selectin coated channel were transported into microgrooves, where the direction of the fluid stream pushes the cells away from the original stream. This technique overcomes the previous challenge of batch processing since cells can now be processed in a continuous manner. However, the hydrophoretic flow causes substantial size based dispersion of cells within the channel92 and hence these devices cannot be used for separation directly from blood.
1.4 Asymmetric weak adhesive interactions: Towards Affinity Flow
Fractionation
Affinity based fractionation allows for separation of cells based on a specific surface marker in a label-free method. Using weak affinity molecules allows for retrieval of sorted cells, but so far most of the reported affinity devices work in a batch operation mode restricting their use in building simple POC devices. On the opposite end of the spectrum, flow fractionation of cells - where flowing target cells are pulled across streamlines resulting in separation of cells in a continuous manner, have been limited to long-range physical forces arising from dielectrophoresis, acoustophoresis, gravitational, magnetic, or inertial effects. The non-specific action of these long-range force fields limits the use of flow fractionation of cells to a few applications, while its extension to sorting based on molecular recognition requires pre-labeling of cells with magnetic or dielectric beads93.
Karnik and coworkers in an earlier study94 demonstrated that transient interactions of cells with asymmetric patterns of weak affinity adhesive molecules exert forces on the cell to deflect it perpendicular to the direction of fluid flow, without capture. Specifically,
they patterned P-selectin – a molecule involved in trafficking of neutrophils during early phase of inflammation, at an angle to the flow direction and reported the deflection of rolling HL60 cells (promyelocytic leukemia cell line that demonstrates rolling on P-selectin) as they encountered the edges of the pattern (See Fig 1.3). Subsequently, other groups have also investigated the phenomenon theoretically95 and experimentally96. This
effect provides a new paradigm for label-free flow fractionation of cells based on specific molecular interaction, and is called affinity flow fractionation (AFF).
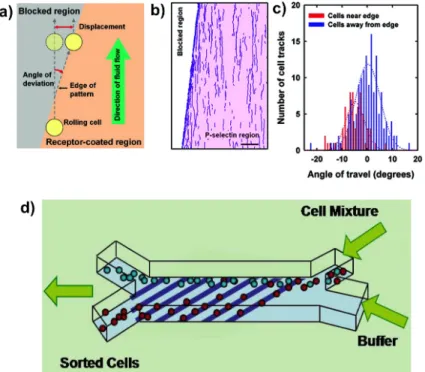
Figure 1.3. Affinity Flow Fractionation of cells. a) Patterns of weak affinity receptors introduce a displacement in the trajectory of a rolling cell as it follows the edge of the patterns. b) Tracks of rolling HL60 cells on a P-selectin patterned edge (P-selectin region shown in pink) could be seen to follow the edge. c) Quantification of angle of the tracks demonstrates that cells tend to follow the pattern direction. d) Schematics of a AFF based microfluidic separation device which uses a series of inclined receptor patterns to separate the target cells from the sample stream. Figure a-d are reproduced from Karnik et al. Nano Lett, 2008 94.
This work aims at mechanistic understanding the phenomenon of how the cells interact with asymmetric receptor patterns, and developing microfluidic devices based on AFF to achieve label-free surface marker specific fractionation of cells. Our aim is finally to develop AFF microfluidics devices such as the one shown in Fig1.3d, where a stream of cells is flowed over a patterned substrate, which draws a stream of purified target cells out of the original cell stream into the parallel buffer stream. Such devices should find wide usage in separating cells for diagnostics and therapeutic application.
The thesis has been divided into six chapters each covering investigation, design and fabrication, characterization, demonstration of application and finally conclusion. The interaction of cells with asymmetric patterns has been investigated in the second chapter, which gives mechanistic insights into the process of cell rolling on the edge. In Chapter 3, an optimized design for the AFF device has been developed based on the findings of the mechanistic study. A fabrication protocol was also developed. Next, in Chapter 4, we demonstrate the operational characteristics of the AFF devices using model cell lines (HL60 and K562) and develop a mathematical model to accurately predict the behavior of AFF devices. Then, in Chapter 5, we demonstrate application of AFF for sorting neutrophils from blood in a single step with high purity. Finally, in Chapter 6, we discuss the potentials for AFF as a general cell sorting tool and some of the applications where AFF might be useful.
2
Studying Interaction Of Cells With
Asymmetric Receptor Patterns
Note: This chapter is a modified version of the paper “ Examining the Lateral Displacement of HL60 Cells Rolling on Asymmetric P-Selectin Patterns” Lee et al., Langmuir, 2011, 27 (1), pp 240–249.
2.1 Introduction
Cell separation devices employ a host of different mechanisms to enable sorting of target cells from a mixed population6,67,97. However, at a fundamental level all of these techniques reply upon recognition of specific cell surface molecules by cognate ligand, which are linked to effector mechanisms that pulls the cells away from the general population. In affinity-based separations, the ligands are immobilized on surfaces or beads, which allows the target cells to adhere to the surface while the non-target contaminating cells can be washed off98. Understanding the transport of cells over these affinity surfaces and their capture is critical for design, engineering and optimization of the affinity based separation process.
Two major transport processes mainly govern the binding of cells to an affinity surface. First, the cells need to arrive in close proximity to the surface through the action of
long-range forces such as fluid flows and gravity. Second, the chemical kinetics of the reaction between the ligands on the surface to receptors on the cell dictates the adhesion process of the cells to the affinity surface99. However, in cases where the chemical affinity of the receptor-ligand interaction is weak, a third transport process becomes important. In such a scenario, bonds between the cell and surface breaks under the mechanical stress of the fluid flow resulting in transient interaction of the cell with the surface, allowing the cell to move along the direction of the force (fluid flow)100. This phenomenon, known as cell rolling 101, occurs due to continuous breakage of bonds due to fluid shear at the trailing edge while new bonds form at the leading edge resulting in a ‘rolling’ motion of the cell on the substrate. Rolling of leukocytes, lymphocytes and stem cells has been studied extensively in vivo101 and in vitro102 and many interesting observations about the dynamics of cells on selectin coated surfaces been reported102-107. For example, it was observed that the rolling of cells is fundamentally stochastic with periods of slow velocity followed by fast hopping of cells where the cells often return to free stream velocity102,105. The role of cellular structures such as the microvillus and kinetics of the receptor ligand interaction have been shown to play a crucial role on stability of rolling and its resistance to fluid shear stress108. Cell rolling has also been studies at a fundamental nano- as well as macro- scale though a number of analytical109, semi-analytical110,111 and computational models112-114. However most of these studies examined the motion of cells on unpatterned selectin coated surfaces. Karnik et.al94 in their pioneering study showed that patterned edges of selectin can deflect the motion of rolling cells along the edge direction. Based on that idea, a new class of separation devices is envisioned where the effect of displacement by asymmetric edges is amplified though interaction over multiple edges, resulting in separation of the target cells as shown in Figure 2.1(a). Since the mechanism of rolling on the receptor pattern edge is very different from that over plain surface, the results from the studies on the later form of rolling cannot be directly extrapolated to understand rolling on edge. Hence, fresh studies on quantitative understanding of the nature of cell rolling trajectories and lateral displacement on receptor-patterned substrates is warranted. Figure 2.1(b) shows the trajectories of cells rolling within such a patterned device substrate. Studies by Karnik et.al demonstrated that HL60 cells could track along P-selectin edges94; however, the
effect of flow conditions and pattern inclination angle on cell rolling trajectories was not studied. Furthermore, the distribution of edge tracking lengths and lateral displacements was not analyzed due to insufficient data obtained from a single patterned edge. Therefore, how the parameters of cell rolling relate to cell rolling trajectories and lateral displacements for such asymmetric patterns is poorly understood. For example, it is unknown to what extent cell rolling is affected by shear stress magnitudes or pattern inclination angles. Further, the nature of the detachment of cells after tracking along an edge is not known, and is it not yet established whether detachment of cells from such patterns is a random process that is unaltered by interaction history with the pattern itself. Systematic study of cell rolling trajectories along such well-defined receptor patterns is therefore prerequisite for addressing these issues and enabling the development of label-free devices for separation or analysis of cells such as the device envisioned in Figure 2.1.
In this chapter, the cell rolling trajectories have been quantified and the effect of pattern geometry, shear stress, and P-selectin incubation concentration on rolling of HL60 cells, which are widely used as a model to study leukocyte rolling90,101,115-117, have been studied. HL60 cell surfaces express a specific ligand termed P-selectin glycoprotein ligand-1 (PSGL-1)101 , which binds reversibly to the receptor P-selectin to enable rolling in vivo and in vitro. A technique based on microcontact printing (µCP) to pattern alternating µm-scale lines of adhesive P-selectin regions with passivating poly(ethylene glycol) regions on a gold substrate was developed. The edge tracking lengths and rolling velocities of HL60 cells along these patterned substrates within a flow chamber at different edge inclination angles and shear stress magnitudes were quantified. The distribution of edge tracking lengths and observation of re-attachment of cells were incorporated into a computational simulation tool to predict the trajectories of cells on a patterned substrate.
Figure 2.1. (a) Schematic diagram of a device for separation of cells. Cells rolling along patterned edges are laterally displaced into the adjacent buffer stream, resulting in separation. Pink lines indicate receptor-functionalized regions. Red and blue circles are cells that do and do not, respectively, express ligands that bind specifically to those receptors. (b) Illustration of a typical cell rolling trajectory along the receptor pattern inclined an angle α to the fluid flow direction: The cell binds within the receptor line, and rolls in the direction of shear flow toward the pattern edge. The cell then tracks the edge to define an edge tracking length le, resulting in a net lateral displacement d, before
detaching to continue along the direction of fluid flow before possible reattachment and rolling along a new receptor line. Cell rolling velocity vp along within the
receptor-functionalized line in the x-direction of fluid flow can be distinguished from the velocity ve along the line edge, where ve,y is lateral velocity (the vertical component perpendicular
to the streamlines and parallel to the lateral displacement, d).
2.2 Materials and Methods
2.2.1 Materials
Gold-coated glass slides were purchased from EMF Corp. All slides were cleaned with piranha solution prior to use (3:1 mixture of sulfuric acid (Sigma-Aldrich) to 30% hydrogen peroxide (Sigma-Aldrich)). (1-Mercaptoundec-11-yl)tetra(ethylene glycol) (PEG alkanethiol; Sigma-Aldrich) was diluted in absolute ethanol (Pharmco-AAPER) at a concentration of 5 mM for microcontact printing. Recombinant human P-selectin (R&D
Systems Inc.) and bovine serum albumin (BSA, Rockland Immunochemicals, Inc.) were diluted in 150 mM NaCl Dulbecco's phosphate buffered saline (DPBS, Mediatech Inc.). All materials employed in this study were used without further purification unless specified.
Figure 2.2 . Schematic diagram for patterning of P-selectin on a gold substrate involving microcontact printing. Step 1: Selective deposition of PEG molecules on the gold surface. Step 2: Filling in of the uncoated surface with P-selectin.
PDMS Stamps. Microcontact printing stamps that defined the receptor pattern were
fabricated in polydimethylsiloxane (PDMS) using an SU-8 molding process. The small line-patterned stamp (SS) (15 µm line width and 10 µm spacing between adjacent lines) and the large line-patterned stamp (LS) (70 µm stamping regions spaced 50 µm apart) were used to characterize the patterning process and cell rolling behavior, respectively. 2.2.2 Fabrication of Patterned Substrates.
A schematic diagram of the patterning process is shown in Figure 2.2.
Step 1: Microcontact printing (µCP) was used to form alternating self-assembled monolayers (SAMs) of PEG molecules on the gold substrate. The PDMS stamp was first inked with PEG solution in ethanol (5 mM), dried, and pressed onto the surface to be patterned for 40 s. The surface was then rinsed with ethanol and dried under a stream of N2.
Step 2: After selective deposition of PEG molecules, the substrates were incubated in P-selectin solution (15 µg/mL in DPBS, unless stated otherwise) using a perfusion chamber (Electron Microscopy Sciences) for 3 hours at room temperature to pattern the remaining areas with P-selectin. The surfaces were then backfilled with BSA (1 mg/mL in DPBS) for 1 h to block non-specific interactions.
Substrate Characterization. Atomic force microscopy (Veeco Dimension 3100; Tapping
mode; scan rate: 1 Hz) and scanning electron microscopy (JEOL 6700; acceleration voltage 3.5 kV) were used to characterize the patterned surface geometry. All substrates for AFM and SEM characterization were placed in a vacuum chamber overnight before imaging to minimize residual solvent on the surface; no further coating was employed for SEM imaging.
2.2.3 Cell Rolling Experiments in a Flow Chamber.
A suspension of HL60 cells (~105 cells/mL) was flowed over the patterned surfaces in a rectangular flow chamber (Glycotech, Inc; width w = 1.0 cm; length = 6 cm; height h = 0.005”) with inclination angles of the receptor pattern of either α = 5º, 10º, 15º or 20º at room temperature of 24.5°C. A syringe pump (World Precision Instruments (WPI), SP230IW) was used to generate different flow rates between 75 and 300 µL/min, with corresponding shear stresses of 0.5 – 2.0 dynes/cm2 (~0.05 to 0.2 Pa). Flow was laminar (Reynold’s number Re ~ 0.1-3) and shear stress τ was calculated using the plane Poiseuille flow equation τ = 6µQ/wh2, where µ is the kinematic viscosity, Q is volumetric flow rate, w is width of the flow chamber, and h is height of the flow chamber. An inverted microscope (Nikon TE2000-U) with a mounted camera (Andor iXon 885) was used to record HL60 rolling interactions with adhesive P-selectin substrates using a 4× objective, typically at a rate of 1 frame per second for durations of 300 s. For each shear stress magnitude and pattern inclination angle, three independent experiments were performed. Data are presented as mean and standard deviation of the average values obtained from each experiment.
2.2.4 Data Analysis.
The experiments in flow chamber produces a large volume of data in form of time sequenced images, which then needs to be analyzed to fish out the relevant data. We developed a custom in-lab program, coded in Matlab (Mathworks, Inc.) program that utilized a particle tracking freeware118 to detect the cells and generate tracks along the patterned line edges. We defined various filters to remove spurious tacks and then used
optimized fitting programs to analyze the tracks. The algorithm and the methodology is detailed below.
Tracking of cells: The general scheme of the algorithm is shown in Figure 2.3. The image
sequences were analyzed using a customized Matlab (Mathworks, Inc.) program that utilized a particle tracking freeware118 to detect the cells and generate tracks along the patterned line edges. The procedure used to generate tracks has been described in earlier work94. Typical rolling velocity of cells are in the range of 1-10 µm/sec while free flowing cells move close to fluid stream velocity typically >100 µm/sec. We set a tracking criterion that required the cell displacement between consecutive frames to be less than 10 µm. This criterion successfully filtered out the free flowing cells, while conservatively tracking rolling cells successfully. Note that while setting this criterion at a higher value could potentially increase the number of cells tracked (as cells moving with higher velocity will also be tracked), it also increases the chances of spurious tracks as the probability of proximal tracks being getting connected increases. Through a manual trial method we found that setting the search radius of 10 µm gave best result. It was also observed that cells which jumped for a short distance while rolling resulted in the tracks being broken into a number of smaller segments. Thus a second filter was used wherein tracks with total length <40 µm were not included in analysis of the distribution of cell responses, as these short tracks predominantly represented unlinked fragments of a single track and in some cases artifacts on the substrate such as pinholes. Tracks generated by the software were randomly selected and inspected manually by comparing with the images to ascertain their accuracy.
Sorting of Tracks: The patterned edges were identified using the difference in contrast
between the PEG and P-selectin regions as imaged using optical microscopy. The positions of the edges were calculated based on the information of position of one edge, and the geometry of the pattern. Following this, the starting and end point of each track was compared with the edge list and tracks with endpoints within 10 µm of the nearest edge were identified as having encountered an edge. This way, the tracks were sorted into three major classes.
Type ‘A’: Tracks that does not reach the edge.
Type ‘B’: Tracks that reach the edge and also roll on it. Type ‘C’: Tracks of cells only on edge.
Tracks of type ‘A’ and ‘C’ are used only for velocity calculation on the plain surface and edge, while tracks ‘B’ are used for calculating the edge tracking length le , along with
calculating the velocities.
Identification of the portion of a track representing cell rolling along the edge: Two
intersecting straight lines were fitted to every selected track – one aligned with the flow direction and the other aligned with the edge. A constrained error minimization scheme with the slopes of the two lines and the intersection point (Pi) as the fitting parameter was used. While the slopes of the two lines were allowed to vary ±3o from the flow direction and the angle of the pattern, respectively, their intersection point was confined such that the x- and y- coordinates of the intersection point were within the limits of the minimum and maximum values of the x- and y- coordinates of the points on the track. Thus the tracks were subdivided into two segments – one that represented rolling inside the P-selectin line, and another representing rolling on the edge (Figure 2.5, inset).
Extraction of edge tracking length, le: The length travelled along the patterned line edge
was calculated from the distance between Pi and the end of the track. In order to avoid
biasing the population, tracks which were restricted by space (field of view of the camera) or time (tracks that existed before or continued after the image sequence) or tracks which only rolled on the edge without a segment of track on the band (distance between the intersection point Pi and beginning of track <10 µm) were excluded from the
calculation of the average edge tracking length.
Extraction of rolling velocities on the edge and within the P-selectin lines: Velocity was
calculated by choosing two points on the track and dividing the distance between the points by the time taken to traverse them. We observed that the rolling velocity was smaller around Pi when a cell transitioned from rolling within the P-selectin line to
rolling along the edge. We therefore excluded the portion of the track which was within a distance of 10 µm from the predicted Pi for calculation of rolling velocities. Thus, the
starting point and the point located 10 µm before Pi, were used for calculating the rolling
velocity vp within the patterned lines, while the point located 10 µm ahead of Pi and the
end point of the track were used for calculating the velocity ve along the edge of the
patterned lines. Tracks that did not encounter the patterned edge (Type ‘A’ tracks) were used only to calculate vp, while the tracks which were confined only to the edge (Type
‘C’ tracks) were used only for calculating ve, each by taking the ratio of total track length
to the total elapsed time. Thus for each experiment an array of edge tracking length, velocity on edge and velocity on plain region was generated and used for further analysis.
2.2.5 Simulation of Cell Rolling Trajectories.
A Monte Carlo simulation of rolling of cells on a substrate patterned with P-selectin lines with edge inclination angle α was performed by assuming that the cell detachment from the edge followed a Poisson distribution. The value of λ for the Poisson distribution corresponding to the edge inclination angle α was obtained as described in Restults and Discussion. The direction of fluid flow was along the positive x-direction and the cells were assumed to roll on all P-selectin lines that they encountered. For each cell, the edge tracking length was calculated by generating a random number based on the Poisson distribution, and the position of the cell was correspondingly updated. The cell was then assumed to detach and begin rolling on the next downstream edge at the same y-coordinate. This process was repeated with the cell starting at (0, 0) on the first edge, until the x-coordinate of the cell was equal to the travel distance, which yielded a final y-coordinate (net lateral displacement). The above sequence was iterated for 105 cells and the final y-positions of all cells were used to calculate the probability density.
2.3 Results and Discussion
Direct microcontact printing (µCP) of proteins has been used widely to control the geometry of protein patterns on various planar surfaces119-124, including printing of P-selectin to study neutrophil rolling 125. However, it is possible that the protein will denature or lose bioactivity during PDMS stamping steps126. Additionally, transfer of the stamp material (PDMS) from the stamp to the surface during µCP can contaminate the patterned areas127. In the present method, after selective deposition of PEG molecules, the gold substrate is patterned with P-selectin in the solution phase so the possibility of denaturation due to protein drying can be ruled out. AFM images of P-selectin patterned using the small line-patterned stamp (SS) show clearly defined 10 µm-wide lines of P-selectin with well-resolved, straight edges (Figure 2.4(a), (b)). The large line-patterned stamp (LS) was used to prepare surfaces for cell rolling experiments. The sharp contrast between P-selectin regions and PEG regions confirms that the resulting patterns had well-defined edges over large areas as revealed by SEM (Figure 2.4(c), (d)). In addition to this
surface characterization, we observed that HL60 cells exhibited rolling specifically in the P-selectin patterned regions with velocities in a similar range as those reported in other studies94. These results confirm that the PEG-functionalized regions on either side of P-selectin lines could block P-P-selectin adsorption (as expected from the non-fouling property of PEG) and that P-selectin molecules retained their activity after being adsorbed to the exposed gold. In addition, we performed experiments to characterize cell adhesion on PEG surfaces and surfaces coated with BSA, and did not observe any cell-surface interactions, further confirming that the observed interactions were due to P-selectin.
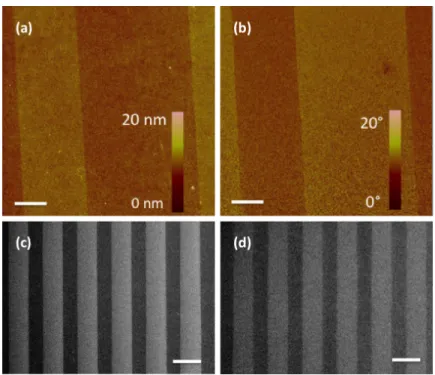
Figure 2.4. Characterization of P-selectin patterned substrates for cell rolling. AFM images of 10 µm wide P-selectin lines separated by 15 µm wide PEG bands (after step 2), displaying the contrast between P-selectin and PEG regions in (a) height and (b) phase, respectively. The phase image indicates a difference between the mechanical properties of the surface in the two regions. SEM images of surfaces after PEG printing (c) (step 1) and after P-selectin adsorption (d) (step 2), respectively, showing uniformity of patterning (brighter areas correspond to PEG regions). Scale bars are 5 µm in (a) and (b) and 100 µm in (c) and (d).
The P-selectin patterned substrates were incorporated into a flow chamber for studying the rolling behavior of HL60 cells at different edge inclination angles and shear stress magnitudes. Figure 2.5 shows an example of tracks obtained from the automated tracking software for an experiments where HL60 cells were flowed over patterns at an edge angle
of 10° and shear stress of 0.5 dyn/cm2 (Movie available at
http://pubs.acs.org/doi/suppl/10.1021/la102871m/suppl_file/la102871m_si_001.qt). 2.3.1 Effect of Edge Angle on the Rolling Behavior of HL60 Cells.
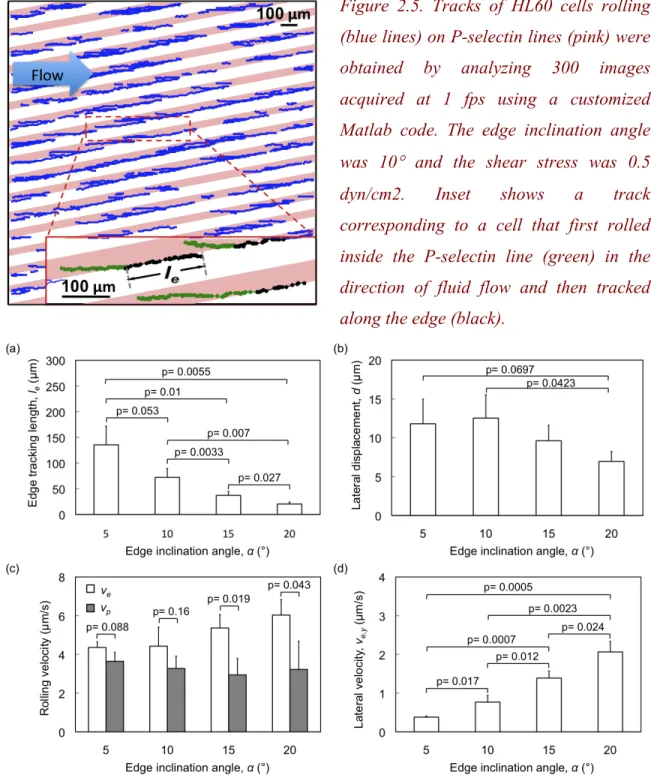
We first examined the effect of the edge inclination angle α subtended by edges of the P-selectin lines with respect to the direction of fluid flow on the edge tracking length le, the lateral displacement d, and the rolling velocities vp an ve, respectively. At α=5º, HL60
cells rolled an average distance of more than 135 µm along the edges before detachment at a shear stress of 0.5 dyn/cm2. Figure 2.6(a) shows that, as the edge angle was increased from 5º to 20º in 5º increments, the average edge tracking length le decreased
significantly (ANOVA, F = 18.403, p = 0.001). In other words, the ability of the cells to roll along the edges was reduced with increasing edge inclination angle (and increasing component of the fluid force on the cell directed away from the edge). Comparison of data pairs (post-hoc t-test) demonstrated statistically significant differences in le for every
5º increase in α. In contrast, Figure 2.6(b) shows that the lateral displacement d = le sinα, did not show a significant trend with increasing α (ANOVA, F = 3.075, p = 0.091), and varied from 7.0 to 12.5 µm over this range of α. However, a statistically significant difference was observed between the lateral displacements at α=10º and 20º (post hoc t-test). This behavior can be understood in that although sinα increases with increasing edge inclination angle, edge tracking length le concomitantly decreases. It is the magnitude of this lateral displacement that is more relevant to separation of cells by rolling on such a patterned substrate.
Figure 2.5. Tracks of HL60 cells rolling (blue lines) on P-selectin lines (pink) were obtained by analyzing 300 images acquired at 1 fps using a customized Matlab code. The edge inclination angle was 10° and the shear stress was 0.5 dyn/cm2. Inset shows a track corresponding to a cell that first rolled inside the P-selectin line (green) in the direction of fluid flow and then tracked along the edge (black).
Figure 2.6. Effect of edge inclination angle α on rolling behavior of HL60 cells at a fluid shear stress magnitude of 0.5 dyn/cm2. Variation of (a) edge tracking length, le; (b) lateral displacement, d; (c) rolling velocities vp and ve within the P-selectin lines and on
the edge, respectively; and (d) lateral velocity, ve,y (component of the edge rolling velocity
in the direction of lateral displacement). Error bars represent one standard deviation, where n = 3 replicate experiments for each condition.
In addition to altering the direction of cell rolling, asymmetric receptor patterns can also alter the rolling velocity of the cells94. To examine the effect of α on rolling velocity, we quantified the average rolling velocity of cells within and along the edges of the P-selectin lines as a function of α at a fixed shear stress magnitude of 0.5 dyn/cm2 (Figure 2.6(c)). The rolling velocity within the P-selectin line was in the range of vp = 2.9 - 3.6 µm/s, and was always less than that along the edge regions (vp = 4.4 - 6.0 µm/s). This can be understood in terms of the expectation that, as α increases, surface area of interaction and adhesion resistance to rolling between the cell and the surface decreases, leading to an increase in rolling velocity. Pairwise (t-test) statistical analyses show a significant increase in ve at large edge angles (15º and 20º) compared to vp, consistent with previous observations94. The average rolling velocity on the edge ve increased from 4.4 µm/s for an edge inclination angle of 5º to 6.0 µm/s at an edge inclination angle of 20º, though this trend did not reach a degree of statistical significance (ANOVA, F = 3.55, p=0.067). In contrast, ve,y (lateral velocity, defined previously as the edge velocity component in the direction of lateral displacement d) increased significantly from 0.4 µm/s to 2.1 µm/s as α increased from 5º to 20º. Thus, receptor patterns characterized by large edge inclination angles (α=15º, 20º) led to greater lateral displacement of cells over a given rolling duration.
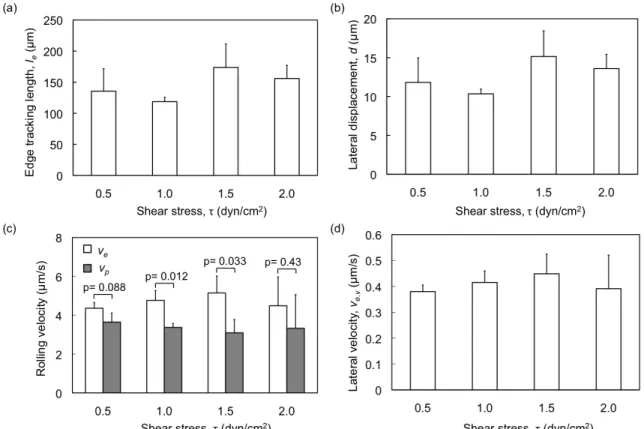
2.3.2 Effect of Shear Stress on Rolling Behavior of HL60 Cells.
We next examined the effect of shear stress (τ= 0.5 dyn/cm2 to 2.0 dyn/cm2) on rolling behavior of HL 60 cells. Figure 6 summarizes the edge tracking length, lateral displacement, and rolling velocity of as a function of the τ at a fixed edge angle of 5º. The edge tracking length le varied in the range of 118.6 - 173.1 µm over τ = 0.5 to 2.0 dyn/cm2. However, there was no statistically significant effect of shear stress on le (ANOVA, F=2.119, p=0.176) (Figure 2.7(a)). The lateral displacement d varied between 10.3 - 15.1 µm, again with no statistically significant dependence on the shear stress (Figure 2.7(b)). Similarly, Figure 2.7(c) shows that the rolling velocity within the P-selectin lines and on the edge also did not vary significantly with shear stress (ANOVA, p=0.917 and p=0.165, respectively). This lack of dependence on shear stress is not
surprising, given that cell rolling involves mechanisms at the cellular and molecular levels to regulate the rolling response over a range of shear stresses128. Similar independence of rolling velocity with shear stress has been observed before in the case of HL60 cells rolling on E-selectin129: the rolling velocity of HL60 cells has been observed to increase with shear stress at low shear stress (τ<0.5 dyn/cm2) and reach a plateau at higher shear stresses. Our experiments indicate that similar to rolling within the P-selectin line, shear stress also does not have a significant effect on the rolling behavior of HL60 cells on asymmetrically patterned edges within τ = 0.5 to 2.0 dyn/cm2.
Figure 2.7. Effect of shear stress τ on rolling behavior of HL60 cells at an edge
inclination angle of 5º. Variation of (a) edge tracking length, le; (b) lateral displacement,
d; (c) rolling velocities vp and ve within the P-selectin lines and on the edge, respectively;
and (d) the lateral rolling velocity, ve,y. Error bars represent one standard deviation,
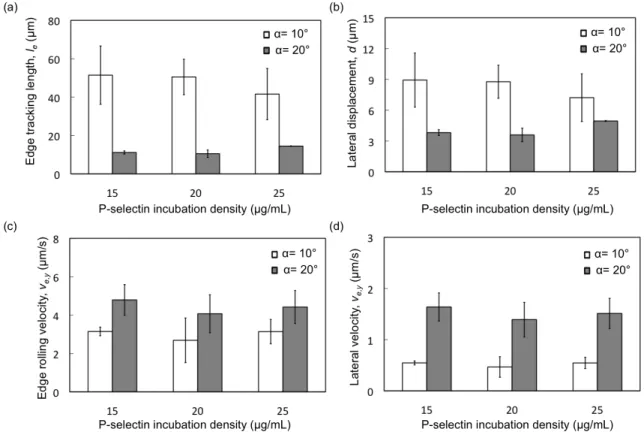
2.3.3 Effect of P-selectin Incubation Density on Rolling Behavior of HL60 Cells. Apart from shear stress and edge inclination angle, the P-selectin density on the surface may be expected to affect the trajectories of cells rolling on the inclined edges. Increasing P-selectin density on microslided surface under high shear stresses (~20 dyn/cm2) resulting in decreasing rolling velocity of HL60 cells has been observed, whereas receptor density has less effect on rolling velocity under low shear stress (< 2 dyn/cm2)116. Particle rolling velocity decreases with increasing E-selectin density at low relative site density and reach a plateau at high relative site density and low shear stress (0.6 dyn/cm2), which suggests that the sensitivity of particle rolling velocity occurs when the site density of E-selectin is low. 100. When the P-selectin incubation density was varied in the range of 5 to 30 µg/mL while maintaining an incubation time of 3 h, we observed a change from no rolling adhesion to robust rolling adhesion around a P-selectin concentration of 15 µg/mL, and then a change from rolling adhesion to slow rolling /firm adhesion around a P-selectin concentration of 30 µg/mL, at a shear stress of 0.5 dyn/cm2. Thus, the useful range of P-selectin incubation concentrations that resulted in a useful rolling response was 15 to 25 µg/mL. We therefore characterized the edge tracking length and cell rolling velocities in this range of P-selectin concentrations. Interestingly, we did not observe a significant change in rolling velocity with change of P-selectin incubation concentration: the average rolling velocities were 3.15±0.23, 2.69±1.16, and 3.14±0.23 for P-selectin concentrations of 15, 20, and 25 µg/mL at edge inclination angle of 10° and 4.79±0.8, 4.07±0.99, and 4.42±0.86 for P-selectin concentrations of 15, 20, and 25 µg/mL at edge inclination angle of 20°, respectively. Similarly, we did not observe significant change in the cell behavior along the edge including edge tracking length le,
lateral deflection d, edge rolling velocity Ve, and lateral velocity Ve.y. These results are in agreement with previous observation of less change in rolling variation with a variation of ligand density under low shear stress (< 2 dyn/cm2) done by Dong et al116. These results indicate that when P-selectin is directly immobilized on a gold substrate, the rolling behavior along the edge cannot be controlled as easily as that by changing the edge inclination angle.