HAL Id: hal-00515013
https://hal.archives-ouvertes.fr/hal-00515013
Submitted on 4 Sep 2010
HAL is a multi-disciplinary open access
archive for the deposit and dissemination of sci-entific research documents, whether they are pub-lished or not. The documents may come from teaching and research institutions in France or
L’archive ouverte pluridisciplinaire HAL, est destinée au dépôt et à la diffusion de documents scientifiques de niveau recherche, publiés ou non, émanant des établissements d’enseignement et de recherche français ou étrangers, des laboratoires
aluminosilicate glass: Classical force-fields vs.
first-principles
Magali Benoit, Patrick Ganster, Jean-Marc Delaye, Walter Kob
To cite this version:
Magali Benoit, Patrick Ganster, Jean-Marc Delaye, Walter Kob. Structural and vibrational properties of a calcium aluminosilicate glass: Classical force-fields vs. first-principles. Molecular Simulation, Taylor & Francis, 2007, 33 (13), pp.1093-1103. �10.1080/08927020701541006�. �hal-00515013�
For Peer Review Only
Structural and vibrational properties of a calcium aluminosilicate glass: Classical force-fields vs.first-principles
Journal: Molecular Simulation/Journal of Experimental Nanoscience Manuscript ID: GMOS-2007-0029.R1
Journal: Molecular Simulation Date Submitted by the
Author: 31-May-2007
Complete List of Authors: Benoit, Magali; CEMES Ganster, Patrick; CRMCN
Delaye, Jean-Marc; CEA, DEN/DTCD/SECM/LCLT Kob, Walter; Universite Montpellier II, LCVN
Keywords: Glasses, molecular dynamics simulations, Car-Parrinello method, calcium aluminosilicate
For Peer Review Only
Molecular Simulation, Vol. 00, No. 00, DD Month 200x, 1–12
Structural and vibrational properties of a calcium aluminosilicate glass: Classical force-fields vs. first-principles.
Patrick Ganster∗, Magali Benoit†, Jean-Marc Delaye‡ and Walter Kob§ ∗CRMCN, Campus de Luminy case 913 - 13288 Marseille cedex 9 † CEMES, 29 rue Jeanne Marvig, BP 94347, 31055 Toulouse Cedex 4 , France
‡ Laboratoire d’´etude du Comportement `a Long Terme,
CEA Valrhˆo, Marcoule, BP 17171, 30207 Bagnols sur C`eze cedex, France
§ Laboratoire des Collo¨ıdes, Verres et Nanomat´eriaux, UMR 5587,
Universit´e Montpellier II, Place E. Bataillon, 34095 Montpellier, France
(Received 00 Month 200x; In final form 00 Month 200x)
Using classical and ab initio molecular-dynamics (MD) simulations, we have studied a calcium aluminosilicate glass of composition (SiO2)0.67-(Al2O3)0.12-(CaO)0.21. Samples with 100 and 200 atoms were generated by classical MD simulations using a potential with
3-body interactions. Although we observe, for the model with 100 atoms, finite size effects for some structural properties, these effects are substantially reduced if the glass structure is refined by the ab initio MD simulations. In addition, some structural characteristics such as the Ca-O bond length and the angular distributions are improved by the ab initio description. The structural and vibrational characteristics of these glass samples are compared to that of a glass that has been quenched from the melt using first-principles simulations. The main differences are found on the SiOSi and SiOAl angular distributions and on the apparition of high-frequency bands in the partial Ca vibrational density of states for the classically generated glass samples.
Keywords: Glasses; molecular dynamics simulations; Car-Parrinello method; calcium aluminosilicate; finite size effects
1 Introduction
Aluminosilicate glasses are ubiquitous materials in nature (volcanic magma) as well as in daily life since they form the basis of most of the industrial glasses (windows, bottles, glass for waste confinement etc.). Nevertheless, the way the macroscopic properties of these systems depends on their microscopic structure is only understood poorly mainly because the experimental determination of the local structure remains a challenging problem due to the lack of positional order.
To date, the calcium aluminosilicate glasses (CAS) are known as being made of silicon and aluminum having a tetrahedral coordination with oxygen atoms (1), the tetrahedra being connected by shared oxygen atoms (named bridging oxygens (BO)) (2). The tetrahedra form a disordered network in which Ca atoms are randomly distributed. Depending on the Al2O3/CaO ratio, the Ca atoms play the role of modifiers if
they create non-bridging oxygen (NBO) by breaking TOT links (T=Si/Al) and/or they play the role of charge balancing, by neutralizing the AlO−4 entities . The viscosity of molten silicates is known to depend strongly on the concentration of the NBO atoms in the system, the latter depending on the Al2O3/CaO ratio (3; 4). For a Al2O3/CaO ratio equal to one, if we suppose that all the Ca atoms are charge balancing
the AlO−4 entities, no NBO atoms should exist and the viscosity should be maximum. However, an excess number of NBO atoms has been found in some aluminosilicate glasses having a Al2O3/CaO ratio equal to
one (5), explaining the observed viscosity anomaly in these systems (3; 4; 6). This excess number of NBO atoms should be related to the existence of other structural units such as oxygen triclusters and/or highly coordinated Si and Al atoms.
The points discussed above raise some questions concerning the structure of the CAS glasses. In such complex glasses, structural information are not easy to extract from experiments because of the lack
∗Corresponding author. Email: [email protected]
Page 1 of 24 1 2 3 4 5 6 7 8 9 10 11 12 13 14 15 16 17 18 19 20 21 22 23 24 25 26 27 28 29 30 31 32 33 34 35 36 37 38 39 40 41 42 43 44 45 46 47 48 49 50 51 52 53 54 55 56 57 58 59 60
For Peer Review Only
of positional order. Computer simulations are therefore very appropriate as an additional tool for the interpretation of experimental data. However in this particular case, computer simulations encounter two kinds of difficulties: (i) In order to properly describe the glassy state, the systems must be large and good statistics is needed which require the use of empirical potentials and classical molecular-dynamics simulations that can be carried out on quite large systems and on long times (7); (ii) For a good description of the chemical bonding (covalent for SiO and AlO, and ionic for CaO), accurate electronic structure calculations have to be used, such as the ones based on Density Functional Theory (DFT), which limits the simulations to small systems because of the high computational cost.
This “dilemma” lead us to pursue a series of studies on the CAS systems in which the glasses are generated in different ways. The composition of the studied glasses (21% CaO - 12% Al2O3 - 67 % SiO2)
was chosen in order to mimic that of the protective layers obtained after the water leaching of the nuclear wastes confinement glasses (8; 9; 10; 11; 12). In Ref. (13), we presented the structural characteristics of a small CAS glass generated with first-principles simulations by quenching from the melt and in Ref. (14), we studied the finite size effects in CAS glasses generated by classical molecular-dynamics using an empirical potential with 2- and 3-body terms. In this later investigation, we observed finite size effects in some of the structural properties of the smallest system made of 100 atoms such as the Si-O, Al-O and Ca-O first neighbor distances, the Si-O-Si and Si-O-Al angular distributions and the nature of the calcium environment.
In this paper, we present the study of the structural properties of CAS glasses that were obtained from classical molecular-dynamics simulations for small systems sizes and that have been subsequently relaxed using ab initio simulations of the Car-Parrinello type (15). This approach has already been successfully used for the study of SiO2 and Na2O-4SiO2 glasses and has proved to be useful for the understanding of
the limits of the classical potentials (16; 17; 18; 19; 20). The structural properties of the glasses as well as their vibrational properties are also compared to those of a CAS glass generated from quench from the melt first-principles simulations (13).
In the present work, we intend to show that the relaxation of a classically-generated glass can substan-tially improve some of the local structural characteristics but that some other properties, in particular the vibrational ones, will keep the ”memory” of the way the glass was generated. This latter fact can become a crucial point, especially in complex system for which the empirical potentials show some limits.
In the next section we give the details of the classical and ab initio simulations, then we present the results on the structural properties of the glasses in the third section and the vibrational properties in the fourth section. A discussion of the results and a conclusion are given in the last section.
2 Glass samples preparation
Two liquids of 100 atoms (samples I and II) and one liquid of 200 atoms (sample III) of composition 21% CaO - 12% Al2O3- 67 % SiO2 (in mole %) were equilibrated at 4200 K during 1.8 ns by means of classical
molecular dynamics simulations using a potential made of 2-body and 3-body interactions (see Ref. (14) for details about these simulations). The liquids were subsequently quenched to 300 K at a rate of 1013
K.s−1and the obtained glasses were simulated in the NVE ensemble at 300 K during 300 ps. In Table
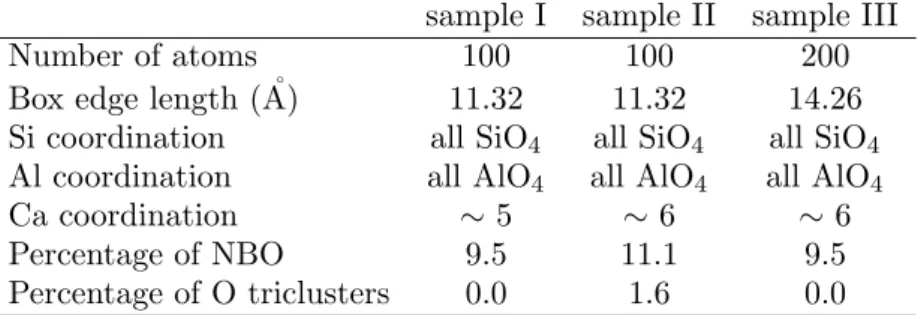
1 we summarize the main structural characteristics of the obtained glass samples, that will be hereafter called ”EP” samples (for Empirical Potential). The NBO atoms are defined as oxygen atoms that are connected to only one network-former atom (Si or Al) and the O triclusters are defined as oxygen atoms that are connected to three network-former atoms. By connected we mean that the distance between the two atoms is less than the location of the first minimum after the corresponding radial distribution function
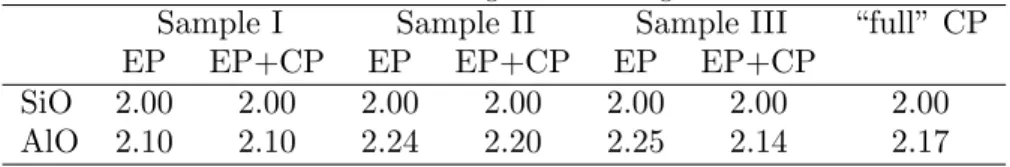
gαβ(r) [ α, β ∈ Si, O, Al, Ca ]. The chosen distance cutoffs used to define the connectivity of the atoms
are given in Tab. 2.
The final coordinates and velocities of these classical simulations were then taken as the initial ones for ab
initio molecular-dynamics simulations of the Car-Parrinello type using the CPMD code (21). Immediately
after the start of the CPMD simulation, we observe a heating of the samples of ≈ 200 K as it is shown in Fig. 1 for one of the 100-atoms system (sample I).
This increase of temperature is the consequence of the modification of the potential when switching
1 2 3 4 5 6 7 8 9 10 11 12 13 14 15 16 17 18 19 20 21 22 23 24 25 26 27 28 29 30 31 32 33 34 35 36 37 38 39 40 41 42 43 44 45 46 47 48 49 50 51 52 53 54 55 56 57 58 59 60
For Peer Review Only
Ganster, Benoit, Delaye and Kob 3
from the classical to the ab initio description. It is remarkable that the relaxation of the positions when the ab initio calculation is started takes only a few MD steps (approximately 80 steps). This procedure was carried out on the two different 100-atoms glasses and on the 200-atoms one. In all three cases, we continued the CP dynamics in the NVE ensemble during ∼ 1 ps using the CPMD code. These samples will hereafter be called ”EP+CP” samples.
In the Car-Parrinello simulations, the electronic structure was described within the framework of den-sity functional theory (22) with the generalized gradient approximation employing the B-LYP functional (23; 24). Core electrons were replaced by a Troullier-Martins pseudopotential for oxygen atoms and by Goedecker-Hartwigsen pseudopotentials for the silicon, aluminum and calcium atoms (25). For the cal-cium, we have taken into account explicitly semi-core electrons. The electronic wavefunctions have been expanded at the Γ point of the supercell on a plane waves basis set with an energy cutoff of 80 Ry. The equations of motion were integrated with a timestep of 0.12 fs and a fictitious electronic mass of 600 a.u. was used.
In addition, these samples have also been compared to another CAS glass sample that has been generated from full ab initio molecular-dynamics simulations, i.e. for which the liquid equilibration at 3000 K and the linear quench at a rate of 3.6 1014 K/s have been performed using the CPMD code instead of the
classical potential described above. This glass has the same composition and the same number of atoms than the 100-atoms samples I and II and its structural characteristics have been published elsewhere (13). The only additional difference between this sample (hereafter called “full” CP) and samples I and II is the density, which is slightly lower in the “full” CP case (2.36 g.cm−3 instead of 2.42 g.cm−3).
After switching on the CP simulations, the Si, Al and O atoms did not show significant displacements neither in the 100-atoms nor in the 200-atoms systems. Thus during the CP simulations, the network connectivity is not changed: The Si and Al coordinations, the number of NBO and oxygen triclusters and the number of linkages are conserved. However, we have noted that the Ca atoms underwent larger displacements during the CP simulations as can be seen from Fig. 2 which shows the squared displacements of each Ca atoms for one of the 100-atoms systems (sample I). From this figure we recognized that the Ca atoms reach equilibrium after 0.3 ps approximately, with a maximum displacement of ≈ 0.6 ˚A2 for one of the calcium atoms. After this time, the squared displacements showed oscillations which indicates that the Ca atoms move in their potential energy wells. A similar behavior was observed in the second 100-atoms sample as well as in the 200-atoms sample.
Once the CP simulation has started, slight structural modifications can be observed in the CAS samples. The major ones are described in the next section and compared to the structural characteristics of the “full CP” sample for the 100-atoms case. We would like to stress the point that the difference in temperature between the EP and EP+CP samples (≈ 180 K) is not sufficient to explain the differences we find in the structural properties. Indeed previous works (16; 17) have already shown that the structural properties of silicates, deep in the glass, are not affected by temperature differences of the order of 100 to 200 K.
In the 100-atoms case, all the structural characteristics presented in the next subsections have been computed by averaging over the two independent samples.
2.1 Radial distribution functions
The partial radial distribution functions (RDF) (26) have been evaluated during the classical MD and the CP simulations for the different samples of 100 and 200 atoms. The results for the SiO, AlO and CaO RDFs are presented in Fig. 3 for the EP 100- and 200-atoms samples (Fig. 3a) and for these samples after the CP relaxation (Fig. 3b).
From Fig. 3a, one can see that the first peak of the SiO RDF has a different shape in the 100 and the 200 atoms samples. In the 100-atoms case, the peak is splitted in two contrary to the 200-atoms case. As a consequence, it is difficult to assign a most probable SiO interatomic distance in the 100-atoms case whereas it can be defined to 1.60 ˚A in the 200-atoms case. These size effects have already been analyzed in a previous work (14) but the interesting point is that they disappear when the system is relaxed in the ab initio description. Indeed, the SiO RDF presented in Fig. 3b no longer presents a double peak in the 100-atoms case. Moreover, for both system sizes, the position of the peak is shifted to 1.63 ˚A in good
Page 3 of 24 1 2 3 4 5 6 7 8 9 10 11 12 13 14 15 16 17 18 19 20 21 22 23 24 25 26 27 28 29 30 31 32 33 34 35 36 37 38 39 40 41 42 43 44 45 46 47 48 49 50 51 52 53 54 55 56 57 58 59 60
For Peer Review Only
agreement with experimental values (1.60 - 1.63 ˚A (27; 28; 29)). The SiO distance is improved by the CP relaxation.
The origin of the double peak in the SiO RDF for the EP 100 atoms glass can be attributed to oxygens involved in the Si-BO-Al and Si-NBO units. Indeed, from Fig. 4a, one can see that the double peak can be decomposed into contributions coming from oxygen atoms involved in Si-NBO and Si-BO-Al for the first peak and from atoms involved in Si-BO-Si for the second peak. The double peak disappears when the Car-Parrinello simulation is switched on, and for the 200-atoms system in the EP and EP+CP cases. In the EP+CP cases, one can see that the difference between the Si-BO-Al and the Si-BO-Si distances is not as important as in the EP case. The existence of the double peak is therefore due to a combined effect of both the small system size and the potential.
The location of the first peak of the AlO RDF (Fig. 3a) is not strongly modified when the CP description is switched on (Fig. 3b), neither in the 100-atoms nor in the 200-atoms cases, but its width is slightly increased. The most probable AlO distance is consequently equal to ≈ 1.77 ˚A for all system sizes in the EP+CP simulations, which is in good agreement with the experimental value lying between 1.72 ˚A and 1.78 ˚A (27; 28; 29; 30).
Finally, in Fig. 3a, one can observe no size effects but compared with Fig. 3b a significant change in the CaO RDF arises: The first peak is substantially moved toward smaller distances in the EP+CP simulation for both system sizes and no double peak exists anymore. We thus estimated the most probable CaO distance to be around 2.34 ˚A for the 100-atoms systems and around 2.36 ˚A for the 200-atoms system. This distance is much smaller than the one extracted from the classical MD simulations (≈ 2.50 ˚A) but in very good agreement with experimental estimates which lie between 2.32 and 2.35 ˚A (28; 29).
The radial distribution functions after the CP relaxation in the 200-atoms case were compared with the ones obtained from the “full” CP sample, see Fig. 5. For the SiO and AlO cases, we clearly see that the RDFs after the CP relaxation show very little difference with the ones obtained from the “full” CP sample, except for a remaining slight finite size effect, the ”full” CP sample containing 100 atoms. The situation is a bit different for the CaO RDF. In this latter case, the CaO RDF first peak presents several small peaks in the EP+CP 200-atoms glass which are not observed in the “full” CP sample. In general, though, a simple CP relaxation at low temperature seems to be able to correct the first neighbor distances, since these ones are very similar to the ones obtained in the “full” CP sample. This result also shows that one can generate a glass using an empirical potential and refine its structure with ab initio calculations, if the only properties of interest are the local structural ones.
In all samples, we tried to evaluate the coordination distributions of the Ca atoms, i.e. the number of oxygen neighbors around the Ca atoms. However given the poor statistics of the CaO RDFs (Fig. 3a), it is very difficult to make a reasonable choice for the cutoff radii and therefore to obtain reliable coordination distributions. Nevertheless we observed a systematic shift of the mean Ca coordination numbers toward smaller values (5 or 6) when the structure is refined by the CP simulations in the 100-atoms systems as well as in the 200-atoms one (not shown). Unfortunately it is rather difficult to obtain from experiments precise values for this coordination number. Values of 4.7 and 5.3 are found from X-ray diffraction (28; 29) which are in agreement with the data obtained after the CP relaxation.
2.2 Angular distributions
The angular distributions have been computed for some of the atomic triplets forming a local neighborhood (SiOSi, SiOAl, AlOAl, OSiO and OAlO). For this we defined two atoms to be neighbors if their distance was less that the location of the minimum in the corresponding partial RDF (values are given in Tab. 2). Figure 6 shows the evolution of the mean values of the SiOSi, SiOAl, OSiO and OAlO angles as a function of time, during the classical MD simulation and the CP simulation, averaged over the two 100-atoms samples. The mean values of OSiO and OAlO angles for the classical simulation are the same as the ones obtained from the ab initio description. A similar behavior of the mean values of the angles upon switching to the CP simulations was observed in the 200-atoms sample (sample III).
In similar studies of SiO2 and NaSi4O8 glasses it has been already observed that the CP description
1 2 3 4 5 6 7 8 9 10 11 12 13 14 15 16 17 18 19 20 21 22 23 24 25 26 27 28 29 30 31 32 33 34 35 36 37 38 39 40 41 42 43 44 45 46 47 48 49 50 51 52 53 54 55 56 57 58 59 60
For Peer Review Only
Ganster, Benoit, Delaye and Kob 5
tends to close the SiOSi angles and consequently to shift the SiOSi distribution to smaller angles (16; 17). In Fig. 6, the phenomenon is observed again since the mean angles for SiOSi and SiOAl decrease by roughly 10◦ as soon as the CP simulation is started.
The modifications of the mean angular values are accompanied by a global modification of the shape of the angular distributions, as it is demonstrated in Fig. 7 for the 100- and 200-atoms samples. For both sizes, the SiOSi and SiOAl angular distributions (Figs. 7b, c, g and h) are both shifted to lower angles due to the CP relaxation in agreement with the results of Fig. 6. In these cases, one can also note that firstly, the distribution is smoothed by the CP simulation and secondly, that it is more probable to find angles smaller than 130◦in the ab initio than in the classical description. Interestingly, the narrow peaks that are
observed in the 100-atoms SiOSi and SiOAl angular distributions, generated by classical MD simulations (Figs. 7b and c), are completely smeared out when the CP description is switched on (Figs. 7g and h). This result corroborates what we found in Ref. (14): The finite size effects observed in the angular distributions for the 100-atoms systems are due to the use of the 3-body potentials. Therefore, the CP simulation is able to reduce quite substantially the finite size effects created by the use of the 3-body potentials in the 100-atoms system case.
The AlOAl angular distribution (Fig. 7a and f) is also quite modified by the CP refinement in the 100-atoms case since the narrow peaks are smoother and broader. These small peaks observed in the EP 100-atoms case are due, for the one part, to the very poor statistics (there are only very few AlOAl triplets in the system) and for the second part, to the fact that these angles are quite constrained in the classical case compared to the CP one. Indeed, such a situation is not observed in the 200-atoms system, even in the EP case, since the AlOAl angles present a broad distribution. Finally we would like to point out that the angular distributions obtained for the EP+CP 200-atoms samples are, within the noise of the data, similar than that obtained for the 100-atoms samples. Thus we can conclude that, for this quantity as well, the CP relaxation is able to remove the finite size effects.
In figure 8, we compare the EP and EP+CP 200-atoms angular distributions to that of the 100-atoms “full” CP and we observe that the SiOSi and SiOAl distributions show quite a different shape: They are shifted to lower angles and are narrower with an asymmetric shape. The main peaks are around 130◦
and 120◦, respectively, with a long tail toward larger angles. The fact that the angular distributions are
peaked at smaller angles can be firstly attributed to the very high quench rate that was used to generate this sample. Indeed it has been found, from classical molecular-dynamics simulations carried out on silica (31; 32), that the use of a high quench rate induces a shift of the SiOSi angular distribution toward smaller angles. However, this shift is of the order of ≈ 5◦ for a quench rate going from 4.44×10¹² K.s−1
to 1.14×10¹⁵ K.s−1. In the present case, the difference between the quench rates is even smaller (1×10¹³
K.s−1 and 3.6×10¹⁴K.s−1). Therefore the difference in shape of the SiOSi and SiOAl angular distributions
is likely not only due to the difference in quench rates but also to the method of preparation, i.e. to the potential used during the liquid equilibration and the quench. Moreover this result is consistent with the fact that the samples generated classically and relaxed with CP exhibit SiOSi and SiOAl angular distributions which are “in between” the classical ones and the “full” CP ones. This means that the CP relaxation tries to lower the SiOSi angles but, because of the too low temperature (around 480 K), can not fully relax the sample structure and as a result the angular distributions are only shifted by ≈ 10◦. The
comparison of the SiOSi and SiOAl angular distributions with experiments is unfortunately not possible since those distributions are not directly accessible. However it is known that the SiOAl angular distribution should be shifted to smaller angles compared to the SiOSi one (33), in agreement with our findings.
In the case of the OSiO and OAlO angular distributions (Figs. 7d, e, i and j), the peaks are not modified except for a slight spreading in the CP cases compared to the classical ones.
2.3 Structure factors
The neutron structure factors Sn(q) were computed using:
Sn(q) = P 1 αNαb2α X αβ bαbβSαβ(q), (1) Page 5 of 24 1 2 3 4 5 6 7 8 9 10 11 12 13 14 15 16 17 18 19 20 21 22 23 24 25 26 27 28 29 30 31 32 33 34 35 36 37 38 39 40 41 42 43 44 45 46 47 48 49 50 51 52 53 54 55 56 57 58 59 60
For Peer Review Only
with Sαβ(q) = fNαβ Nα X l=1 Nβ X m=1 hexp(iq · (rl− rm))i (2)Here q is the scattering vector, N the number of atoms, Nα and Nβ the number of atoms of species α
and β, respectively. The factor fαβ is equal to 0.5 for α 6= β and equal to 1.0 for α = β, bα and bβ are the
neutron scattering lengths of species α and β, and are equal to 4.149, 5.803, 3.449, 4.700 fm for Si, O, Al and Ca (34).
In Ref. (14), we compared the neutron structure factors Sn(q) computed for 100- and 1600-atoms CAS
glasses and found no differences in the peak positions nor in the peaks intensities between the two system sizes. This result indicates that the finite size effects do not affect the Sn(q). In the present study, we have
computed the Sn(q) for the 200-atoms glasses in the classical MD case and after the CP relaxation and
compared the result to the Sn(q) obtained in the “full” CP case (Fig. 9).
From Fig. 9, we can see that the most noticeable effect of the CP relaxation on the structure factor is a slight shift of the third peak toward smaller values of q. This effect is slightly enhanced in the case of the 100-atoms systems (not shown here). This third peak is due to the OO and SiO correlations and a shift of this peak toward smaller values of q implies that the correlations extend over larger distances after the CP relaxation. However the other local structural modifications (bond lengths and angular distributions) due to the CP relaxation are not visible in the structure factors.
The main differences between the 200-atoms Sn(q) and the “full” CP one lie in the first peak. This peak
seems to be shifted toward smaller values of q in the “full” CP case and shows a contribution at ≈ 1.0 ˚
A−1 which is absent in the classical glass after the CP relaxation. However because of the poor statistics
in this q-range (only a few wave-vectors can be used), we can not draw strong conclusion from this result.
3 Vibrational properties
In the classical case, we have computed the vibrational properties of the 100-atoms and 200-atoms samples from an analytical evaluation of the force derivatives.
In the CP case, the dynamical matrices were obtained by evaluating the second derivatives of the total energy with respect to atomic displacements by taking finite differences of the atomic forces. For this, the samples were relaxed to 0 K by a conjugated gradient simulation performed in the ab initio description using the CPMD code, at the end of the CP relaxation. The vibrational frequencies and the corresponding eigenmodes were then obtained by diagonalizing the dynamical matrices.
The classical VDOS for the 100-atoms and 200-atoms samples were found to be very different than that obtained after the CP relaxation and are therefore not shown. Indeed they presented a broad band ranging from 50 to 1100 cm−1and a second small band between 1100 cm−1and 1400 cm−1. The differences between the classical VDOS and the ab initio ones resemble the ones that have been observed on the amorphous silica VDOS in Ref. (19). In that paper, not only the VDOS computed using a classical potential and using
ab initio calculations were different but also the nature of the vibrational eigenmodes. It is very likely that
the same kind of discrepancies are found in the present system. The physical nature of these bands will be discussed where the partial VDOS are presented (Fig. 11).
In Fig. 10 we show the vibrational densities of states (VDOS) for the 100-atoms (dashed line) and the 200-atoms (thin line) systems after the CP relaxation, and for the “full” CP system (bold line) and compared these results with experimental neutron data (circles) from Ref. (35). For the 100-atoms systems the data were averaged over the two samples. In order to compare our results to the neutron data, we have computed for each sample the G(ω), defined as:
G(ω) = C(ω)g(ω),
where g(ω) is the VDOS and the coupling constant C(ω) was computed using the incoherent approximation following Ref. (36). (Note that the calculations were done at 0 K whereas the experiment was made at 300 K.) The functions C(ω) as obtained for the four samples are found to be very similar and the theoretical
1 2 3 4 5 6 7 8 9 10 11 12 13 14 15 16 17 18 19 20 21 22 23 24 25 26 27 28 29 30 31 32 33 34 35 36 37 38 39 40 41 42 43 44 45 46 47 48 49 50 51 52 53 54 55 56 57 58 59 60
For Peer Review Only
Ganster, Benoit, Delaye and Kob 7
G(ω) reproduce the main experimental features quite well, apart from the high frequency modes above
1200 cm−1 which might simply be noise, or be related to impurities in the sample. All three VDOS exhibit
a main band between 50 and 500 cm−1, a second band, less intense, around 700 cm−1 and a third band at higher frequency, between 800 and 1200 cm−1. The main features of these VDOS can be found in a
large variety of silicate glasses, such as the sodo-silicate ones. In particular, the VDOS obtained from very similar simulations carried out by Ispas et al. on a Na2O-4SiO2 glass presented the same features at
the same frequencies (20). Only the gap between the 700 cm−1 band and the other ones seem to be less
pronounced in the CAS glass than in the sodo-silicate one.
Although the total VDOS for the EP+CP samples are very similar, there are, however, small discrep-ancies with that obtained with the “full” CP one. Between 150 and 450 cm−1 the intensity is lower in the “full” CP case, and the maximum of the high frequency band is slightly shifted toward higher frequencies in the EP+CP case for both system sizes. These differences result in a better agreement of the “full” CP sample G(ω) with the experimental one, compared to that of the classically generated samples. Thus the vibrational properties keep the memory of the way the glass was generated, as the angular distributions do (see Sec. 2.2). One could relate this result to the observed effects of the cooling procedure on the Raman spectra of amorphous silica (? ), for instance, which shows that the vibrational properties of the glass have a memory of the glass history. Our findings are also in agreement with the study of Vollmayr et al. who showed by computer simulations that, in amorphous silica, the position of the peak at high frequency shifts to higher frequency when the quench rate is increased (31). Indeed the cooling rate used for the EP+CP samples is one order of magnitude smaller than that used for the “full” CP sample. However, in the present work, too many parameters are different between the compared samples (cooling rate, inter-atomic potential, density ...) which prevents to draw any strong conclusion regarding the reason of the discrepancies between the three G(ω).
It is instructive to compare the partial VDOS which are defined by:
gα(ω) = g(ω)
X
i∈α
|ei(ω)|2
where the {ei} are the 3-components eigenvectors for each atom i of type α. These partial VDOS were
computed for the different atom types in all three samples (Fig. 11): Si, Al, bridging oxygens (BO), non-bridging oxygens (NBO) and Ca. The BO atoms are defined as oxygen atoms connected to two network-former atoms (Si or Al) and the NBO atoms are defined as oxygen atoms connected to only one network-former. The same distance cutoffs as in Sec. 2.2 are used to define the BO and NBO atoms (see Table 2). From Fig. 11, one can see that the main frequency band between 50 and 600 cm−1 is mainly
due to Si, Al, and BO atoms and are related to breathing modes of rings of connected tetrahedra. At low frequency, the contribution of the Ca atoms is also important (between 50 and 400 cm−1 and also at 600 cm−1) and resembles the one found for Na in sodo-silicate in Ref. (20). Finally the high frequency peak is
due to bending and stretching modes involving mainly Si, BO and NBO atoms.
From Fig. 11 we can also conclude that the difference in intensity between 150 and 450 cm−1 can be
attributed to an intensity difference in the BO (Fig. 11c) and NBO (Fig. 11d) partial VDOS. On the other hand, the shift of the high frequency band seems to be due to the difference between the three BO VDOS at high frequency. Also the Si VDOS seems to contribute in that frequency range. The NBO VDOS are also quite different at high frequency however the intensity is much smaller than that of the BO and Si VDOS, therefore their contribution to the total VDOS is not the dominant one.
Finally, the most striking difference between the different samples is detected in the Ca VDOS (Fig. 11e). For this species, a main low frequency band is observed around 150 cm−1 for all samples, which has
a similar origin as the low-frequency band observed in the Na partial VDOS of the Na2O-4SiO2 glass (20). This band has a tail toward high frequencies which, for the “full” CP sample, vanishes at ≈ 400 cm−1. In
contrast to this, all the EP+CP samples (100-atoms and 200-atoms) show an additional peak around ≈ 600-700 cm−1. These relatively high frequency peak for the Ca atoms is quite intriguing since no similar features were found in the Na2O-4SiO2 glass (20).
A more detailed analysis of the eigenmodes corresponding to these double peaks showed that the largest
Page 7 of 24 1 2 3 4 5 6 7 8 9 10 11 12 13 14 15 16 17 18 19 20 21 22 23 24 25 26 27 28 29 30 31 32 33 34 35 36 37 38 39 40 41 42 43 44 45 46 47 48 49 50 51 52 53 54 55 56 57 58 59 60
For Peer Review Only
part of the mode is localized only on one Ca atom in sample I, on two Ca atoms in sample II and on three Ca atoms in sample III (200 atoms). The fact that this peak is absent in the “full” CP sample lead us to analyze the environment of the Ca atoms in all samples. This study showed, however, that there is no particular characteristics that can be clearly attributed to the Ca atoms responsible for these peaks, neither in their oxygen or calcium environments, nor in the CaO bond lengths. The fact that the samples differ by their mass densities is unlikely to be responsible for the difference in the VDOS for Ca, but this mass difference is only of 2.5 %.
In order to explain the existence of this double peak, one therefore should (i) check whether it is systematically present in the CAS glasses generated by classical MD simulations, (ii) check if it is dependent on the quench rate and (iii) find a way to relate its existence to the used empirical potential. However in order to do this, one would have to do extensive new simulations of a large number of samples, with different quench rates, refine them using the CP code and then, compute their vibrational properties from finite differences calculations. This is unfortunately far beyond the scope of the present work because of the large computer resources that would be required. Nevertheless, the fact that this peak is also present in the 200-atoms glass seems to confirm its existence and its relation to the way the glass was generated. And finally, the comparison with the VDOS computed in the Na2O-4SiO2 glass (20) seems to indicate
that this peak is an artifact of the classical MD simulations that the CP refinement is not able to remove.
4 Conclusions
We have studied calcium aluminosilicate glasses by molecular-dynamics simulations using an empirical potential and ab initio calculations of the forces. Systems of 100 and 200 atoms have been generated using an empirical potential made of 2- and 3-body terms and their structures were subsequently refined by ab
initio MD simulations of the Car-Parrinello type. We find that the ab initio refinement not only improves
some of the local structural characteristics (CaO bond length), but also removes the finite size effects observed on the 100-atoms glasses. Therefore the present work gives evidence that the local structure of relatively complex glasses can be studied by the means of ab initio simulations using relatively small samples. Preparing a glass by combining classical and ab initio molecular dynamics allows to obtain a glassy network coherent with the one obtained by a full Car Parrinello calculation. This result is very interesting because the first method is much less time consuming than the second one
Furthermore we have compared the structures of the classically generated glass samples with a glass sample generated by ab initio MD simulations (i.e., the liquid equilibration and the quench were performed using first-principles). Although the bond distances are independent on the way the glasses were generated, the Si-O-Si and Si-O-Al angular distributions are shifted toward smaller angles in the ab initio generated glass sample. These angular shifts could be due to a quench effect because the quench rate is faster by a factor of 36 for the sample prepared by a “full” CP calculation .
Nevertheless, the vibrational properties of a glass prepared by a “full” CP calculation remain better, compared to the experimental one, than that of the sample prepared by classical molecular dynamics and refined by ab initio. In particular, in these last samples, a peak is found at ≈ 600 cm−1 in the Ca partial
VDOS which is absent in the ab initio generated glass. The origin of this peak remains unclear.
In conclusion, the present study shows that (i) a glassy structure coherent with a “full” CP calculation can be obtained much more rapidly by combining classical and ab initio molecular dynamics simulations, (ii) some effects of the empirical potentials are not cured by the ab initio refinement at low temperature, especially for the Ca vibrational modes. The combination of classical molecular dynamics and ab initio refinement is therefore a promising way to prepare good glass samples, with both good structures and good vibrational properties. Obviously, the better the empirical potentials, the better the final glassy samples will be.
Aknowledgements
Calculations have been performed on the IBM/SP4 at CINES (Montpellier) and on the HP AlphaServer SC 45 at CCRT (Bruy`eres le Chˆatel, CEA). Part of this work was supported by the European Community’s Human Potential Program under contract HPRN-CT-2002-00307, DYGLAGEMEM.
1 2 3 4 5 6 7 8 9 10 11 12 13 14 15 16 17 18 19 20 21 22 23 24 25 26 27 28 29 30 31 32 33 34 35 36 37 38 39 40 41 42 43 44 45 46 47 48 49 50 51 52 53 54 55 56 57 58 59 60
For Peer Review Only
REFERENCES 9
References
[1] Z. Wu et al., Phys. Rev. B, 60, 9216 (1999).
[2] B.O. Mysen, Structure and Properties of Silicate Melts (Elsevier, Amsterdam, 1988). [3] M.J. Toplis, D.B. Dingwell and T. Lenci, Geochim. Cosmochim. Acta 61, 2605 (1997). [4] M.J. Toplis and D.B. Dingwell, Geochim. et Cosmochim. Acta 68, 5169 (2004).
[5] J.F. Stebbins and Z. Xu, Letters to Nature, 390, 60 (1997).
[6] M.J. Toplis and D.B. Dingwell, Eos Trans. Am. Geophys. Un. 77, F848 (1996). [7] R. M. Van Ginhoven, H. Jonsson, L.R. Corrales, Phys. Rev. B 71, 024208 (2005). [8] S.-B. Xing, A.C. Buechele and I.L. Pegg, Mat. Res. Soc. Symp. Proc. 333, 541 (1994). [9] J.C. Dran, J.C. Petit and C. Brousse, Nature, 319, 485 (1986).
[10] S. Gin, Mat. Res. Soc. Symp. Proc., 663, 207 (2000).
[11] F. Angeli, T. Charpentier, S. Gin, J.C. Petit, Chem. Phys. Letters 341, 23 (2001). [12] J.A. Tossel and G. Saghi-Szabo, Geochem. Cosmochem. Acta, 61, 1171 (1997).
[13] M. Benoit, M. Profeta, F. Mauri, C.J. Pickard and M.E. Tuckerman, J. Phys. Chem. B 109, 6052 (2005).
[14] P. Ganster, M. Benoit, J.-M. Delaye and W. Kob, J. Chem. Phys 120, 10172 (2004). [15] R. Car and M. Parrinello, Phys. Rev. Letters 55, 2471 (1985).
[16] M. Benoit, S. Ispas, P. Jund and R. Jullien, Euro. Phys. J. B 13 631 (2000). [17] S. Ispas, M. Benoit, P. Jund and R. Jullien, Phys. Rev. B 64, 214206 (2001).
[18] S. Ispas, M. Benoit, P. Jund and R. Jullien, J. Non-Cryst. Sol. 307-310, 946 (2002). [19] M. Benoit and W. Kob, Europhys. Lett. 60, 269 (2002).
[20] S. Ispas, N. Zotov, S. de Wispelaere, and W. Kob, J. Non-Cryst. Solids, in press.
[21] CPMD Version 3.3, J. Hutter, A. Alavi, T. Deutsch, M. Bernasconi, St. Goedecker, D. Marx, M. Tuckerman and M. Parrinello, MPI f¨ur Festk¨orperforschung and IBM Research (1995-99).
[22] P. Hohenberg and W. Kohn, Phys. Rev. 136 B 864 (1964); W. Kohn and L. Sham, Phys. Rev. 140 A 1133 (1965).
[23] A.D. Becke, Phys. Rev. A 38, 3098 (1988).
[24] C. Lee, W. Yang and R.G. Parr, Phys. Rev. B 37, 785 (1988).
[25] S. Goedecker, M. Teter and J. Hutter, Phys. Rev. B 54 1703 (1996); C. Hartwigsen, S. Goedecker and J. Hutter, Phys. Rev. B 58 3641 (1998).
[26] M.P. Allen and D.J. Tildesley, Computer Simulation of Liquids (Oxford University Press, 1989). [27] G.E. Brown, G.V. Gibbs, and P.H. Ribbe, Am. Mineral. 54, 1044 (1969).
[28] V. Petkov, S.J.L. Billinge, S.D. Shastri, and B. Himmel, Phys. Rev. Letters 85, 3436 (2000).
[29] L. Cormier, D. Ghaleb, D.R. Neuville, J.-M. Delaye, G. Calas, J. Non-Cryst. Solids 332, 255 (2003). [30] N. Jiang, J. Qiu, and J.C.H. Spence, Phys. Rev. B 66, 054203 (2002).
[31] K. Vollmayr, W. Kob and K. Binder, Phys. Rev. B 54, 15808 (1996) and references therein. [32] S. Ito, T. Taniguchi, J. of Non-Crystal. Solids 173, 349 (2004).
[33] G.E. Brown, F. Farges and G. Calas, Structure, Dynamics and Properties of Silicate Melts, Ed: J.F. Stebbins, P.F. McMillan and D.B. Dingwell, Reviews in Mineralogy 32 (1995).
[34] www.ncnr.nist.gov/resources/n-lenths/elements/
[35] J. Zhao, P.H. Gaskell, L. Cormier and S.M. Bennington, Physica B 241-243, 906 (1998) [36] S.N. Taraskin and S.R. Elliott, Phys. Rev. B 55, 117 (1997).
Page 9 of 24 1 2 3 4 5 6 7 8 9 10 11 12 13 14 15 16 17 18 19 20 21 22 23 24 25 26 27 28 29 30 31 32 33 34 35 36 37 38 39 40 41 42 43 44 45 46 47 48 49 50 51 52 53 54 55 56 57 58 59 60
For Peer Review Only
Table 1. Structural characteristics of the studied samples.
sample I sample II sample III
Number of atoms 100 100 200
Box edge length ( ˚A) 11.32 11.32 14.26
Si coordination all SiO4 all SiO4 all SiO4
Al coordination all AlO4 all AlO4 all AlO4
Ca coordination ∼ 5 ∼ 6 ∼ 6 Percentage of NBO 9.5 11.1 9.5 Percentage of O triclusters 0.0 1.6 0.0 1 2 3 4 5 6 7 8 9 10 11 12 13 14 15 16 17 18 19 20 21 22 23 24 25 26 27 28 29 30 31 32 33 34 35 36 37 38 39 40 41 42 43 44 45 46 47 48 49 50 51 52 53 54 55 56 57 58 59 60
For Peer Review Only
REFERENCES 11
Table 2. Distance cutoffs used for determining the nearest neighbors.
Sample I Sample II Sample III “full” CP
EP EP+CP EP EP+CP EP EP+CP
SiO 2.00 2.00 2.00 2.00 2.00 2.00 2.00 AlO 2.10 2.10 2.24 2.20 2.25 2.14 2.17 Page 11 of 24 1 2 3 4 5 6 7 8 9 10 11 12 13 14 15 16 17 18 19 20 21 22 23 24 25 26 27 28 29 30 31 32 33 34 35 36 37 38 39 40 41 42 43 44 45 46 47 48 49 50 51 52 53 54 55 56 57 58 59 60
For Peer Review Only
Figure 1. Time evolution of the ionic temperature, defined via the kinetic energy of the atoms, during the classical MD generation of a 100-atoms glass sample (sample I) and the following Car-Parrinello MD simulation (inset).
Figure 2. Evolution of the squared displacement of individual Ca atoms during the CP simulation of a 100-atoms system (sample I). Each line corresponds to the squared displacement of a single Ca atom and the thick line corresponds to the mean squared
displacement of the Ca atoms.
Figure 3. (a): Radial distribution functions SiO, AlO and CaO for the 100-atoms (bold lines) and 200-atoms (dashed lines) glasses in the classical MD case. (b): Radial distribution functions SiO, AlO and CaO for the 100-atoms (bold lines) and 200-atoms (dashed lines)
glasses after the CP relaxation.
Figure 4. Distributions of the SiO distances decomposed in contributions from oxygen atoms involved in the Si-BO-Si, Si-BO-Al and Si-NBO units: (a) EP 100-atoms system, (b) EP+CP 100-atoms system, (c) EP 200-atoms
sytem and (d) EP+CP 200-atoms system.
Figure 5. (a): Radial distribution functions SiO, AlO and CaO of the 200-atoms glasses before (thin lines) and after (dashed lines) the CP relaxation. The bold lines show the same radial distributions functions as obtained from the 100-atoms “full CP” sample. Panels
(b)-(d) show magnifications of the RDF first peaks: (b) SiO, (c) AlO and (d) CaO.
Figure 6. Time evolution of the mean values of the SiOSi, SiOAl, OSiO and OAlO angular distributions during the classical simulation and during the CP simulation, averaged over the two 100-atoms samples.
Figure 7. Upper graphs: Distributions of angles for the 100-atoms (bold lines) and 200-atoms (dashed lines) glasses in the classical MD case: (a) AlOAl, (b) SiOSi, (c) SiOAl, (d) OAlO, and (e) OSiO. Lower graphs: Distributions of angles for the 100-atoms (bold lines)
and 200-atoms (dashed lines) glasses after the CP relaxation : (f) AlOAl, (g) SiOSi, (h) SiOAl, (i) OAlO, and (j) OSiO.
Figure 8. Distributions of angles for the 200-atoms before (thin lines) and after (dashed lines) the CP relaxation and compared to the “full” CP distributions (bold lines): (a) SiOSi, (b) AlOAl, and (c) SiOAl.
1 2 3 4 5 6 7 8 9 10 11 12 13 14 15 16 17 18 19 20 21 22 23 24 25 26 27 28 29 30 31 32 33 34 35 36 37 38 39 40 41 42 43 44 45 46 47 48 49 50 51 52 53 54 55 56 57 58 59 60
For Peer Review Only
REFERENCES 13
Figure 9. Neutron structure factors of the CAS glass for the 200-atoms systems before (bold lines) and after (circles) the CP relaxation and for the “full CP” samples (thin-dashed lines).
Figure 10. Neutron density of states G(ω) for the 100-atoms (thin lines) and 200-atoms (dashed lines) glasses after the CP relaxation and for the “full” CP glass sample (bold lines) compared to neutron experiment data from Ref. (35) that were obtained for a glass of
composition (SiO2)0.43-(CaO)0.43-(Al2O3)0.14.
Figure 11. Total and partial vibrational density of states for the 100-atoms (thin lines) and 200-atoms (dashed lines) glasses after the CP relaxation and for the “full” CP glass sample (bold lines).
Page 13 of 24 1 2 3 4 5 6 7 8 9 10 11 12 13 14 15 16 17 18 19 20 21 22 23 24 25 26 27 28 29 30 31 32 33 34 35 36 37 38 39 40 41 42 43 44 45 46 47 48 49 50 51 52 53 54 55 56 57 58 59 60