HAL Id: hal-03010318
https://hal.archives-ouvertes.fr/hal-03010318
Submitted on 25 Nov 2020
HAL is a multi-disciplinary open access archive for the deposit and dissemination of sci-entific research documents, whether they are pub-lished or not. The documents may come from teaching and research institutions in France or abroad, or from public or private research centers.
L’archive ouverte pluridisciplinaire HAL, est destinée au dépôt et à la diffusion de documents scientifiques de niveau recherche, publiés ou non, émanant des établissements d’enseignement et de recherche français ou étrangers, des laboratoires publics ou privés.
Investigation of organic precursors and plasma mixtures
allowing control of carbon passivation when etching
HgCdTe in hydrocarbon-based inductively coupled
plasmas
Jordan Piet, Wilfrid Faider, Aurélie Girard, François Boulard, Christophe
Cardinaud
To cite this version:
Jordan Piet, Wilfrid Faider, Aurélie Girard, François Boulard, Christophe Cardinaud. Investigation of organic precursors and plasma mixtures allowing control of carbon passivation when etching HgCdTe in hydrocarbon-based inductively coupled plasmas. Journal of Vacuum Science and Technology A, American Vacuum Society, 2020, 38 (5), pp.053005. �10.1116/6.0000397�. �hal-03010318�
Investigation of organic precursors and plasma
mixtures allowing control of carbon passivation
when etching HgCdTe in hydrocarbon-based
inductively coupled plasmas
Running title: a concise title Running Authors: Piet et al.
J. Piet 1, W. Faider 1, A. Girard 1, F. Boulard 2, C. Cardinaud 1,a)
1Université de Nantes, CNRS, Institut des Matériaux Jean Rouxel, IMN, F‐44000 Nantes, France 2Univ. Grenoble Alpes, CEA, LETI, F-38000 Grenoble, France
a) Electronic mail: christophe.cardinaud@cnrs-imn.fr
The interest of introducing oxygen and/or nitrogen atoms in CH4/H2/Ar plasma mixtures,
by means of organic precursors in the place of CH4 or by partly substituting O2 or N2O for
H2 and thereby control carbon deposition and surface passivation when etching HgCdTe
under low substrate bias conditions is investigated. Using in situ ellipsometry, in situ x-ray photoelectron spectroscopy, atomic force microscopy and secondary electron microscopy, we show that nitromethane as precursor and N2O substitution are attractive alternatives:
absence of deposition although no bias is applied, equivalent post-etch surface composition and for the latter comparable performances in terms of etch rate and surface roughness. Such approach could provide the soft dry etching conditions needed to reduce the pixel pitch of HgCdTe infrared photovoltaic detectors. The mechanisms that allow suppressing carbon deposition upon O2 or N2O substitution in CH4/H2/Ar plasmas is studied by
combining plasma diagnostics (optical emission spectroscopy and actinometry, ion flux measurements) and surface characterisations. Firstly, using Si as a reference substrate, it is shown that deposition is suppressed whenever the O2 and N2O flow rate is half and twice
This is the author’s peer reviewed, accepted manuscript. However, the online version of record will be different from this version once it has been copyedited and typeset.
that of CH4 respectively. Moreover the study reveals that oxygen is the true etch reactant
controlling the competition between film growth and etching in both substituted processes, whereas incorporation of nitrogen in the film upon N2O substitution favours
simultaneously its etching kinetics. Secondly, on HgCdTe, deposition of a hydrocarbonitride film is observed at low N2O/CH4 ratio (~0.6). SEM and SEM-EDS
imaging suggest that the film nucleates and grows preferentially on regions where the Cd removal mechanisms happens to be less efficient. At high N2O/CH4 ratio (~4), oxidation
of the HgCdTe surface is observed.
I. INTRODUCTION
The II-VI compound Mercury Cadmium Telluride (Hg(1-x)CdxTe) is widely used
for fabrication of high performance infrared photovoltaic detector due to a bandgap tunability achieved by varying the cadmium content of the alloy1,2. Thus, it covers a wide
spectral range from near to far infrared (0.8 – 30 µm). The other important advantages of this compound are a high absorption coefficient, a great mobility and a long lifetime of carriers as well as a fast response time3. At last one can also point out the nearly invariant
lattice parameter with composition (0.2% from CdTe to HgTe), which allows to epitaxy heterostructures addressing multi spectral ranges. Fabrication of a detector matrix requires etching steps in the form of deep trenches or low aspect ratio holes, to respectively define the pixel’s dimension and pitch and to open the material for electrical contacts4,5. In both
This is the author’s peer reviewed, accepted manuscript. However, the online version of record will be different from this version once it has been copyedited and typeset.
cases etching can induce damages at the surface and even into the material. The most frequent concern the degradation of the electrical properties, the change of composition, the development of surface roughness and presence of process residues. The latter two complicate the deposition of electrical passivation layers and the making of electrical contacts.
Dry etching of HgCdTe is mainly performed with CH4/H2/Ar plasmas. Although
some parts of the etching mechanism are still not thoroughly interpreted, past studies and literature data converge on the fact that the methyl group CH3 allows to form the volatile
product Cd(CH3)2, Te desorbs from surface due to formation of TeH2 and Te(CH3)2 and
Hg desorbs spontaneously due to its high vapour pressure6,7. During the etching, a
sufficient substrate bias is necessary to provide to the ion bombardment the required energy capable to prevent or remove carbon deposition at the bottom of the etched feature8, while
at the pattern sidewall, carbon species can contribute to the etching anisotropy through the formation of a passivation layer. The CH4/H2 ratio is an important parameter of the
plasma-material interaction mechanism. On the one hand, the greater this ratio, the larger the bias threshold between carbon film deposition and material etching8 and thus the larger the bias
to be applied, with potential damage to the material8,9,10,11. On the other hand the larger this
ratio, the less disequilibrium between the removal mechanism of the HgTe fraction of the material and that of the CdTe fraction7 and the better chance to limit Hg depletion from the
surface layer. Besides, the etched surface is generally reported to be rough and, in relation to the etch mechanism, plasmas rich in H2 were observed to cause significantly rougher
surfaces than plasmas with large CH4/H2 ratios10,11. The origin being attributed to carbon
deposition6,12, residues rich in Cd13 or formation of a porous surface layer7. Literature
This is the author’s peer reviewed, accepted manuscript. However, the online version of record will be different from this version once it has been copyedited and typeset.
reports a few studies carried out to minimize these defects. Most notably, N2 and Ar have
been added to CH4/H2 plasma to improve surface aspect and roughness14. This
improvement is associated with the reduction of the hydrogen concentration, as H is consumed to form NH314. An increase of CH3 concentration is also observed with presence
of N2 in the mixture14,15. Other works investigated O2 addition to avoid polymer deposition
for InP etching16,17. In conclusion the etching mechanism of HgCdTe in CH4/H2/Ar plasma
obeys to an ion assisted chemical etching mechanism, as introduced by Coburn and Winters in the late 1970s18,19,20,21 for the etching of Si based materials in fluorine plasmas22 and
verified since in a very large number of systems. In addition, the mechanism faces a situation of competition between etching and deposition as in fluorocarbon plasmas with the complication of a fragile ternary material and a strong requirement to limit plasma-induced damage, in particular with respect to ion bombardment.
Here we report on the interest of replacing CH4 by other organic precursors whose
chemical formula contains oxygen and nitrogen atoms or by adding N2O or O2 to a
CH4/H2/Ar plasma. Purpose is to progress in the understanding of the impact of changing
the precursor or the plasma chemistry on the plasma-surface interaction mechanism and notably for etching HgCdTe without carbon residues even at low or without substrate bias. In a first step, we used in situ ellipsometry to study the hydrocarbon film deposition produced on silicon by various organic precursors capable to etch HgCdTe and the removal of this deposit in an oxidizing plasma, described hereinafter as sample cleaning. Then, we analysed the composition of the plasma produced with the most interesting mixtures by optical emission spectroscopy (OES), in addition the total flux of positive ions was measured using a home-made capacitive planar probe23,24, which design is inspired from
This is the author’s peer reviewed, accepted manuscript. However, the online version of record will be different from this version once it has been copyedited and typeset.
the work of Braithwaite25. Electron density and temperature were estimated using a
cylindrical Langmuir probe. Finally, we etched HgCdTe samples for several precursor flow rates; overall surface composition was characterised thanks to in situ x-ray photoelectron spectroscopy (XPS). And it is worth to point out or recall that the pioneer work of J. Coburn in the use of in situ surface analysis for the understanding plasma or ion surface interaction mechanisms26. Secondary electron microscopy (SEM) and energy dispersive x-ray
spectroscopy (SEM-EDS) imaging allowed to probe the surface topography and surface chemical homogeneity in the micrometre scale range respectively and surface roughness was measured by atomic force microscopy (AFM).
II. EXPERIMENTAL SET UP AND METHODOLOGY
The etching vessel used in the study associates an inductively coupled plasma (ICP) source and a diffusion chamber in which the sample holder is located. The ICP source is composed of a 185 mm in diameter alumina tube surrounded by a circular antenna connected to a RF generator (13.56 MHz). The sample holder, located 240 mm below the plane of the source antenna, is biased using a variable power supply at 13.56 MHz. The substrate self-bias enables to control the ion energy independently from the production of the plasma. The sample holder receives Si wafers 100 mm in diameter that are clamped mechanically via an anodised aluminum ring. A cryostat ensures the temperature regulation of the sample holder, heat exchange between the wafer and the holder is obtained by a 10 mbar He static pressure at the wafer backside; in the present study temperature regulation was fixed to 20°C. Typical plasma process conditions are 1000 W for the source power, 4 mTorr of total pressure, 10 min of exposure time, no bias is applied to the sample holder
This is the author’s peer reviewed, accepted manuscript. However, the online version of record will be different from this version once it has been copyedited and typeset.
unless indicated. Gas mixture, which is the main variable experimental parameter is indicated along the text. Plasma cleaning conditions are carried out in O2/Ar (40/20) sccm
mixture, or N2O/Ar (40/20) in the case of the N2O additive, at 1000 W source power and 4
mTorr total pressure, no bias is applied to the Si sample holder.
The OES measurements are carried out with a Jobin-Yvon iHR 550 monochromator that is fitted with a 1800 gr/mm holographic grating blazed for 250 nm. The light signal is measured with a CCD Open Electrode 1024x256 pixels from Synapse that enables to cover a 22 nm spectral range with a nominal resolution of 0.06 nm. The characteristic spectra are recorded with an exposure time of 0.1 s and a slot opening of 20 µm. The evolution of relative concentration of the species is monitored by using the 8% Ar present in the gas mixture as an actinometer, through the emission line at 750.4 nm.
The carbon film deposition and subsequent sample cleaning study is carried out with an in situ multi wavelengths ellipsometer M44 from Woollam Co. Measurement is carried out every 2.4 s. The model used to analyse the experimental data is composed of three layers: a Si bulk layer for the substrate, a SiO2 layer to model the substrate initial
native oxide as well as the Si oxidation after the sample cleaning. For both materials, optical parameters are taken from the WVase software library. The third layer is the deposition layer whose composition is unknown and represented by a Cauchy model. For each deposition condition, the Cauchy parameters are adjusted considering the data acquired during a period of time of 2 min (corresponding to 50 measurements) after the end of the deposition sequence when the layer is the thickest; the parameters are then taken fixed when analysing the complete set of temporal experimental data for this deposition condition. Comparing the values of the Cauchy parameters from one precursor to another
This is the author’s peer reviewed, accepted manuscript. However, the online version of record will be different from this version once it has been copyedited and typeset.
and when using additives, we did not observe very significant variations. The experiments are carried out one after the other, each deposition being followed by an oxydising plasma for cleaning. The evaluation of the silicon oxidation, and therefore the SiO2 thickness, is
fulfilled after each cleaning in order to adjust the model before a new deposition measurement.
The Hg(1−x)CdxTe layers (x = 0.2) used in this work are grown by liquid phase
epitaxy on (111)-oriented CdZnTe substrates27,28. Before use the HgCdTe wafer is etched
in a Br2/methanol solution; this allows to remove about 1 µm out of the 8 µm thick HgCdTe
layer and ensures to carry on the experiments on a reproducible material surface. The wafers are then cut into 1 cm² samples and experiments are carried out on samples from the same wafer. These samples are fixed onto the Si wafer using a thermal paste (HTCP from Electrolube) at the back of the sample, which ensures a good thermal contact.
The sample surface is analysed by quasi in situ X-ray photoelectron spectroscopy, using a Phoibos HR150 analyser and a Focus500 monochromator from Specs GmbH. Transfer sequence is as follows. After the process the plasma vessel is pumped down to its nominal base pressure (5E-7 mbar) then the sample is transferred to a buffer chamber (base pressure 5E-9 mbar), in a third step the sample is transferred to the XPS chamber (base pressure 1E-9 mbar); this procedure prevents the XPS from a direct connection with the plasma vessel and allows to maintain vacuum and surfaces as clean as possible. Spectrum emission is achieved with a monochromatic AlKα at 1486.74 eV powered at 400 W (15 kV, 27 mA). Survey spectra and narrow spectra are recorded with a pass energy of 30 and 14 eV and an energy step of 0.5 and 0.025 eV respectively; the latter combination giving an experimental spectral width at half maximum of 0.51 eV on Ag3d5/2. The XPS
This is the author’s peer reviewed, accepted manuscript. However, the online version of record will be different from this version once it has been copyedited and typeset.
measurement angle with respect to the sample surface normal is 0°, the angle between the X-ray and the analyser is 60°. Data treatment was carried out with Casa XPS29.
The etch rate is measured on patterned samples with a Veeco Dektak 8 profilometer. Atomic force microscopy is used to characterise the surface roughness and morphology. The equipment used is a Nano Wizard 3 from JPK Instruments with a tip PPP-NCHR-50b from Nanosensors with a radius of curvature less than 7 nm. Scanning is carried out in intermittent contact mode, the scan is 10x10 µm2. SEM and SEM-EDS
imaging are carried out with JEOL JSM 7600F and 5800LV instruments respectively and operated at 5 kV, no metallization is necessary prior to the analysis.
III. STUDY OF VARIOUS PRECURSORS AND ADDITIVES
A. Choice of precursors
Precursors are chosen according to their predisposition to produce CH3 radicals
upon dissociation and according to their vapour pressure. An additional selection is made by studying the time required to etch in the oxygen plasma the carbonaceous film previously deposited in the process plasma (precursor/H2/Ar mixture) at various precursor
flow rates. Experiments are carried out by monitoring the deposition and the cleaning sequences using in situ ellipsometry on a silicon wafer. The same procedure is used when O2 or N2O are partly substituted for H2 in the CH4-H2-Ar mixture. In such case the cleaning
is carried out in O2/Ar or N2O/Ar respectively.
Figure 1 reports the evolution of the ratio between the oxygen plasma cleaning time and the plasma process time in a precursor/H2/Ar mixture as a function of the precursor
This is the author’s peer reviewed, accepted manuscript. However, the online version of record will be different from this version once it has been copyedited and typeset.
flow, for the precursors methane, ethane, methanol, ethanol, acetone, isopropanol and nitromethane. Results show that clean time/process time ratio (Tc/Tp) for methanol is smaller than for methane; in the case of nitromethane the ratio is even null since no deposition occurs and all other precursors tested show larger Tc/Tp values. This leads to select methanol or nitromethane as organic precursor alternative to methane.
Figure 1: Ratio between the oxygen plasma cleaning time and the plasma process time in a precursor/H2/Ar mixture (X/(55-X)/5 sccm) as a function of the precursor flow, for the precursors methane () and ethane () methanol (⧫), ethanol (), acetone (), isopropanol () and nitromethane ().
Figure 2 presents the evolution of the deposition rate and Tc/Tp ratio versus the O2
or N2O flow rate as these gases are partly substituted to H2 in CH4/H2/Ar mixtures. One
can observe that when O2 is introduced into the CH4/H2/Ar mixture the deposition rate
decreases. For 10 sccm of CH4, 4 sccm of O2 are necessary to reach a deposition rate of
zero. Replacing O2 by N2O brings a different result. At low N2O flow rates deposition rate
increases when increasing the N2O flow rate. A maximum deposition rate is observed at 5
0 5 10 15 20 0.0 0.2 0.4 0.6 0.8 CH3NO2 CH3COCH3 CH3OH CH3CH(OH)CH3 CH3CH2OH C2H6 Cl ean Ti me / Process Time
Precursor flow rate (sccm) CH4
This is the author’s peer reviewed, accepted manuscript. However, the online version of record will be different from this version once it has been copyedited and typeset.
sccm, beyond which the deposition rate decreases. 18 sccm of N2O is necessary to avoid
deposition. Thus introducing small amounts of N2O to a CH4/H2/Ar plasma favours the
growth of a hydrocarbon film on the Si wafer. Introducing 4 sccm of O2 or 18 sccm of N2O
allow respectively to suppress deposition and therefore validates the concept of O2 or N2O
partial substitution for H2 to suppress deposition. Above 4 sccm O2 or 18 sccm N2O the
“deposition rate” observed is attributed to the oxidation of the Si substrate. Comparing the Tc/Tp ratio for the CH4/H2/Ar situation (i.e. no additives) one observes values of 0.2 and
0.5 when the O2/Ar plasma (Figure 2-a) and N2O/Ar plasma (Figure 2-b) are used for
cleaning respectively. This puts forward the better cleaning efficiency of the former.
This is the author’s peer reviewed, accepted manuscript. However, the online version of record will be different from this version once it has been copyedited and typeset.
Figure 2: Deposition rate and Tc/Tp ratio versus O2 and N2O flow rate in (a) a CH4/O2/H2/Ar and (b) a CH4/N2O/H2/Ar plasma. Gas mixture is 10/Y/(45-Y)/5 sccm.
B. Plasma study
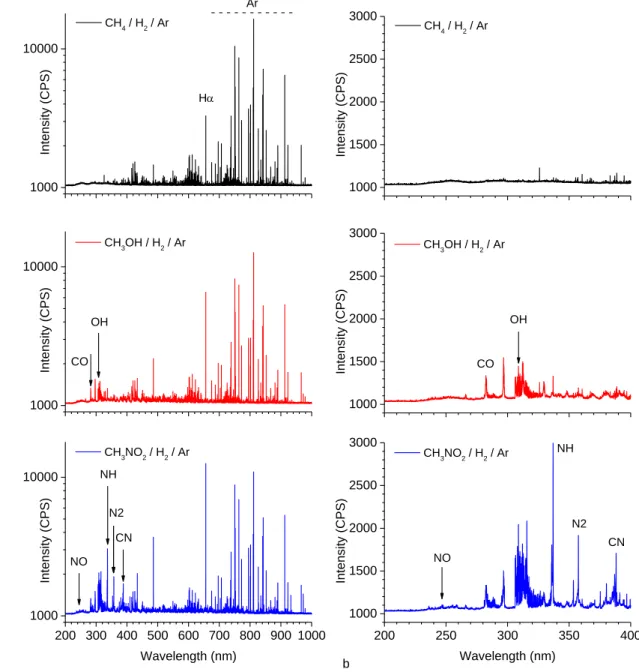
Figure 3 compares typical plasma emission spectra using methane, methanol and nitromethane precursors. When O2 and N2O are partly substituted for H2 inCH4/H2/Ar, the
plasma emission is similar to that of methanol and nitromethane, respectively. For the first
0 2 4 6 8 0 1 2 3 4 5 Deposition rate Tc / Tp O2 flow rate (sccm) Dep ositio n rat e (nm /m in) 0.00 0.05 0.10 0.15 0.20 Cl ean time / Process t ime Si oxidation a Deposition rate Tc / Tp 0 5 10 15 20 25 0 5 10 15 Si oxidation N2O flow rate (sccm) Deposition rate (nm/ min) b 0.0 0.5 1.0 1.5 Clean time / Proce ss time
This is the author’s peer reviewed, accepted manuscript. However, the online version of record will be different from this version once it has been copyedited and typeset.
mixture, characteristics lines of argon and hydrogen are principally detected. We also note that we do not detect the characteristic band of CH* at 431.2 nm, which suggests that hydrocarbon radicals produced upon dissociation of the precursors react rapidly with other reagents, including the surface of the vessel, to form various compounds. Thereafter, we will mainly focus on Hα and Ar* lines at 656.3 nm and 750.4 nm respectively. When oxygen is present is the mixture, i.e. when using methanol or with the substitution of O2
for H2, the characteristic line and bands of O*, although very weak in the case of methanol,
CO* and OH* appear. In the case of CH3NO2/H2/Ar and CH4/N2O/H2/Ar, introducing
nitrogen induces the appearance of additional bands characteristic of N2*, NO*, NH* and
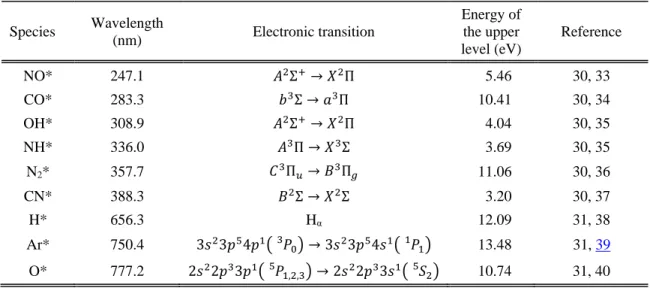
CN*, which again indicates that numerous recombination pathways exist from precursor dissociation products and reactions with the vessel walls. The species studied subsequently by pseudo-actinometry are presented in Table 1. In the presentation hereinafter, to lighten the text we will call X* the actinometry ratios X*/Ar* (where X = CO, CN, O, Hα, NH, OH). The correct denomination is however kept in the Figures.
This is the author’s peer reviewed, accepted manuscript. However, the online version of record will be different from this version once it has been copyedited and typeset.
Figure 3: Typical optical emission spectra of CH4/H2/Ar, CH3OH/H2/Ar, CH3NO2/H2/Ar plasmas obtained at 1000 W excitation power, 4 mTorr pressure, gas mixture is 8.5/46.5/5 sccm. Whole UV-vis. spectral range (a), blow up on the 200-400 nm range (b). Spectra are not corrected from the optical response of the measuring chain (fiber, monochromator, detector). 1000 10000 Intensity ( CP S) CH4 / H2 / Ar Ar 1000 10000 CO CH3OH / H2 / Ar Intensity ( CP S) H OH 200 300 400 500 600 700 800 900 1000 1000 10000 NO CH3NO2 / H2 / Ar Intensity ( CP S) Wavelength (nm) CN N2 NH 1000 1500 2000 2500 3000 Intensity ( CP S) CH4 / H2 / Ar 1000 1500 2000 2500 3000 CO CH3OH / H2 / Ar Intensity ( CP S) OH 200 250 300 350 400 1000 1500 2000 2500 3000 b NO CH3NO2 / H2 / Ar Intensity ( CP S) Wavelength (nm) CN N2 NH
This is the author’s peer reviewed, accepted manuscript. However, the online version of record will be different from this version once it has been copyedited and typeset.
Table 1: Plasma species studied by optical emission spectroscopy. Species Wavelength (nm) Electronic transition Energy of the upper level (eV) Reference NO* 247.1 𝐴2Σ+→ 𝑋2Π 5.46 30, 33 CO* 283.3 𝑏3Σ → 𝑎3Π 10.41 30, 34 OH* 308.9 𝐴2Σ+→ 𝑋2Π 4.04 30, 35 NH* 336.0 𝐴3Π → 𝑋3Σ 3.69 30, 35 N2* 357.7 𝐶3Π𝑢→ 𝐵3Π𝑔 11.06 30, 36 CN* 388.3 𝐵2Σ → 𝑋2Σ 3.20 30, 37 H* 656.3 Hα 12.09 31, 38 Ar* 750.4 3𝑠23𝑝54𝑝1( 𝑃 0 3 ) → 3𝑠23𝑝54𝑠1( 𝑃 1 1 ) 13.48 31, 39 O* 777.2 2𝑠22𝑝33𝑝1( 𝑃 1,2,3 5 ) → 2𝑠22𝑝33𝑠1( 𝑆 2 5 ) 10.74 31, 40
From Table 1 on can see that the energy required to excite NO, NH, OH and CN species to the transition upper level (from 3.20 to 5.46 eV) is much smaller than that required to excite Ar, H, O atoms and CO (from 10.41 to 13.48 eV). Therefore the evolution of the intensity ratios presented below in Figure 4 and Figure 5 versus the N2O and O2 flow
rate could be affected if the electron temperature changes along with this variable. Some electrical measurement (not shown) were carried out in methane, methanol and nitromethane based plasmas using a cylindrical Langmuir probe. No significant variation of electron temperature is observed when varying the precursor flow rate between 4 to 25 sccm, with typical values of 2.9 ± 0.04 eV, 2.7 ± 0.1 eV and 3.0 ± 0.15 eV for methane, methanol and nitromethane precursors respectively. Such experiments could not be carried out when O2 and N2O are partly substituted for hydrogen. However the close values
observed when changing the precursor (2.9, 2.7 and 3.0 eV) and the very close overall composition of the input gas mixture comparing on one hand CH4(10)/O2(Y)/H2
(45-Y)/Ar(5) with CH3OH(X)/H2(55-X)/Ar(5) and on another hand CH4(10)/N2O(Y)/H2
(45-This is the author’s peer reviewed, accepted manuscript. However, the online version of record will be different from this version once it has been copyedited and typeset.
Y)/Ar(5) with CH3NO2(X)/H2(55-X)/Ar(5) as X varies from 4 to 25 sccm and Y from 0 to
20 sccm make us believe that the electron temperature is likely to be weakly affected when varying the O2 and N2O flow rate within the investigated range. Under this assumption the
evolution of intensity ratios reported in Figure 4 and Figure 5 should quite reasonably represent the evolution of the species density ratios.
For methanol and nitromethane precursors, intensity of the new characteristic lines and bands, i.e. O*, OH*, CO* for the former and the same plus N2*, NH* and CN* for the
latter, increases typically linearly as the amount of precursor is increased in the gas mixture (not shown). When substituting O2 or N2O the situation is quite different as shown in Figure
4 and Figure 5. In the CH4/O2/H2/Ar plasma the CO* and Hα emission first increase sharply upon incorporation of O2 to the gas phase (Figure 4-a); but a saturation is observed above
5 sccm of O2, which corresponds typically to the amount of O2 needed to suppress carbon
deposition onto the Si wafer. Opposite the constant increase of O* and OH* bands indicates a constant rise of production of atomic oxygen and reaction products (OH, H2O) between
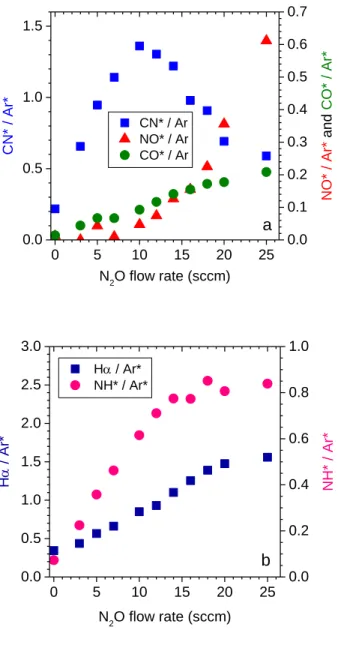
oxygen and hydrogen or hydrocarbon radicals. In the CH4/N2O/H2/Ar plasma the CN*
emission increases sharply from 0 to 10 sccm N2O before decreasing (Figure 5-a).
Meanwhile the NO* emission first remains low before rising significantly. Our interpretation is that the formation of cyanyl is first limited by the amount of N2O
incorporated in the gas mixture (Y < 10) and then limited by the amount of CH4 (Y >10).
The transition between these two regimes takes place typically as the amount of N2O equals
that of CH4. The NH* emission increases up to 12 sccm of N2O and then saturates (Figure
5-b); this saturation could be related to the fact that the addition of N2O is made to the
detriment of the H2 flow. The intensity of the Hα line follows a similar evolution.
This is the author’s peer reviewed, accepted manuscript. However, the online version of record will be different from this version once it has been copyedited and typeset.
Moreover, the intensity of the emission of O* line, OH* and N2* bands increases linearly
with the flow of N2O; the formation of these species is therefore not affected by the reaction
kinetics involving CN (Figure 5-c). The continuous increase in the intensity of the CO* band indicates that, in the range studied, the formation of this molecule is globally proportional to the number of oxygen atoms brought by N2O.
0 5 10 15 20 25 0.0 0.1 0.2 0.3 0.4 0.5 0.6 0.7 CO* / Ar* H / Ar* O2 flow rate (sccm) CO* / Ar* a 0.0 0.5 1.0 1.5 2.0 2.5 3.0 H / Ar* 0 5 10 15 20 25 0.0 0.1 0.2 0.3 0.4 0.5 0.6 0.7 OH* / Ar* O* / Ar* O2 flow rate (sccm) O* / Ar* and OH* / Ar* b
This is the author’s peer reviewed, accepted manuscript. However, the online version of record will be different from this version once it has been copyedited and typeset.
Figure 4: Evolution of the actinometry ratios X*/Ar* for (a) X* = CO*, H* and (b) X* = OH* and O* when varying the amount of O2 in CH4/O2/H2/Ar (10/Y/45-Y/5 sccm) mixture. 0 5 10 15 20 25 0.0 0.5 1.0 1.5 CN* / Ar NO* / Ar CO* / Ar N2O flow rate (sccm) CN * / Ar* 0.0 0.1 0.2 0.3 0.4 0.5 0.6 0.7 NO* / Ar* and CO* / Ar* a 0 5 10 15 20 25 0.0 0.5 1.0 1.5 2.0 2.5 3.0 H / Ar* NH* / Ar* N 2O flow rate (sccm) H / Ar* b 0.0 0.2 0.4 0.6 0.8 1.0 NH * / Ar*
This is the author’s peer reviewed, accepted manuscript. However, the online version of record will be different from this version once it has been copyedited and typeset.
Figure 5: Evolution of the actinometry ratios X*/Ar* for (a) X* = CN*, NO, CO*, (b) X* = NH*, H* and (c) X* = OH* and O* when varying the amount of N2O in CH4/N2O/H2/Ar (10/Y/45-Y/5 sccm) mixture.
Ion flux measurements (not shown) reveal that whatever the precursor and whatever the flow rate within the investigated range, the flux of positive ions remains typically alike. This important result points out that, at constant substrate bias, changing the precursor between methane, methanol, or nitromethane does not affect the energy flux brought to the surface by the ion bombardment i.e. the physical contribution to the plasma surface interaction mechanism. Still, similarly to what is generally observed when varying the gas mixture15,41,42,43, the ion composition may evolve when changing the precursor, but such
changes will contribute to the chemical part of the interaction mechanism. Therefore any change in the deposition mechanism on the Si wafer is likely to be due to a change in the overall chemical composition of the plasma.
0 5 10 15 20 25 0.0 0.1 0.2 0.3 0.4 0.5 0.6 0.7 OH* / Ar* O* / Ar N2* / Ar* N2O flow rate (sccm) O* / Ar* and OH* / Ar* c 0.0 0.5 1.0 1.5 2.0 2.5 N2 * / Ar*
This is the author’s peer reviewed, accepted manuscript. However, the online version of record will be different from this version once it has been copyedited and typeset.
C. Surface analysis of the film deposited at low amount of O
2and N
2O additives
The carbonaceous film deposited onto the Si wafer in CH4/H2/Ar plasma and when
substituting in part O2 or N2O for H2 has been analysed by means of in situ XPS.
Survey scan results (not shown) can be resumed as follows. As expected the spectrum for the deposit formed in CH4/H2/Ar shows only a carbon signature with the C1s
core level at ~284.8 eV. With the introduction of 2 sccm of O2 into the gas mixture, the
analysis reveals the presence of oxygen in the layer deposited in CH4/O2/H2/Ar plasma, as
shown by the O1s core level at ~532.4 eV. Yet the amount is small as quantification gives only ~8 atom% (Table 2). Finally, incorporation of 5 sccm N2O produces a C(H)Nx layer
containing ~8% O, 28% N and 64% C (Table 2), with an additional signal N1s signal at ~398.7 eV.
High resolution spectra of the C1s and N1s core levels are shown in Figure 6 and curve fitting results are presented in Table 2. This detailed analysis confirms that oxygen is only a minor element in the film produced in CH4/O2/H2/Ar (Figure 6-b). For the film
deposited in CH4/N2O/H2/Ar both the C1s and N1s spectra show evidence of various
chemical environments involving carbon and nitrogen atoms in the film network (Figure 6c, 6d). Following literature data44,45,46,47, the C1s components can be tentatively ascribed
to C(sp2)-N: 285.9 eV, C(sp3)-N, C=N and N-C(sp2)-N: 287.3 eV and CN (cyano group): 288.7 eV. In the same way we propose the following assignment, N-C: 400.1 eV, N=C and CN (cyano): 398.9 eV and N-H: 397.8 eV, for the N1s components. Concerning oxygen, once again it appears as a minor element in the film composition.
This is the author’s peer reviewed, accepted manuscript. However, the online version of record will be different from this version once it has been copyedited and typeset.
292 290 288 286 284 282 280 0 2000 4000 6000 8000 10000 Intensity (CPS )
Binding energy (eV)
CH4/H2/ Ar a 292 290 288 286 284 282 280 0 2000 4000 6000 8000 10000 Intensity (CPS )
Binding energy (eV)
CH4/O2/H2/Ar C-C, C-H C-O b 292 290 288 286 284 282 280 0 1000 2000 3000 4000 Intensity (CPS )
Binding energy (eV)
CH4/N2O/H2/Ar C-C, C-H C(sp2)-N C(sp2)=N, C(sp3)-N CN c
This is the author’s peer reviewed, accepted manuscript. However, the online version of record will be different from this version once it has been copyedited and typeset.
Figure 6: C 1s (a, b, c) and N1s (d) spectra of the layers deposited on Si in (a) CH4/H2/Ar, (b) CH4/O2 (2 sccm) /H2/Ar and (c, d) CH4/N2O (5 sccm) /H2/Ar plasmas.
Table 2: In situ XPS quantification and spectrum curve fitting results for the layers deposited in CH4/H2/Ar, CH4/O2 (2 sccm) /H2/Ar and CH4/N2O (5 sccm) /H2/Ar plasmas.
C1s O1s N1s Species C-C, C-H C-O C-N C=N CN O-C N-H N=C N-C CH 4 /H 2 /Ar Atom % 100 - - BE (eV) 284.8 - - - - FWHM (eV) 1.81 - - - - Fraction (%) 100 - - - - CH 4 /O 2 / H2 /Ar Atom % 92 8 - BE (eV) 284.8 286.8 - - 532.4 - - - FWHM (eV) 1.85 2.40 - - 2.39 - - - 404 402 400 398 396 394 392 0 1000 2000 Intensity (CPS )
Binding energy (eV)
CH4/N2O/H2/Ar N=C, CN N-C N-H
d
This is the author’s peer reviewed, accepted manuscript. However, the online version of record will be different from this version once it has been copyedited and typeset.
Fraction (%) 93 7 - - 100 - - - CH 4 /N 2 O/H 2 / Ar Atom % 64 8 28 BE (eV) 284.7 285.9 287.3 288.7 531.5 397.8 398.9 400.1 FWHM (eV) 1.89 1.99 2.02 1.81 2.66 1.99 1.83 2.02 Fraction (%) 16 47 27 10 100 9 32 59
D. Discussion on the role of the additives with respect to film
deposition
The Tc/Tp ratio evolves as the deposition rate for the CH4/O2/H2/Ar plasma (Figure
2-a). The process time (Tp) being fixed for all experiments, this “proportional regime” corresponds to a situation in which the cleaning time is proportional to layer thickness i.e. the clean rate is also constant. Therefore the presence of O2 in the gas mixture introduces
an etching mechanism competing with the deposition mechanism.
In the case of the CH4/N2O/H2/Ar plasma the Tc/Tp ratio is typically constant for
low N2O flux and becomes “proportional” to the deposition rate above 12 sccm of N2O
(Figure 2-b). Since the process time is fixed, a constant Tc/Tp ratio in the first regime means a constant clean time, whatever the thickness deposited. This suggests that introducing small amounts (Y < 12) of N2O in the gas mixture has an important impact on
the layer composition and structure, but unfortunately we do not have XPS analyses of the film for other mixtures than 5 sccm N2O. However the comparison of the deposition rate
with the OES CN* emission gives an interesting perception of the dominant mechanism (Figure 7). First, the deposition rate increases together with the amount of CN species formed in the plasma. Second, the N2O flow rate where the CN concentration starts to
decrease is also typically the point where the Tc/Tp ratio stops to be constant and becomes proportional to the deposition rate.
This is the author’s peer reviewed, accepted manuscript. However, the online version of record will be different from this version once it has been copyedited and typeset.
Our interpretation is the following: The nitrogen species incorporated in the gas mixture by N2O favour the formation of a carbonaceous film onto the Si wafer. However
film composition and structure evolve in such a way as the amount of N2O is increased that
its further etching in an oxidising plasma is eased and most likely the higher the proportion of nitrogen in the film the more easy the etching. Since oxygen atoms are introduced simultaneously in the gas mixture, the film growth mechanism is in constant competition with an etching mechanism. This second one takes over gradually as Y > 7 sccm, as supported by the decrease of the deposition rate from this point, which is accompanied by the rise of the NO* and CO* (Figure 5-a). At Y = 12 the deposition rate has fall back to its initial value when no N2O is substituted (Y=0), this means that in relation to the proportion
of methane in the mixture, the opposite effects of nitrogen and oxygen are balanced. And the film deposited at higher N2O behaves like those deposited with O2. Finally oxygen
atoms appear as being the true etch reactant, whereas incorporation of nitrogen in the film favours its etching kinetics.
Deposition rate CN emission Tc / Tp 0 5 10 15 20 25 0 5 10 15 N 2O flow rate (sccm) Deposition rate (nm/ min) 0.0 0.5 1.0 1.5 CN*/Ar* and Tc / T p
This is the author’s peer reviewed, accepted manuscript. However, the online version of record will be different from this version once it has been copyedited and typeset.
Figure 7: Deposition rate, clean time / process time ratio and CN*/Ar* ratio versus the N2O flow rate in a CH4/N2O/H2/Ar plasma. Gas mixture is 10/Y/(45-Y)/5 sccm.
IV. INTEREST FOR HgCdTe ETCHING
A. Comparison of precursors
Interest of methanol and nitromethane precursors or partial substitution of N2O for
H2 in CH4/H2/Ar mixture for the etching of HgCdTe at low bias and potentially with low
carbon contamination is investigated. Substitution of O2 is not studied. HgCdTe samples
are etched at a pressure of 4 mTorr and a source power of 1000 W. A substrate bias is necessary with the CH4/H2/Ar and CH3OH/H2/Ar plasmas in order to avoid carbon
deposition and ensure the etching; bias power of 50 W and 10 W are chosen respectively. No substrate bias is applied with the nitromethane precursor or with incorporation of N2O.
For the latter case, following the data presented in Figure 2 the amount of N2O is fixed as
twice that of methane.
Table 3 collects typical data for the etch rate and surface roughness and presents typical AFM and SEM images. The etch rate is larger with the methanol precursor than with any other precursor, but the average roughness is also significantly greater; this observation led us not to further develop studies with this precursor. Looking at nitromethane precursor and incorporation of N2O to CH4/H2/Ar, it comes out that etching
HgCdTe without bias is possible with these two mixtures and the etch rate for the latter case is only 25% less than with the methane precursor, with a comparable average roughness. Another observation is the presence of small bumps on the surface etched in
This is the author’s peer reviewed, accepted manuscript. However, the online version of record will be different from this version once it has been copyedited and typeset.
CH4/H2/Ar as seen on the AFM and SEM images. These bumps are not observed when
replacing methane by nitromethane or using CH4/N2O/H2/Ar.
Table 3: AFM image, average roughness and SEM image after etching in CH4/H2/Ar, CH3OH/H2/Ar, CH3NO2/H2/Ar and CH4/N2O/H2/Ar plasmas.
Gas mixture CH4 / H2 / Ar CH3OH / H2 / Ar CH3NO2 / H2 / Ar CH4 / N2O / H2 / Ar Bias power (W) 50 10 0 0 Etch rate (nm/min) 77 ± 8 116 ± 10 19 ± 2 58 ± 6 AFM images Average roughness (nm) 14 ± 1 21 ± 1 18 ± 1 12 ± 1 SEM images
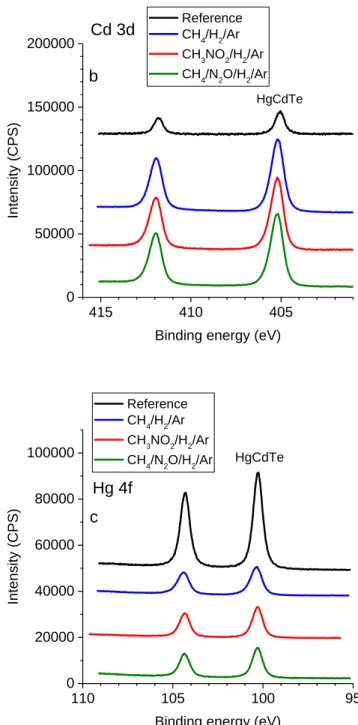
In situ XPS analysis were carried out on sample etched in CH4/H2/Ar, CH3NO2/H2/Ar and CH4/N2O/H2/Ar plasmas and compared to the reference material
before etching. Results from high resolution spectra are presented in Figure 8 and Table 4.
2 µm 2 µm 2 µm 2 µm
This is the author’s peer reviewed, accepted manuscript. However, the online version of record will be different from this version once it has been copyedited and typeset.
The reference sample presents Te3d, Cd3d and Hg4f core level spectra characteristic of the HgCdTe material48,49. However the surface presents slight
contributions from TeO2 (Te3d5/2 at 576.3 eV)49 and Te0 (elemental Te, Te3d5/2 at 573.4
eV)50,51. Presence of Te0 on the surface results from the sample cleaning procedure
involving Br2/methanol wet etching51,52. For the three precursors, analysis after etching
reveals only one contribution corresponding to the HgCdTe material (Figure 8 and Table 4). In particular no Te oxide component nor Te0 component are observable. Two significant
differences with respect to the reference material are noticed: the first is the increase of the intensity of the Cd signal, accompanied by the decrease of the Hg signal, which is the signature of the depletion in mercury in the surface layer. The second is an increase of the spectral widths (FWHM) that can be interpreted as due to the surface amorphisation and disorganisation caused by the etching mechanism (Table 4).
a Reference CH4/H2/Ar CH3NO2/H2/Ar CH4/N2O/H2/Ar Te 3d 590 585 580 575 570 565 0 50000 100000 150000 200000 250000 300000 Intensity (CPS )
Binding energy (eV)
HgCdTe
oxide Te0
This is the author’s peer reviewed, accepted manuscript. However, the online version of record will be different from this version once it has been copyedited and typeset.
Figure 8: Te3d (a), Cd3d (b) and Hg4f (c) spectra for the HgCdTe samples etched in CH4/H2/Ar, CH3NO2/H2/Ar and CH4/N2O/H2/Ar plasmas.
Reference CH4/H2/Ar CH3NO2/H2/Ar CH4/N2O/H2/Ar Cd 3d 415 410 405 0 50000 100000 150000 200000 HgCdTe b Intensity (CPS )
Binding energy (eV)
HgCdTe Reference CH4/H2/Ar CH3NO2/H2/Ar CH4/N2O/H2/Ar Hg 4f 110 105 100 95 0 20000 40000 60000 80000 100000 Intensity (CPS )
Binding energy (eV) c
This is the author’s peer reviewed, accepted manuscript. However, the online version of record will be different from this version once it has been copyedited and typeset.
Table 4: In situ XPS spectrum curve fitting results for HgCdTe reference and samples etched in CH4/H2/Ar, CH3NO2/H2/Ar and CH4/N2O/H2/Ar plasmas.
Te3d5/2 Cd3d3/2 Hg4f7/2 Species HgCdTe element oxide HgCdTe HgCdTe
Reference Atom % (HgCdTe) 70 6 24 BE (eV) 572.6 573.4 576.3 405.1 100.3 FWHM (eV) 0.99 0.78 0.99 0.64 0.66 Fraction % 82 15 2 100 100 CH4/H2/Ar 50 W bias Atom % (HgCdTe) 53 37 10 BE (eV) 572.5 - - 405.2 100.4 FWHM (eV) 1.09 - - 0.85 0.77 CH3NO2/H2/Ar No bias Atom % (HgCdTe) 52 32 16 BE (eV) 572.6 - - 405.2 100.3 FWHM (eV) 1.02 - - 0.85 0.70 CH4/N2O/H2/Ar No bias Atom % (HgCdTe) 57 36 7 BE (eV) 572.6 - - 405.2 100.3 FWHM (eV) 1.04 - - 0.86 0.69
B. Effect of N
2O in the CH
4/N
2O/H
2/Ar mixture
In the comparison presented above, the amount of N2O substituted to H2
CH4/N2O/H2/Ar was adjusted according to the deposition rate results obtained on Si to
suppress deposition. To complete this study we carried out etching experiments on HgCdTe samples for the following three characteristic conditions: 5sccm, 17sccm, 35sccm of N2O,
which correspond on the Si wafer to, the larger deposition rate, the suppression of the deposition and a clearly non depositing regime respectively.
SEM and SEM-EDS images of HgCdTe samples are presented in Table 5. At 5 sccm N2O, the SEM image shows large patches on the surface. To these patches
corresponds high intensity domains in the carbon (C Kα line) and cadmium (Cd Lα1,2 line)
This is the author’s peer reviewed, accepted manuscript. However, the online version of record will be different from this version once it has been copyedited and typeset.
energy filtered images and low intensity domains in the mercury image (Hg Mα1 line)
whereas the tellurium image (Te Lα1,2 line) is rather homogeneous. Therefore at low N2O
flow rate the natural propensity for the plasma to produce deposition also occurs on the HgCdTe surface, although the mechanism is more balanced towards etching since the film is discontinuous. The correspondence between domains “rich in Cd” and “rich in C” suggest a correlation with the Cd removal mechanisms that involves CHx species and the
formation of Cd(CH3)2 as etch product. Our interpretation is that regions were, whatever
the reason, the Cd removal mechanisms happens to be less efficient, the subsequent local accumulation of C(N)Hx species act as seeds for the growth of a carbonaceous film. The 17 sccm N2O flow rate condition shows homogeneous SEM-EDS images that indicate that
the deposition/etching balance is definitely on the etching side. Finally at 35 sccm N2O,
the energy filtered images show a homogeneous intensity, which indicates a homogeneous composition; but the SEM image clearly shows some structuration of the surface in the form of a (pale gray) overlayer above the (darker) underlying material.
This is the author’s peer reviewed, accepted manuscript. However, the online version of record will be different from this version once it has been copyedited and typeset.
Table 5: SEM and SEM-EDS images of HgCdTe samples etched in CH4/N2O/H2/Ar for 5, 17 and 35 sccm of N2O. N2O flow rate (sccm) 5 17 35 SEM image SEM -ED S ener gy filtered images C Kα line Cd Lα1,2 line Te Lα1,2 line Hg Mα1 line
In situ XPS analysis results are presented in Figure 9. At 5 sccm N2O, the signal for the HgCdTe core levels (Te3d, Cd3d and Hg4f) is characteristic of the etched material, in terms of position and shape (FWHM data are given in each figure). However the most important fact is the observation of a significant carbon contribution as evidenced by the
500 nm 500 nm 500 nm
500 nm 500 nm 500 nm
500 nm 500 nm 500 nm
500 nm 500 nm 500 nm
500 nm 500 nm 500 nm
This is the author’s peer reviewed, accepted manuscript. However, the online version of record will be different from this version once it has been copyedited and typeset.
C1s signal. Furthermore the observation of the N1s core level (see Cd3d spectrum) and the evidence of more than one carbon environment are a strong indication that this carbon layer contains CNx groups. Considering the curve fitting analysis, the main C1s component falls at ~ 286.3 eV and the two minor ones at 287.7 eV and 289.3 eV, which is about 1.6 eV greater than the nominal position for C-C/C-H species (284.7 eV) and CNx species (285.9 for C-N and 287.3 for C=N as identified in Table 2) respectively. In relative accordance the same observation can be made for the N1s spectra with the major component at 401.0 eV and the minor at 399.8 eV i.e. 0.9 eV greater than nominal position for N-C (400.1 eV) and N=C (398.9 eV) (Table 2). Our conclusion is that the patches observed on the SEM image correspond to the hydrocarbonitride XPS signal. The discrepancy with the nominal binding energy positions can be attributed to a specific charging effect as this layer is most probably not in good electrical contact with the HgCdTe sample. Since the layer is not “infinite” in thickness no reliable quantification of the layer composition can be made by XPS. The presence of this layer attenuates the signal coming from the HgCdTe material, this is the reason why the intensity of the Te3d, Cd3d and Hg4f is significantly lower as compared to the 17 sccm case that we will present now. At 17 sccm N2O the Cd3d, Te3d
and Hg4f core levels spectra again are characteristic of the HgCdTe material. The carbon signal is negligible, therefore the inhibition effect concerning the carbon deposition observed on the Si wafer when introducing 17 sccm of N2O in the gas mixture is also
efficient on the HgCdTe surface. The absence of carbon layer can be correlated with the homogeneity of the SEM and SEM-EDS images. At 35 sccm N2O the surface is free of
carbon (not shown), but the main change with respect to the 17 sccm case is the presence of additional components on the Te3d and Cd3d spectra. These new components are
This is the author’s peer reviewed, accepted manuscript. However, the online version of record will be different from this version once it has been copyedited and typeset.
located at 576.7 eV and 578.1 eV (Te3d5/2) and 406.5 eV (Cd3d5/2). The first corresponds to Te oxide in the TeO2 environment48,49. To this component one can associate the O1s
component at 530.9 eV48,52, a binding energy position characteristic for metal oxides53. The
second Te3d and O1s component and that of Cd3d are shifted by 1.3 eV from the first or from the Cd(HgCdTe) component respectively. Cadmium oxides49,50,54 and Hg oxides54
present very limited chemical shifts (< 0.5 eV) with respect to HgCdTe. Therefore CdO or HgO species, corresponding to the Te oxide and the O1s component at 530.9 eV could exist under the same envelope as the Cd(HgCdTe) contribution48, in the same way CdOH
could produce the O1s component at 533.8 eV; however the FWHM of the Cd3d and Hg4f spectra showing no significant widening with respect to the 17sccm case, the existence of such species remain a hypothesis. We interpret the second group of peaks including the Te3d5/2 at 578.1 eV, the Cd3d5/2 at 406.5 and the O1s at 535.3 eV, which are all shifted from the nominal oxide positions, to oxide species (TeO2 and CdO) shifted by differential
surface electrical charging. We envisage the possibility that such species correspond to the (pale grey) regions observed on the SEM image. In any case the XPS analysis shows that introducing in the gas mixture more N2O than necessary leads to the oxidation of the
material surface and some surface structuration.
This is the author’s peer reviewed, accepted manuscript. However, the online version of record will be different from this version once it has been copyedited and typeset.
50000 100000 HgCdTe 5 sccm Te 3d FWHM 1.1 eV 1.0 eV 1.3 eV 50000 100000 oxides 17 sccm Intensity (CPS ) 595 590 585 580 575 570 565 50000 100000 35 sccm oxide oxide (2)
Binding energy (eV)
0 20000 40000 60000 FWHM 0.90 eV 0.88 eV 0.91 eV HgCdTe 5 sccm N-C N=C Cd 3d 0 20000 40000 60000 N 1s 17 sccm Intensity (CPS ) 415 410 405 400 0 20000 40000 60000 oxides 35 sccm oxide (2)
Binding energy (eV)
This is the author’s peer reviewed, accepted manuscript. However, the online version of record will be different from this version once it has been copyedited and typeset.
5000 10000 15000 HgCdTe 5 sccm Hg 4f 5000 10000 15000 FWHM 0.76 eV 0.70 eV 0.71 eV 17 sccm Intensity (CPS ) 105 100 5000 10000 15000 35 sccm
Binding energy (eV)
5000 10000 15000 20000 Intensity ( CP S) 5 sccm C-C / C-H C-N C=N C 1s 290 285 280 5000 10000 15000 20000 17 sccm
Binding energy (eV)
540 535 530 525 15000 20000 25000 30000 35000 O 1s 35 sccm oxide oxide (2) OH? Int ensi ty (CPS )
Binding energy (eV)
This is the author’s peer reviewed, accepted manuscript. However, the online version of record will be different from this version once it has been copyedited and typeset.
Figure 9: Analysis of HgCdTe samples etched in CH4/N2O/H2/Ar for 5, 17 and 35 sccm of N2O: Te3d, Cd3d, Hg4f, C1s and O1s spectral regions. Each region containing more than one spectrum presents the equivalent number of ordinate scales, alternatively on the left and right axis; all scales are the same, only one is labelled to lighten the figure.
V. SUMMARY AND CONCLUSIONS
The interest of introducing oxygen and/or nitrogen atoms in CH4/H2/Ar plasma
mixtures to control carbon deposition and surface passivation when etching HgCdTe under low substrate bias conditions has been investigated. This was carried out either by replacing methane by other organic precursors or by substituting in part O2 or N2O for hydrogen. The
study (in situ ellipsometry) of the carbon deposition onto Si, without bias, and the subsequent cleaning sequence lead to select methanol and nitromethane as alternative precursors and to determine the necessary amount of O2 (half that of CH4) or N2O (twice
that of CH4) substituent to be used in CH4/H2/Ar mixture to suppress deposition. Optical
emission spectroscopy brought information on the change in the plasma chemical species. Considering the invariance of the ion flux measurements with the change of precursor, we concluded that any modification in the plasma-surface interaction mechanisms would be uniquely due to the change in the chemical composition of the plasma.
Using the OES data and in situ XPS analysis results, the role of the substituents with respect to film deposition and composition was investigated. We concluded that O2
induces an etching mechanism that directly competes with the deposition mechanism. Opposite, N2O contributes to the film growth in correlation with formation of CN plasma
species, as shown by the presence of nitrogen in the film in the form of various CNx species. However this growth mechanisms is in competition with the etching mechanisms
This is the author’s peer reviewed, accepted manuscript. However, the online version of record will be different from this version once it has been copyedited and typeset.
induced by the oxygen atoms brought by the substituent and the final dominant mechanism depends on the N2O/CH4 ratio. Comparing the subsequent etching sequences of the carbon
film we come to the conclusion that oxygen atoms appear as the true etch reactant, during the deposition and cleaning sequences and for both substituents, and that incorporation of nitrogen in the film grown in CH4/N2O/H2/Ar plasma favours its etching kinetics.
On HgCdTe demonstration is made that etching without sample bias is possible by using nitromethane as precursor or in CH4/N2O/H2/Ar mixtures (at a N2O/CH4 ratio = 2),
with a significant advantage for the latter with respect to the former concerning etch rate (~60 nm/min vs ~20 nm/min) and surface roughness (12 nm vs 18 nm). In situ XPS analysis shows that surface composition is very similar when comparing CH4/H2/Ar (50 W bias
power), CH3NO2/H2/Ar and CH4/N2O/H2/Ar plasma processes. In line with the study onto
Si, deposition in the form of a hydrocarbonitride is observed onto HgCdTe at low N2O/CH4
ratio (i.e. ~ 0.6). Moreover SEM and SEM-EDS imaging suggest that the film nucleates and grows preferentially on regions where the Cd removal mechanisms happens to be less efficient. Opposite, at high N2O/CH4 ratio (i.e. ~ 4), oxidation of the HgCdTe surface is
observed.
In terms of application, the CH4/N2O/H2/Ar mixture has the advantage, compared
to the CH3NO2/H2/Ar mixture, of allowing fine adjustment of the amount of "carbon
deposition inhibitor" introduced into the process. Tuning the plasma chemistry and the substrate bias, one can think about obtaining an efficient etching with low surface roughness, no residues nor oxidation under low ion energy on surfaces strongly exposed to the ion bombardment (hole and trench bottom) while controlling deposition/passivation on the surfaces weakly exposed to the ion bombardment (typically feature sidewalls).
This is the author’s peer reviewed, accepted manuscript. However, the online version of record will be different from this version once it has been copyedited and typeset.
Applying these findings to HgCdTe patterning could provide the soft dry etching needed to reduce the pixel pitch of infrared photovoltaic detectors.
No conclusion can be drawn between O2 and N2O addition as regards HgCdTe etching
ACKNOWLEDGMENTS
The authors acknowledge the French Ministry of Defence, Délégation Générale de l’Armement and the Région Pays de la Loire for financing a PhD grant.
1G.L.Hansen, J.L. Schmidt, and T.N. Casselman, J. Appl. Phys. 153, 7099 (2007). 2
A. Rogalski, Infrared Phys. & Technol. 50, 240 (2007).
3
M.A. Kinch, State of the art infrared detector technology, (SPIE Press, 2014).
4J. Baylet, et al. J. Electron. Mater. 35(6), 1153 (2006). 5
E.P.G. Smith et al. J. Electron. Mater. 35(6), 1145 (2006).
64
C.R. Eddy, D. Leonhardt, V.A. Shamamian, J.R. Meyer, C.A. Hoffman, and J.E. Butler, J. Electron. Mater. 28(4), 347 (1999).
75
R.C. Keller, M. Seelmann-Eggebert and H.J. Richter, J. Electron. Mater. 24(9), 1155 (1995).
86J. Baylet et al., J. Electron. Mater. 33(6), 690 (2004).
97
G. Bahir and E. Finkman, J. Vac. Sci. Technol. A 7, 348 (1989).
108
J.L. Elkind and G.J. Orloff, J. Vac. Sci. Technol. A 10, 1106 (1992).
This is the author’s peer reviewed, accepted manuscript. However, the online version of record will be different from this version once it has been copyedited and typeset.
119L. Liu, Y. Chen, Z. Ye, and R. Ding, Infrared Phys. & Technol. 90, 175 (2018).
1210
C.R. Eddy, E.A. Dobisz, J.R. Meyer and C.A. Hoffman, J. Vac. Sci. Technol. A 11, 1763 (1993).
1311J. Kim et al., J. Electron. Mater. 32(7), 677 (2003).
1412
R.C. Keller, M. Seelmann-Eggebert and H.J. Richter, Appl. Phys. Lett. 67, 3750 (1995).
1513
F. Boulard, J. Baylet and C. Cardinaud, J. Vac. Sci. Technol. A 27, 855 (2009).
1614J.E. Schramm, D.I. Babic, E.L. Hu, J.E. Bowers and J.L. Merz, Proceedings IEEE 6th International Conference on Indium Phosphide and Related Materials (IPRM), Santa Barbara, CA, USA, 1994, pp. 383-386.
1715T. Suzuki, N. Haneji, K. Tada, Y. Shimogaki and Y. Nakano, Jap. J. Appl. Phys. 41, 15
(2002).
18
J.W. Coburn, H.F. Winters and T. J. Chuang, J. Appl. Phys. 48, 3532 (1977).
19
J.W. Coburn and H.F. Winters, J. Vac. Sci. Technol. 15, 327 (1978).
20J.W. Coburn and H.F. Winters, J. Appl. Phys. 50, 3189 (1979).
21
J.W. Coburn and H.F. Winters, J. Vac. Sci. Technol. 16, 391 (1979).
22H.F. Winters and J.W Coburn, Surf. Sci. Rep.14 (4–6), 162 (1992).2316S Jacq, C
Cardinaud, L. Le Brizoual and A. Granier, Plasma Sources Sci. Technol. 22, 055004 (2013).
2417V. Raballand Gravure en plasma dense fluorocarboné de matériaux organosiliciés à faible constante diélectrique (SiOCH,SiOCH poreux). Etude d’un procédé de polarisation pulsée, PhD Thesis Université de Nantes 2006.
25N.St.J Braithwaite, J.P. Booth and G. Cunge, Plasma Sources Sci. Technol. 5, 677 (1996).
This is the author’s peer reviewed, accepted manuscript. However, the online version of record will be different from this version once it has been copyedited and typeset.
26J.W. Coburn, J. Appl. Phys. 50, 5210 (1979).
27
B. Pelliciari, J. Crystal Growth 86 (1–4), 146 (1988).
28
O. Gravrand et al., J. Electron. Mater. 42(11), 3349 (2013).
2918CasaXPS (casaXPS.com).
3019
R.W.B. Pearse and A.G. Gaydon, The identification of molecular spectra, (Chapman and Hall, London, 4th edition, 1976).
3120National Institut of Standards and Technology (NIST), Atomic spectra data base.
32National Institut of Standards and Technology (NIST), Chemistry webbook.
33
P. Teulet, J.P. Sarrette and A.M. Gomes, JQSRT 62, 549 (1999).
34G.H. Dieke and J.W. Mauchly, Phys. Rev. 43, 12 (1933).
35M.E. Jacox, J. Mol. Struct. 157, 43 (1987).
36
C.O. Laux and C.H. Kruger, JQSRT 48, 9 (1992).
37
B. Rose, Spectroscopic Data Relative to Diatomic Molecules, 1970, Pergamon Press, Paris.
38S.A. Mitchell, Astrophys. J. 105, 1 (1947).
39
G. Norlén, Phys. Scr. 8, 249 (1973).
40
CE. Moore, in Nat. Stand. Ref. Data Ser., NSRDS-NBS 3 (Sect. 7) 1976.
41O. Langlois et al., Appl. Phys. Lett. 87, 131503 (2005).
42
G. Cunge et al. J. Vac. Sci. Technol. B 20, 2137 (2002).
43
F. Gaboriau et al., J. Phys. D: Appl. Phys. 39, 1830 (2006).
4421N. Hellgren et al., Thin Solid Films 471, 19 (2005).
This is the author’s peer reviewed, accepted manuscript. However, the online version of record will be different from this version once it has been copyedited and typeset.
4522S.E. Rodil and S. Muhl, Diamond Rel. Mater. 13, 1521 (2004).
4623
J. Pereira, I. Géraud-Grenier, V. Massereau-Guilbaud, André Plain and V. Fernandez,
Surf. Coatings Technol. 200, 6414 (2006).
4724B. Angleraud, N. Mubumbila, P.Y. Tessier, V. Fernandez and G. Turban, Diamond Rel. Mater. 10, 1142 (2001).
4825
T.S. Sun, S.P. Buchner and N.E. Byer, J. Vac. Sci. Technol 17, 1067 (1980).
4926B.H. Erné et al., Appl. Surf. Sci. 175-176, 579 (2001).
5027G. Badano, A. Million, B. Canava, P. Tran-Van, and A. Etcheberry, J. Electron. Mater.
36, 1077 (2007).
5128A. Causier et al., J. Electron. Mater. 40(8), 1823 (2011).
5229R. Sporken et al., J. Electron. Mater. 38(8), 1781 (2009).
5330
J.F. Moulder, W.F. Stickle, P.E. Sobol and K.D. Bomben, Handbook of X-ray
Photoelectron Spectroscopy, (Ed. Perkin-Elmer Corp. 1992). 5431R. Nokhwal et al., J. Electron. Mater. 46(12), 6795 (2017).
This is the author’s peer reviewed, accepted manuscript. However, the online version of record will be different from this version once it has been copyedited and typeset.
Figure 1
Figure 1: Ratio between the oxygen plasma cleaning time and the plasma process time in a precursor/H2/Ar mixture (X/(55-X)/5 sccm) as a function of the precursor flow, for the precursors methane () and ethane () methanol (⧫), ethanol (), acetone (), isopropanol () and nitromethane (). 0 5 10 15 20 0.0 0.2 0.4 0.6 0.8 CH3NO2 CH3COCH3 CH3OH CH3CH(OH)CH3 CH3CH2OH C2H6 Cl ean Ti me / Process Time
Precursor flow rate (sccm) CH4
This is the author’s peer reviewed, accepted manuscript. However, the online version of record will be different from this version once it has been copyedited and typeset.
Figure 2
Figure 2: Deposition rate and Tc/Tp ratio versus O2 and N2O flow rate in (a) a CH4/O2/H2/Ar and (b) a CH4/N2O/H2/Ar plasma. Gas mixture is 10/Y/(45-Y)/5 sccm.
0 2 4 6 8 0 1 2 3 4 5 Deposition rate Tc / Tp O2 flow rate (sccm) Dep ositio n rat e (nm /m in) 0.00 0.05 0.10 0.15 0.20 Cl ean time / Process t ime Si oxidation a Deposition rate Tc / Tp 0 5 10 15 20 25 0 5 10 15 Si oxidation N2O flow rate (sccm) Deposition rate (nm/ min) b 0.0 0.5 1.0 1.5 Clean time / Proce ss time
This is the author’s peer reviewed, accepted manuscript. However, the online version of record will be different from this version once it has been copyedited and typeset.
Figure 3
Figure 3: Typical optical emission spectra of CH4/H2/Ar, CH3OH/H2/Ar, CH3NO2/H2/Ar plasmas obtained at 1000 W excitation power, 4 mTorr pressure, gas mixture is 8.5/46.5/5 sccm. Whole UV-vis. spectral range (a), blow up on the 200-400 nm range (b). Spectra are not corrected from the optical response of the measuring chain (fiber, monochromator, detector). 1000 10000 Intensity ( CP S) CH4 / H2 / Ar Ar 1000 10000 CO CH3OH / H2 / Ar Intensity ( CP S) H OH 200 300 400 500 600 700 800 900 1000 1000 10000 NO CH3NO2 / H2 / Ar Intensity ( CP S) Wavelength (nm) CN N2 NH 1000 1500 2000 2500 3000 Intensity ( CP S) CH4 / H2 / Ar 1000 1500 2000 2500 3000 CO CH3OH / H2 / Ar Intensity ( CP S) OH 200 250 300 350 400 1000 1500 2000 2500 3000 b NO CH3NO2 / H2 / Ar Intensity ( CP S) Wavelength (nm) CN N2 NH
This is the author’s peer reviewed, accepted manuscript. However, the online version of record will be different from this version once it has been copyedited and typeset.
Figure 4
Figure 4: Evolution of the actinometry ratios X*/Ar* for (a) X* = CO*, H* and (b) X* = OH* and O* when varying the amount of O2 in CH4/O2/H2/Ar (10/Y/45-Y/5 sccm) mixture. 0 5 10 15 20 25 0.0 0.1 0.2 0.3 0.4 0.5 0.6 0.7 CO* / Ar* H / Ar* O 2 flow rate (sccm) CO* / Ar* a 0.0 0.5 1.0 1.5 2.0 2.5 3.0 H / Ar* 0 5 10 15 20 25 0.0 0.1 0.2 0.3 0.4 0.5 0.6 0.7 OH* / Ar* O* / Ar* O2 flow rate (sccm) O* / Ar* and OH* / Ar* b
This is the author’s peer reviewed, accepted manuscript. However, the online version of record will be different from this version once it has been copyedited and typeset.
Figure 5 0 5 10 15 20 25 0.0 0.5 1.0 1.5 CN* / Ar NO* / Ar CO* / Ar N2O flow rate (sccm) CN * / Ar* 0.0 0.1 0.2 0.3 0.4 0.5 0.6 0.7 NO* / Ar* and CO* / Ar* a 0 5 10 15 20 25 0.0 0.5 1.0 1.5 2.0 2.5 3.0 H / Ar* NH* / Ar* N2O flow rate (sccm) H / Ar* b 0.0 0.2 0.4 0.6 0.8 1.0 NH * / Ar*
This is the author’s peer reviewed, accepted manuscript. However, the online version of record will be different from this version once it has been copyedited and typeset.
Figure 5 (end)
Figure 5: Evolution of the actinometry ratios X*/Ar* for (a) X* = CN*, NO, CO*, (b) X* = NH*, H* and (c) X* = OH* and O* when varying the amount of N2O in CH4/N2O/H2/Ar (10/Y/45-Y/5 sccm) mixture. 0 5 10 15 20 25 0.0 0.1 0.2 0.3 0.4 0.5 0.6 0.7 OH* / Ar* O* / Ar N2* / Ar* N2O flow rate (sccm) O* / Ar* and OH* / Ar* c 0.0 0.5 1.0 1.5 2.0 2.5 N2 * / Ar*
This is the author’s peer reviewed, accepted manuscript. However, the online version of record will be different from this version once it has been copyedited and typeset.
Figure 6
292 290 288 286 284 282 280
Intensity
(a.u.
)
Binding energy (eV)
CH4/H2/ Ar a 292 290 288 286 284 282 280 Intensity (a.u. )
Binding energy (eV)
CH4/O2/H2/Ar C-C, C-H C-O b 292 290 288 286 284 282 280 Intensity (a.u. )
Binding energy (eV)
CH4/N2O/H2/Ar C-C, C-H C(sp2)-N C(sp2)=N, C(sp3)-N CN c
This is the author’s peer reviewed, accepted manuscript. However, the online version of record will be different from this version once it has been copyedited and typeset.
Figure 6 (end)
Figure 6: C 1s (a, b, c) and N1s (d) spectra of the layers deposited on Si in (a) CH4/H2/Ar, (b) CH4/O2 (2 sccm) /H2/Ar and (c, d) CH4/N2O (5 sccm) /H2/Ar plasmas.
404 402 400 398 396 394 392
Intensity
(CPS
)
Binding energy (eV)
CH4/N2O/H2/Ar N=C, CN N-C N-H
d
This is the author’s peer reviewed, accepted manuscript. However, the online version of record will be different from this version once it has been copyedited and typeset.