HAL Id: halshs-01068266
https://halshs.archives-ouvertes.fr/halshs-01068266
Preprint submitted on 25 Sep 2014
HAL is a multi-disciplinary open access
archive for the deposit and dissemination of sci-entific research documents, whether they are pub-lished or not. The documents may come from teaching and research institutions in France or abroad, or from public or private research centers.
L’archive ouverte pluridisciplinaire HAL, est destinée au dépôt et à la diffusion de documents scientifiques de niveau recherche, publiés ou non, émanant des établissements d’enseignement et de recherche français ou étrangers, des laboratoires publics ou privés.
Does Urbanization Help Poverty Reduction in Rural
Areas? Evidence from Vietnam
Mohamed El Hedi Arouri, Adel Ben Youssef, Cuong Nguyen-Viet
To cite this version:
Mohamed El Hedi Arouri, Adel Ben Youssef, Cuong Nguyen-Viet. Does Urbanization Help Poverty Reduction in Rural Areas? Evidence from Vietnam. 2014. �halshs-01068266�
1
P
ROGRAM ON THE
G
LOBAL
D
EMOGRAPHY OF
A
GING
AT
H
ARVARD
U
NIVERSITY
Working Paper Series
Does Urbanization Help Poverty Reduction in Rural Areas?
Evidence from Vietnam
Mohamed Arouri, Adel Ben Youssef, and Cuong Nguyen-Viet
July 2014
PGDA Working Paper No. 115
http://www.hsph.harvard.edu/pgda/working.htm
The views expressed in this paper are those of the author(s) and not necessarily those of the Harvard Initiative for Global Health. The Program on the Global Demography of Aging receives funding from the National Institute on Aging, Grant No. 1 P30 AG024409-09.
2
Does Urbanization Help Poverty Reduction in Rural Areas?
Evidence from Vietnam
Abstract
Urbanization and poverty have a two-way relationship. Using fixed-effects regression and panel data from household surveys, we estimate the effect of urbanization on welfare and poverty of rural households in Vietnam. We find that urbanization tends to increase landlessness of rural households and to reduce their farm income. However, urbanization helps rural households increase their wages and non-farm incomes. As a result, total income and consumption expenditure of rural households tend to be increased with urbanization. Then we find that urbanization also helps rural households decrease the expenditure poverty rate, albeit at a small magnitude.
Keywords: urbanization, household welfare, rural poverty, impact evaluation, household surveys, Vietnam, Asia.
3
INTRODUCTION
Urbanization is a key feature of economic development. Geographical agglomeration of people as well as firms leads to lower production costs and higher productivity (Krugman, 1991; Fujita et al., 1999; Quigley, 2008). Urbanization is not only a result but also a cause of economic development (Gallup et al., 1999). Together with the economic development, the proportion of urban population in the world increased from 29.4 percent in 1950 to around 52.1 percent in 2011 (United Nations, 2012). In developed countries, 77.7 percent of the population is living in urban areas. Urbanization is lower but has experienced a high growth rate in developing countries rising from 17.6 percent of the population in 1950 to 46.5 percent in 2011.1 Moreover, according to UN projections, the world urban population is expected to increase by 72% by 2050, from 3.6 billion in 2011 to 6.3 billion in 2050, and 5.12 billion of this urban population will be in developing countries.
The effects of urbanization on economic growth depend on the nature and process of urbanization (Bloom et al. 2008). While urbanization has led to a rapid growth in Asia, there was no impact in Africa (Ravallion et al., 2007). Despite the large literature on the relationship between urbanization and growth (e.g., Fay and Opal, 2000; Bertinelli and Black, 2004), little is known about the effect of urbanization on rural poverty and the channels by which urbanization can impact poverty. Since urbanization can affect growth, one can suppose that it affects poverty as well. In fact, economic growth is a prerequisite for poverty reduction (Demery and Squire, 1995; Ravallion and Chen, 1997; Dollar and Kraay, 2000). Urban areas tend to be less poor, and, as a result, poverty level tends to decrease as the share of urban population increases (Ravallion et al., 2007). More precisely, there are several channels through which urbanization can affect welfare and poverty of rural households (Ravallion et al., 2007; Cali and Menon, 2009; Martinez-Vazquez et al., 2009). Some of them are being discussed.
A first set of contributions found positive impacts of urbanization on rural dwellers welfare. First, urbanization often involves migration from rural to urban areas. Migration is expected to increase income of migrants as well as households benefiting from migrants’ remittances (Stark and Taylor, 1991; Stark, 1991). In the early stage of development, workers in the agricultural sector and rural areas tend to move to the industrial sector and urban areas (Lewis, 1954; Harris and Todaro, 1970). Migration can have numerous impacts on rural households. The most direct impact of migration is
1
There are economic theories and empirical studies supporting an inverted U-shape relationship in which urbanization first increases to a peak, then decrease with economic development (see Henderson, 2003 for review).
4
increased income and consumption, mainly through remittances (McKenzie and Sasin, 2007). Positive impacts of remittances on household welfare and poverty reduction are found in a large number of studies (e.g., Adams, 2006; Adams and Page, 2005; Acosta et al., 2007). However, several empirical studies do not find any poverty reduction effects of migration (Yang, 2004; Azam and Gubert, 2006; Nguyen et al., 2013). During economic crisis, in particularly, rural to urban migration and remittances sent to rural areas decrease due to higher unemployment in urban areas.
Second, urban development can have a positive impact on rural revenues by raising the demand for rural areas products (Tacoli, 1998; Tacoli, 2004; Otsuka, 2007; Cali and Menon, 2009; Haggblade et al., 2010). High economic growth and high population density in urban areas create more demand for commodities from rural areas, especially agricultural and labor-intensive commodities. Information technology and infrastructure tends to improve overtime, thereby reducing transport cost of commodities from rural households to urban markets. Otsuka (2007) concludes that in developing Asian countries urban-to-rural subcontracting for labor-intensive export manufactures has increased due to the reduction in transport cost.
Third, urbanization can increase nonfarm income of rural households, especially those living close to cities (Berdegue et al., 2001; Fafchamps and Shilpi, 2005; Deichmann et al., 2008). Firms are agglomerated in cities and they attract not only urban workers but also nearby rural workers. As a result, urbanization can increase wages of rural workers. In addition, migration that is derived from wage differentials between urban and rural areas can reduce the rural labor supply, thereby increasing rural wages.
Fourth, rural households’ welfare can rise through spillover effects (Bairoch, 1988; Williamson, 1990; Allen, 2009). Through migration as well as other interactive activities between urban and rural areas, urbanization can have positive effects on human capital formation of rural areas through transfers of information and advanced knowledge about production-related skills and technology (McKenzie and Sasin, 2007). Moreover, urbanization plays a vital role in the economic and social fabric of both urban and nearby rural areas by offering opportunities for education and health services. Education capital determines the ability of rural inhabitants to adopt existing technologies. Health capital can influence economic activity and poverty reduction directly through its impact on labor productivity.
A second set of contributions found negative impact of urbanization on rural dwellers’ welfare. Firstly, there are negative externalities of urban development on rural areas. For example, urbanization can lead to more landless or near landless households (Ravallion and van de Walle, 2008; Satterthwaite et al., 2010). Arable land is a key production factor for rural households. There are a large number of studies finding a
5
negative association between agricultural growth and poverty (Coxhead and Warr 1991; Datt and Ravallion 1996; Thorbecke and Jung 1996). At the household level, several studies find that land and land reforms help household reduce poverty (Besley and Burgess, 2000; Finan et al., 2005; Deininger et al. 2008). If urbanization causes agricultural land loss, it can have a negative effect on income and poverty reduction of rural households.
Secondly, urbanization may cause environmental degradation and health problems in rural areas which lead to poverty by reducing available incomes and labor productivity (Alam et al., 2007).
The overall effect of urbanization on rural household welfare is not well known especially in developing countries. Despite the importance for developing countries, there are only a few empirical studies on the effect of urbanization on poverty reduction and in particular on rural poverty reduction.
Ravallion et al. (2007) find that urbanization helps poverty reduction, but the effect varies across regions. Also using cross-country data Panudulkitti (2007) and Martinez-Vazquez et al. (2009) find a U-shape relation between urbanization level and poverty indexes. This finding implies that the effect of urbanization on poverty is not necessary linear and positive for all countries. To our knowledge, only Cali and Menon (2009) examined the effect of urbanization on rural poverty. The authors find in the context of India that urbanization helps reduce rural poverty largely thanks to positive spillovers from urbanization rather than to the migration of rural poor to urban areas.
In this study, we aim to contribute to this research area by examining the effect of urbanization on welfare and poverty of rural households in Vietnam. Vietnam is an interesting case to look at for at least three main reasons. Firstly, Vietnam has achieved high economic growth and remarkable poverty reduction during the past two decades. The poverty rate dropped dramatically from 58 percent in 1993 to 37 percent in 1998, and continued to decrease to 20 and 15 percent in 2004 and 2008, respectively.2 Secondly, Vietnam remains a rural country with 70 percent of the population living in rural areas. Poverty is now a rural phenomenon in Vietnam, since around 97 percent of the poor live in rural areas.3 The urbanization level is very similar to that of other developing countries (United Nations, 2007). However, the urbanization process has been increasing
2
According to Vietnam Household Living Standard Surveys in 1993, 1998, 2004 and 2008. 3
Rural households tend to have lower education, a larger household size, and a larger share of farm income than urban households. The poverty rate in urban and rural areas was 3.3% and 18.7% in 2008, respectively. The average per capita expenditure of urban households was nearly twice as much as that of rural households in 2008.
6
remarkably during the past decade. The urban population share increased from around 24 percent in 2001 to 30 percent in 2009. Thirdly, although there are several studies on urbanization and rural-urban migration in Vietnam (e.g., Tran, 2008; GSO, 2011; World Bank, 2011), there have been no quantitative studies on the effect of urbanization on rural household welfare. Whether the urbanization process has contributed to rural poverty reduction in Vietnam remains unknown.
Using panel data from Vietnam Household Living Standard Surveys in 2002, 2004, 2006 and 2008, we show that urbanization tends to increase landlessness of rural households and to reduce their farm income. However, households living in provinces with high urbanization level are more likely to have higher wage income and non-farm income. The increase in nonfarm income is greater than the farm income loss, and as a result total income and consumption expenditure of rural households tend to increase with urbanization. Then, we propose a simple method to measure the marginal effect of urbanization on poverty rate, and we find that urbanization leads to a decrease in poverty rate in Vietnam. Although the empirical analysis deals with Vietnam, we expect our results to be important for a wider group of emerging and developing economies where with high urbanization rates but also high rural poverty rates.
This paper is structured into six sections. The second section presents the data sets used in this study. The third section provides an overview of the urbanization process and rural poverty in Vietnam. The fourth and fifth sections present the method and results of the effect of urbanization on rural welfare and poverty, respectively. Finally, several conclusions are drawn in the sixth section.
DATA SET
This study relies on data from Vietnam Household Living Standard Surveys (VHLSS) in 2002, 2004, 2006 and 2008. The VHLSSs were conducted by the General Statistics Office of Vietnam (GSO) in 2002, 2004, 2006 and 2008. The surveys contain household and commune data. Data on households include basic demography, employment and labor force participation, education, health, income, expenditure, housing, fixed assets and durable goods, participation of households in poverty alleviation programs. Commune data include demography and general situation of communes, general economic conditions and aid programs, non-farm employment, agriculture production, local infrastructure and transportation, education, health, and social affairs. Commune data can be merged with household data. However, commune data are collected only for the rural areas (commune data are collected from 2,181 rural communes). There are no data on urban communes.
7
The 2002 VHLSS covered 29,530 households, while each of the VHLSSs 2004, 2006 and 2008 covered 9,189 households. The 2002 VHLSS has a larger sample size than other VHLSSs, since GSO want to have income and consumption estimates representative at the provincial level. The other VHLSSs are representative at the regional level. In Vietnam, there are 64 provinces and cities which are grouped into 8 geographic regions (see Figure 3 in section 3).
Information on commune characteristics is collected from 2,181 rural communes. According to the 2009 Population and Housing Census, there are 10,894 communes with the average population size of around 7,900 people per commune. It is helpful that there are random panel data contained in these VHLSSs. In each VHLSS, GSO randomly selects a number of households to be included in the next VHLSS. More specifically, the 2002 and 2004 VHLSSs contain a panel of 4,008 households. Similarly, the 2004 and 2006 VHLSSs include a panel of 4,219 households. However, among these households, 1,873 households are covered by the three VHLSSs 2002, 2004, and 2006. The 2006 and 2008 VHLSSs set up a panel data set of 4,090 households. There are 1,873 households who are sampled by the three VHLSSs 2004, 2006, and 2008. Only 30 households are sampled by the four VHLSSs. The four VHLSSs set up unbalanced panel data of 20,950 households. In this study, we focus on the impact of urbanization on welfare of rural households. The number of rural households in this panel data set is 15,886.
URBANIZATION AND WELFARE OF RURAL HOUSEHOLDS IN VIETNAM
Urbanization process in Vietnam
Topographically, Vietnam is a very diverse country, with 8 well-defined agroecological zones. These regions range from the remote and poorly endowed zones of the Northern Mountains area bordering China and the North and South Central Coast regions, through the Central Highlands, to the fertile, irrigated regions of the Red River Delta in the North and the Mekong Delta in the South. The Northern East is the poorest region with a low level of urbanization, while South East is most urbanized region with the lowest poverty (Table 1).
Table 1: Urbanization and rural poverty in 2002-2008
Regions
The proportion of urban
people (%) Rural poverty rate (%) 2002 2008 2006 2008 Red River Delta 19.7 25.6 11.0 10.4
8
Regions The proportion of urban
people (%) Rural poverty rate (%) North East 18.4 20.2 29.9 29.3 North West 13.1 12.9 56.4 52.0 North Central Coast 12.6 14.5 33.1 25.9 South Central Coast 28.0 29.8 17.1 18.2 Central Highlands 26.1 28.7 34.4 31.4 South East 48.9 54.1 9.9 5.7 Mekong River Delta 17.3 21.4 11.8 13.6
Total 23.2 27.6 20.4 18.7
Source: Authors’ estimation from VHLSSs.
In this study, a household is classified as the poor if their per capita expenditure is below the expenditure poverty line. The expenditure poverty lines are 1917, 2077, 2560 and 3358 thousand VND for the years 2002, 2004, 2006 and 2008, respectively. These poverty lines are constructed by the World Bank and GSO. The poverty lines are equivalent to the expenditure level that allows for nutritional needs, and some essential non-food consumption such as clothing and housing.
Before 2008, Vietnam was divided into 59 provinces and five centrally controlled cities: Hanoi (the capital), Ho Chi Minh City, Hai Phong, Da Nang and Can Tho. In this study, provinces and centrally controlled cities are all called provinces. In 2008, Ha Tay province was merged into Hanoi, and now Vietnam consists of 63 provinces. Each province is divided into districts and each district is further divided into communes. Communes are smallest administrative divisions Vietnam. In 2009, there are 684 districts and 11,112 communes (according to the Population Census 2009). Communes are classified into three types: rural communes, commune-level towns, the wards from urban districts. Urban areas consist of commune-level towns and wards. Basically, an urban area is classified as urban if it has a minimum population of 4,000 people and a minimum population density of 2000 people/km2. The proportion of non-farm workers is required to be at least 65 percent (see Government of Vietnam, 2009). Currently, around 30 percent of people are living in 753 urban areas (commune-level towns and wards) throughout the country (GSO, 2011).
In Vietnam, the urbanization process has been increasing since the early 1900s (Figure 1). According to the definition of urban areas in Vietnam, there are two possible origins of urbanization in Vietnam. Firstly, rural-urban migration can increase the urban population. Around 16% of the urban population are migrants who moved from the rural to urban areas during 2004 and 2009 (GSO, 2011). There are several studies on the determinants of rural-urban migration in Vietnam, and most studies argue that the key motivation for rural people to move to urban areas is high wage employments in urban areas (Dang et al., 2003; Brauw and Harigaya, 2007). Industrialization and foreign direct
9
investment in industrial zones in urban areas attract rural laborers (Dang et al., 1997; Dang, 2001).
Secondly, a rural area can become an urban area if it has higher population and more non-farm economic activities.4 In developing countries where agricultural production is a comparative advantage, farm households can increase income from exporting agricultural products. Increasing incomes from the agricultural sector can result in increased demand for services and manufactured goods (Tacoli, 1998; 2004). At the same time, trade liberalization and the growing export oriented agriculture can lead to the marginalization of small farmers, and these farmers might have to move to non-farm sectors. Rural communes with increasing population and non-farm sectors will be defined as urban wards. The share of wage in total income of rural household increased from 23.7% in 2002 to 27.1% in 2008.5 During 2000-2009, the number of urban areas increased from 649 to 753 in Vietnam (GSO, 2011). The number of urban communes (wards) increased from 14.8% in 1999 (out of 10,474 communes) to 17.7% in 2009 (out of 10,894 communes).
Figure 1. The percentage of urban population during 1931–2009
Source: GSO (2011)
There are a large variation in urbanization between regions and provinces in Vietnam (Table 1 and Figure 2). The largest cities including Hanoi, Ho Chi Minh City, Hai Phong, Da Nang are located in Red River Delta, South Central Coast and South East regions. The proportion of urban population to total population of provinces ranges from 7 percent to 86 percent. The median of the proportion of urban population at the provincial
4
In Vietnam, population increased by around 1 million people annually from 1999 to 2009. 5 Authors’ estimation from the VHLSSs 2002 and 2008.
10
level is around 16 percent. Two cities that have the proportion of urban population higher than 80 percent are Da Nang city (86 percent) and Ho Chi Minh city (84 percent). There are four provinces have the proportion of urban population less than 10 percent.
Figure 2. Provincial urbanization and rural poverty
The proportion of urban people in 2008 (%) Poverty rate of rural people in 2006 (%)
Source: Preparation by authors using data on urban population from General Statistics Office of Vietnam (GSO) and poverty rate data from Nguyen et al. (2010).
Compared with other developing countries in the world, the proportion of urban population of Vietnam is very similar (Figure 3). Compared with the average urban share of the world and South-Eastern Asian countries, Vietnam has a much lower rate of urbanization. However, during the recent years, the annual rate of change of percentage urban is higher than the average rate of other developing countries as well as the South-Eastern Asian countries. The higher annual growth rate of the urban proportion of Vietnam is also projected for the future until the year 2050 (United Nations 2007).
11
Figure 3. Urbanization in Vietnam and other countries during 1950–2050
The percentage of urban poupation (%) Annual rate of change of percentage urban (%)
Source: Preparation using data from United Nations (2007)
Urbanization and rural household welfare
One of the direct negative effects of urbanization on rural household is on agricultural landholding. There are more landless or near landless households in Vietnam (Ravallion and van de Walle, 2006). There is increasing agricultural land converted to nonagricultural land in rural areas, especially in peri-urban areas (Tran, 2008; Nguyen et al., 2012). Around one million hectares of agricultural land was converted to nonagricultural land during the period 2001-2010 (Nguyen et al., 2014). According to Vietnam’s Land Law, residential lands can be owned by individuals and households, but agricultural lands and other lands are owned by the State. The State allocates agricultural lands to individuals, households and organizations to use for a given period of time. Before 2013, the land allocation time was 20 years. Since the revised Land Law in 2013, the tenure period is increased to 30 years. Farmers can sell the right to use agricultural land to other households, but this land can only be used for agriculture. During the process of industrialization and urbanization, provincial governments give more favors to project investors than farmers (Tran, 2008; Nguyen et al., 2012). As the agricultural land tenure is due, agricultural lands can be allocated to project investors and converted into industrial or residential areas.6 The government can also withdraw agricultural lands from farmers before tenure due and compensate them according to the Land Law.
6
12
Table 2 presents the per capita annual crop land and perennial crop land by the share of urban population during the period 2002-2008. Households living in provinces either very low or very high shares of urban population tend to have smaller per capita agricultural lands. Very low urbanized provinces tend to be located in Northern Mountain and have lower agricultural lands. As the urbanization level increases, the agricultural land tends to be increase. Households in provinces with middle level of urbanization have the largest agricultural lands.
Table 2. Provincial urbanization and landholdings of rural households during 2002-2008
Share of urban population of provinces
Years
2002 2004 2006 2008
Per capita annual crop land (m2)
0-10% 531.1 550.4 621.7 526.8 10% - 20% 903.3 913.9 908.5 952.6 20% - 30% 1157.0 1149.1 1310.1 1293.1 30% - 40% 646.1 805.4 813.0 859.3 40% + 339.7 373.9 482.5 484.0 Total 813.5 842.3 888.2 933.1
Per capita perennial crop land (m2)
0-10% 135.7 99.5 137.5 230.3 10% - 20% 203.3 219.0 245.6 224.3 20% - 30% 419.7 373.3 341.6 413.4 30% - 40% 613.2 431.2 827.0 783.0 40% + 179.1 57.6 88.4 126.2 Total 266.5 238.2 288.5 297.6 All variables are in ‘per capita’, i.e.. equal to total land size divided by the household size.
Source: Authors’ estimation from panel data of VHLSSs 2002-2008.
Table 3 presents the association between income pattern of households and provincial urbanization. Households in the most urbanized provinces are more likely to have a lower share of crop and livestock income in the total income. This is expected since households in more urbanization provinces have smaller agricultural landholdings than households in less urbanized provinces. The share of wages and other non-farm incomes in total household income is higher for households in provinces of high urbanization. Table 3 also shows there is a trend of decreasing farm income and increasing non-farm incomes overtime.
Table 3. Provincial urbanization and income share of rural households during 2002-2008
Share of urban population of provinces
Years
2002 2004 2006 2008
13 Share of urban population of provinces Years 2002 2004 2006 2008 0-10% 34.0 29.5 28.6 28.5 10% - 20% 31.9 29.3 26.6 28.9 20% - 30% 33.9 32.1 30.2 29.9 30% - 40% 24.7 24.6 24.9 26.4 40% + 14.1 13.1 16.1 16.2 Total 31.0 28.4 26.5 27.8
Share of livestock income in total income (%)
0-10% 10.6 10.5 10.1 10.8 10% - 20% 9.6 8.8 8.9 8.8 20% - 30% 7.4 7.3 7.4 6.7 30% - 40% 7.1 6.1 6.0 6.7 40% + 6.6 6.4 6.4 5.5 Total 9.0 8.5 8.4 8.2
Share of wage income in total income (%)
0-10% 20.6 21.8 23.4 25.9 10% - 20% 22.0 22.0 24.3 25.3 20% - 30% 24.7 25.6 26.1 26.0 30% - 40% 30.5 31.3 33.9 29.8 40% + 35.8 37.4 34.1 40.7 Total 23.7 24.3 26.0 27.1
Share of non-farm income in total income (%)
0-10% 13.1 14.7 12.9 11.6 10% - 20% 12.2 12.2 12.9 12.4 20% - 30% 14.4 13.3 13.7 12.9 30% - 40% 16.1 14.5 12.9 13.5 40% + 20.7 19.9 19.8 17.7 Total 13.6 13.5 13.5 12.9
Share of private transfers in total income (%)
0-10% 9.8 10.4 8.7 6.8 10% - 20% 9.1 10.4 8.8 6.3 20% - 30% 6.8 7.5 7.0 4.6 30% - 40% 11.7 11.9 8.5 7.3 40% + 11.1 9.5 8.8 5.5 Total 9.2 10.2 8.5 6.1 Source: Authors’ estimation from panel data of VHLSSs 2002-2008.
Table 4 examines the association between rural household welfare and urbanization. Rural households who live in provinces with higher urbanization have higher per capita income and expenditure than rural households in provinces with lower urbanization. Table 4 also shows a large difference in the expenditure poverty rate between rural households in low urbanization areas and those in high urbanization areas.
14
Table 4. Provincial urbanization and household welfare of rural households during 2002-2008
Share of urban population of provinces
Years
2002 2004 2006 2008
Per capita income (thousand VND in price 2002)
0-10% 3251.5 4011.5 4769.8 5623.4 10% - 20% 3317.2 4162.8 5015.8 5247.7 20% - 30% 3663.9 4161.7 5302.6 5972.6 30% - 40% 4053.1 4778.5 5935.3 5736.1 40% + 5629.0 5845.8 6471.5 6714.2 Total 3565.2 4299.0 5222.1 5569.9
Per capita expenditure (thousand VND in price 2002)
0-10% 2504.5 2921.6 3218.9 3571.4 10% - 20% 2469.0 2952.8 3399.2 3617.6 20% - 30% 2475.2 2782.4 3577.4 3782.5 30% - 40% 3039.8 3656.6 4127.5 3879.7 40% + 4029.4 4429.3 4875.9 4991.0 Total 2621.8 3086.1 3581.5 3776.4 Poverty rate (%) 0-10% 35.9 24.7 22.1 17.0 10% - 20% 40.4 27.6 22.3 21.5 20% - 30% 37.3 31.1 20.5 19.6 30% - 40% 23.5 15.4 16.9 14.5 40% + 9.7 7.7 8.1 3.4 Total 35.6 25.0 20.4 18.7 All variables are in ‘per capita’, i.e.. equal to total annual household income (expenditure) divided by the household size. The income variables are in the price of Jan 2006.
Source: Authors’ estimation from panel data of VHLSSs 2002-2008.
ESTIMATION METHODS
Fixed-effects regressions
To estimate the effect of urbanization on rural household welfare, we assume a welfare indicator of rural households is a function of household characteristics and the urbanization level as follows:
15
ln(Yikt)ln(Ukt)TtXiktikikt (1) where Yikt is a welfare indicator of household i in province k at time t (years 2002, 2004,
2006 and 2008). Ukt is the indicator of urbanization. In this study, we measure urbanization by the percentage of urban population to total population of provinces. Ukt is
the percentage of urban population in province k at the time t. We use the lagged urban population share, i.e., the urban population share in 2001, 2003, and 2005 and 2007 so that the urbanization variables are determined before the outcome variables.7 Although VHLSSs 2002, 2004, 2006 and 2008 were conducted in 2002, 2004, 2006 and 2008, respectively, they were implemented mainly in June and September and collected data on household welfare during the past 12 month.
In Vietnam, estimation of the urban and rural population is based on the Vietnam Population and Housing Censuses which are conducted every ten years. For years without a population census, GSO has conducted a so-called Population Change and Family Planning Survey to collect data on basic demographics and fertility since 2001. The surveys are representative for urban and rural provinces. In each province, around 6,000 households are sampled (GSO, 2010). In this study, the share of urban population of provinces is computed from these surveys.8
t
T is the dummy variable of year t. Xikt is a vector of household characteristics. ik
and ikt are time-invariant and time-variant unobserved variables, respectively. The
effect of urbanization on the welfare indicator is measured by , which is interpreted as the elasticity of the welfare indicator of rural households to the proportion of urban population of provinces.
We estimate the effect of urbanization on a number of household welfare indicators including per capita income, per capita income from different sources, per capita consumption expenditure, and per capita expenditure on different consumption items. We use the same model specification as equation (1) for all the welfare indicators. In other words, we regress different dependent variables of household welfare on the same set of explanatory variables.
Estimating the impact of a factor is always challenging. There are two difficulties in estimating the effect of urbanization on rural households within a country. Firstly, the urbanization process has been involving all the people through the country. If urbanization
7
There are no data of urban population as well as population at the district level using 2005-2008. The urban population share is available for 2009 when there is the Population Census.
8
16
is considered as a treatment, there are no clean treatment and control groups. In this study, we assume that urbanization at the provincial level affects only people within a province. There are no spill-over effects of urbanization of a province on rural people in other provinces. It is possible that rural households around the boundary of two provinces can be affected by the urbanization process of the two provinces. Since the proportion of households living around provincial boundaries is small, the spill-over effect is expected to be small compared with the main effect of urbanization. Figure 1 in Appendix 1 show that most urban areas lie completely within provinces.
Urbanization is not a random process. The urbanization process cannot be fully observed. We use the fixed-effect regression to eliminate unobserved time-invariant variables (variable in the equation (1)) that can cause endogeneity bias. It is expected ik that the endogeneity bias will be negligible after the elimination of unobserved time-invariant variables and the control of observed variables. In addition, for robust analysis we also tried the fixed-effects with instrumental variable regressions in which the instrumental variable for the urbanization variable (one-year lagged share of urban population) is the two-year lagged share of urban population. Lagged endogenous variables are often used as instruments for current endogenous variables. This type of instruments has an advantage that it is very strongly corrected with endogenous variables, and as a result it can reduce the bias due to weak instruments. However, the assumption on exclusion condition of instruments might not hold. Thus in this study, we will rely mainly on the results from fixed-effects regressions for interpretation.
Fixed-effects two-part models
In this study, we use different dependent variables of income and expenditure sub-components. For total income and consumption expenditure, we use the fixed-effect regression. However, several dependent variables such as sub-components of income and landholding have zero values for a large number of households. Since there are zero values of the dependent variables, we should use a Tobit model. However, there are two problems with a tobit model in this case. Firstly, there are not available fixed-effects Tobit estimators due to a so-called incidental parameter problem in maximum likelihood methods (Greene, 2004).9 Secondly, Tobit estimators are not consistent if the assumption on the normality and homoskedaticity of error terms is violated (Cameron and Trivedi,
9
Instead of fixed-effects Tobit models, one can use a random-effects Tobit model with available explanatory variables and group means of these explanatory variables to remove the time-invariant unobserved variables (Wooldridge, 2001).
17
2009). This assumption is very strong and often does not hold. In health economics, a two-part model is widely used to model a variable with a large number of zero values (Duan et al., 1983; Manning et al., 1987). In this study, we apply the two-part model in the context of fixed-effects panel data as follows:
Dikt Dln(Ukt)DTtDXiktDDikDikt, (2)
ln(Yikt)|Yikt0Y ln(Ukt)Y TtY XiktY YikYikt, (3)
where Dikt is a binary variable which equal 1 for Yikt 0, and 0 if Yikt 0. Subscript D and Y in parameters of equation (2) and (3) denote parameters in models of Dikt and ln(Yikt),
respectively. Equation (2) is a linear probability model. Equation (3) is a linear model of
)
ln(Yikt for households with positive values of Yikt. Both equations (2) and (3) are
estimated using the fixed-effects regressions.
Although equation (2) (with binary dependent variable) is often estimated using a logit or probit model, we estimate equation (2) using a linear probability regression since we aim to estimate equation (2) by a fixed-effects estimator. Currently, there are no available fixed-effects probit estimators. Fixed-effects logit regression can be used, however it is not efficient since it drops observations with fixed values of the dependent variable. Linear probability models are widely-used to estimate the marginal effect of independent variables when there are no available non-linear probability models (e.g., Angrist, 2001; Angrist and Krueger, 2001).
The effect of urbanization on the welfare indicator is measured by D and Y, and
each of these parameters can have its own interesting meaning. We are also interested in the average partial effect of ln(U) on the unconditional dependent variable ln(Y)which is estimated as follows (see Appendix 2 for proof):
ikt ikt Y ikt ikt Y D Y lm D n Y n E P Aˆ ( ) ˆ 1 ln( ) ˆ 1 , (4)where ˆD and ˆYare estimates from the fixed-effects regressions of equations (2) and (3),
Y
n is the number of observations with positive values of Y, n is the total number of observations in the panel data sample. A ˆPEYmeasures the elasticity of Y with respect to U (the partial effect of ln(U)on ln(Y)).
18
If the urbanization has an effect on the consumption expenditure, it can have an effect on poverty. In this study, we measure poverty by the expenditure poverty rate. A household is classified as the poor if their per capita expenditure is below the expenditure poverty line. We use a simple method to estimate the effect of urbanization on the poverty rate of rural households. The average partial effect of the urbanization variable on poverty rate can be estimated (see Appendix 2 for proof):
ikt ikt ikt ikt ikt ikt P Y z U H M E P A ˆ ˆ ) ln( ln ˆ 1 ˆ (5)where Hi is the size of household i, M is the total number of people in the data sample,
which is equal to
ikt i
H . The summation is taken over households in the two periods. ˆ ,
ikt
ˆ and ˆikt are estimated from the fixed-effects regression of log of per capita
expenditure. is the probability density function of the standard normal distribution.
P E P
A ˆ is interpreted as the change in the poverty rate as a result of a one percentage point change in the share of urban population in provinces. We can estimate A ˆPEP for each year to see how the effect of urbanization changes overtime.
The standard errors of the average partial effect estimators (in equations (4) and (5)) are calculated using non-parametric bootstrap with 500 replications.
EMPIRICAL RESULTS
Effects of urbanization on agricultural land of rural households
As discussed in section 3, urbanization together with industrialization process can create more non-farm employment and conversion of agricultural lands into industrial or residential lands. In this section, we first regress the agricultural landholding of rural households on the share of urban population and other control variables. Earning variables depend on a set of household characteristics which can be grouped into five categories (Glewwe, 1991): (i) Household composition, (ii) Regional variables, (iii) Human assets, (iv) Physical assets, and (v) Commune characteristics. Thus, the explanatory variables include household demography, education of household head, lands, road in village. Variables such as regional dummies that are time-invariant are eliminated in fixed-effects regressions. It should be noted that explanatory variables should not be affected by the
19
urbanization variable (Heckman, et al., 1999). Thus we limit to a small set of more exogenous explanatory variables. The summary statistics of the explanatory variables is presented in Table A.1 in Appendix 3.
We estimated both fixed-effects regressions and fixed-effects with instrumental variable regressions in which the instrumental variable for the urbanization variable (one-year lagged share of urban population) is the two-(one-year lagged share of urban population. The first-stage regression shows a very strongly positive correlation between this instrument and the urbanization variable. The fixed-effects estimates with instrumental variable regressions show very similar results to the fixed-effects regressions (presented in Appendix 3). We will use the results from the fixed-effects regressions for interpretation.
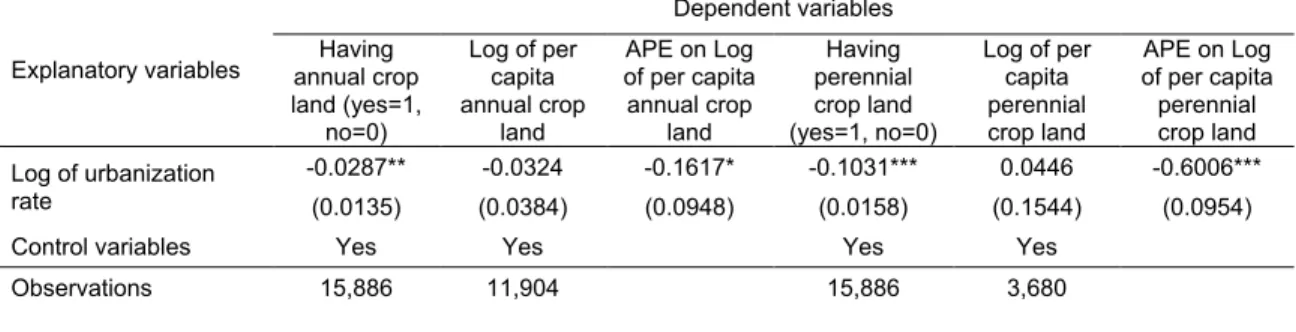
Table 5 presents the fixed-effects regressions of annual crop and perennial crop land on urbanization and the estimation of the average partial effect using fixed-effects two-part models. All the tables in this section only report the estimated coefficients on the variable urbanization. Full regression results are presented in Tables A.2 to A.9 in Appendix. Table 4 shows that urbanization increases the probability of landlessness in rural areas, especially for perennial crop land. A one percent increase in the urban population share of provinces reduces the probability of having annual crop land and perennial crop land by 0.028% and 0.103%, respectively.10 The effect of urbanization on land size for households having crop land is not significant. The elasticity of land with respect to urbanization is measured by the average partial effect of urbanization on lands. It shows that a one percent increase in the urban population share of provinces can decrease per capita annual crop land and per capita perennial crop land by 0.16% and 0.6%, respectively.
Table 5. Fixed-effects regressions of annual crop and perennial crop land
Explanatory variables Dependent variables Having annual crop land (yes=1, no=0) Log of per capita annual crop land APE on Log of per capita annual crop land Having perennial crop land (yes=1, no=0) Log of per capita perennial crop land APE on Log of per capita perennial crop land Log of urbanization rate -0.0287** -0.0324 -0.1617* -0.1031*** 0.0446 -0.6006*** (0.0135) (0.0384) (0.0948) (0.0158) (0.1544) (0.0954) Control variables Yes Yes Yes Yes
Observations 15,886 11,904 15,886 3,680
10
Since urbanization is measured in logarithm, the coefficient of the log of urbanization is interpreted as the percentage change in the probability of dependent variable being equal to one percent. For example, the coefficient of the log of urbanization in the regression of ‘having annual crop land’ is equal to -0.0287. It means that as urbanization increases by one percent, the probability of having annual crop land decreases by 0.0287/100 or equivalent to 0.0287%.
20 Explanatory variables Dependent variables Having annual crop land (yes=1, no=0) Log of per capita annual crop land APE on Log of per capita annual crop land Having perennial crop land (yes=1, no=0) Log of per capita perennial crop land APE on Log of per capita perennial crop land R-squared 0.028 0.045 0.088 0.119 Number of i 5,605 4,690 5,605 2,401
Average partial effect (APE) of log of urbanization on log of per capita land is equal to the average derivative of P(Land>0)*E(Log of land|Land>0) with respect to log of urbanization. The average partial effect is computed using the formula in equation (5).
Heteroskedasticity robust standard errors in parentheses (also corrected for sampling and cluster correlation). *** p<0.01, ** p<0.05, * p<0.1
Source: Authors’ estimations from panel data VHLSSs 2002-2008.
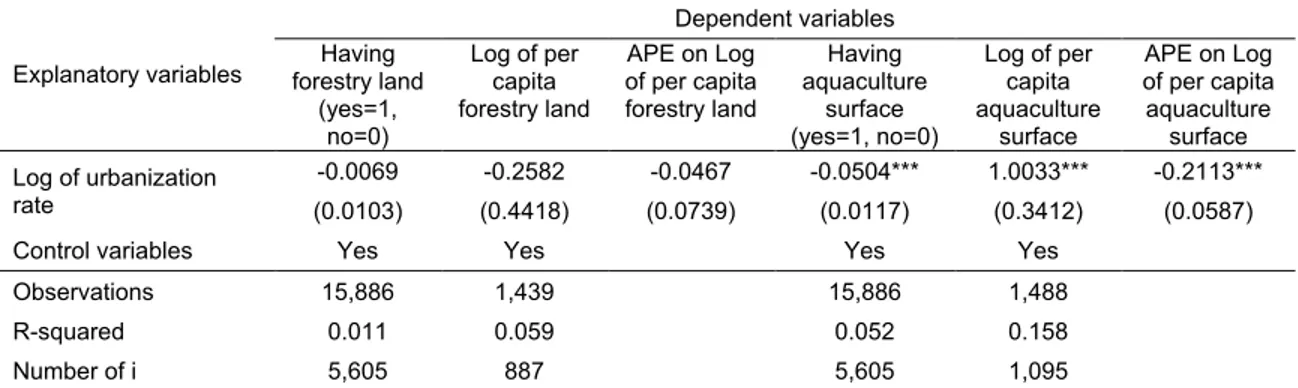
Table 6 shows that there are no significant effects of urbanization on forestry land in rural areas. However, the effect of urbanization on aquaculture water surface is significantly negative. A one percent increase in the urban population share of provinces reduces the probability of raising aquaculture by 0.05% and decreases the size of aquaculture surface by 1%.
Table 6. Fixed-effects regressions of forestry land and aquaculture water surface
Explanatory variables Dependent variables Having forestry land (yes=1, no=0) Log of per capita forestry land APE on Log of per capita forestry land Having aquaculture surface (yes=1, no=0) Log of per capita aquaculture surface APE on Log of per capita aquaculture surface Log of urbanization rate -0.0069 -0.2582 -0.0467 -0.0504*** 1.0033*** -0.2113*** (0.0103) (0.4418) (0.0739) (0.0117) (0.3412) (0.0587) Control variables Yes Yes Yes Yes
Observations 15,886 1,439 15,886 1,488 R-squared 0.011 0.059 0.052 0.158 Number of i 5,605 887 5,605 1,095
Average partial effect (APE) of log of urbanization on log of per capita land is equal to the average derivative of P(Land>0)*E(Log of land|Land>0) with respect to log of urbanization. The average partial effect is computed using the formula in equation (5).
Heteroskedasticity robust standard errors in parentheses (also corrected for sampling and cluster correlation). *** p<0.01, ** p<0.05, * p<0.1
Source: Authors’ estimations from panel data VHLSSs 2002-2008.
Effects of urbanization on household income
As urbanization reduces the agricultural lands of rural households, it can also decrease their farm income. Table 7 shows that urbanization decreases both crop and livestock incomes. A one percent increase in the urban population share of provinces reduces the probability of having crop income and livestock income by 0.064% and 0.102%, respectively. However, the effect of urbanization on the crop and livestock incomes conditional on households having these incomes is not statistically significant. This is consistent with the effect of urbanization on landholding. Urbanization decreases the
21
proportion of rural households having crop land but not the land size of rural households with crop land.
Overall, the average partial effect of urbanization on crop and livestock is still negative. A one percent increase in the urban population share of provinces decreases the crop income and livestock income by 0.1% and 0.5%, respectively.
Table 7. Fixed-effects regression of crop and livestock income
Explanatory variables Dependent variables Having crop income (yes=1, no=0) Log of crop income APE on Log of crop income Having livestock income (yes=1, no=0) Log of livestock income APE on Log of livestock income Log of urbanization rate -0.0638*** -0.0517 -0.4140*** -0.1016*** 0.0205 -0.4910*** (0.0121) (0.0433) (0.0848) (0.0164) (0.0672) (0.0962) Control variables Yes Yes Yes Yes
Observations 15,886 13,247 15,886 11,111 R-squared 0.033 0.047 0.035 0.047 Number of i 5,605 5,073 5,605 4,724
Heteroskedasticity robust standard errors in parentheses (also corrected for sampling and cluster correlation). *** p<0.01, ** p<0.05, * p<0.1
Source: Authors’ estimations from panel data VHLSSs 2002-2008.
In addition to the negative effects on crop and livestock income, urbanization also has a negative effect on other non-farm income (Table 8). Other non-farm income includes incomes from agriculture, forestry, and other agricultural activities. Urbanization can decrease the probability of having other non-farm income by 0.055% and the income level by 0.14% for rural households having other non-farm income.
Table 8. Fixed-effects regression of other farm income
Explanatory variables Dependent variables Having other farm income (yes=1, no=0) Log of other farm income APE on Log of other farm income Log of urbanization rate -0.0550*** 0.1367** -0.3334***
(0.0166) (0.0673) (0.0968) Control variables Yes Yes
Observations 15,886 9,656 R-squared 0.185 0.496 Number of i 5,605 4,506
Heteroskedasticity robust standard errors in parentheses (also corrected for sampling and cluster correlation).
*** p<0.01, ** p<0.05, * p<0.1
22
The shortage of agricultural land can push farmers into non-farm employment in Vietnam (Dang et al., 2003; Cu, 2005). Urbanization can lead to an increase in land prices in rural areas nearby cities, and rural households can sell their land for higher prices. Land sale can help households invest more in capital-intensive non-farm production (Cali and Menon, 2009). Urbanization and industrialization process also creates more non-farm employment opportunities for rural dwellers.
In Table 9, we examine whether urbanization can increase non-farm income of rural households. It shows that urbanization increases both wages and income from non-farm business and production (excluding wages). A one percent increase in the urban population share of provinces increases wages and one-farm income by 0.37% and 0.27%, respectively.
Table 9. Fixed-effects regression of wage and non-farm income
Explanatory variables Dependent variables Having wage (yes=1, no=0) Log of per capita wage for wage > 0 APE on log of wage Having non-farm income (yes=1, no=0) Log of non-farm income for non-farm income APE on log of non-farm income Log of urbanization rate 0.0373** 0.1556*** 0.3657*** 0.0283 0.2469** 0.2731** (0.0187) (0.0512) (0.1316) (0.0175) (0.1040) (0.1216) Control variables Yes Yes Yes Yes
Observations 15,886 9,040 15,886 5,391 R-squared 0.073 0.110 0.023 0.091 Number of i 5,605 4,328 5,605 2,904
Heteroskedasticity robust standard errors in parentheses (also corrected for sampling and cluster correlation). *** p<0.01, ** p<0.05, * p<0.1
Source: Authors’ estimations from panel data VHLSSs 2002-2008.
Urbanization does not have a significant effect on private transfers received by households and incomes from other sources (Table 10). However, urbanization increases the probability of receiving transfers. There is probably increasing migrations during the urbanization process that leads to an increase in the proportion of rural households receiving remittances. Nguyen et al. (2011) shows that migration leads to an increase in remittances received by home households in Vietnam. However, in the period of economic crisis, the effect of urbanization on private transfers can be smaller, since migration and remittances can be decreased. Actionaid (2009) finds that in some provinces, remittances from migration decreased due to the global economic crisis.
Table 10. Fixed-effects regressions of transfers and other non-farm income
Explanatory variables Dependent variables Receiving private transfers (yes=1, no=0) Log of per capita private transfers for transfer > 0 APE on log of per capita private transfers Having other income (yes=1, no=0) Log of other income for other nonfarm income APE on log of other nonfarm income Log of urbanization 0.0259* 0.0653 0.1659* 0.0130 0.1679 0.0909
23 Explanatory variables Dependent variables Receiving private transfers (yes=1, no=0) Log of per capita private transfers for transfer > 0 APE on log of per capita private transfers Having other income (yes=1, no=0) Log of other income for other nonfarm income APE on log of other nonfarm income rate (0.0144) (0.0823) (0.0944) (0.0194) (0.2495) (0.1038) Control variables Yes Yes Yes Yes
Observations 15,886 13,731 15,886 15,886 9,376 15,886 R-squared 0.020 0.096 0.072 0.307 0.053 0.237 Number of i 5,605 5,368 5,605 5,605 4,875 5,605 Heteroskedasticity robust standard errors in parentheses (also corrected for sampling and cluster correlation). *** p<0.01, ** p<0.05, * p<0.1.
The average partial effect is computed using the formula in equation (5). Source: Authors’ estimations from panel data VHLSSs 2002-2008.
Previous analysis (Table 9) shows that urbanization reduces farm income but increases non-farm income. An important question is whether urbanization affects the aggregate income of rural households. Table 11 presents the effect of urbanization on per capita income and ratio of subcomponent incomes to the total income. Urbanization has a positive effect on per capita income of rural households. A one percent increase in the urban population share of provinces increases the per capita income of rural households by 0.09%.
The effect of urbanization on shares of different incomes is small and consistent with the findings on the effect of urbanization of the income amount.11 More specifically, a one percent increase in the urban population share of provinces reduces the share of crop income and other farm income in total household income by 0.04% and 0.03%, respectively. Meanwhile, a one percent increase in the urban population share of provinces increases the share of wages and non-farm income in total household income by 0.03% and 0.02%, respectively.
Table 11. Fixed-effects regression of income and income share
Explanatory variables Dependent variables Log of per capita income Share of crop income Share of livestock income Share of other farm income Share of wage income Share of non-farm income Share of private transfers Share of other non-farm income Log of urbanization rate 0.0948*** -0.0425*** -0.0050 -0.0278*** 0.0328*** 0.0164* 0.0071 -0.0010 (0.0303) (0.0086) (0.0046) (0.0081) (0.0102) (0.0084) (0.0067) (0.0054) 11
It should be noted that all the fraction variables are measured in percentage. In this case, a one percent increase in urbanization will increase or decrease the dependent variables by a percentage point that is approximately equal to the coefficient divided by 100.
24 Explanatory variables Dependent variables Log of per capita income Share of crop income Share of livestock income Share of other farm income Share of wage income Share of non-farm income Share of private transfers Share of other non-farm income Control variables Yes Yes Yes Yes Yes Yes Yes Yes Observations 15,883 15,886 15,886 15,886 15,886 15,886 15,886 15,886 R-squared 0.227 0.034 0.010 0.582 0.061 0.022 0.106 0.142 Number of i 5,605 5,605 5,605 5,605 5,605 5,605 5,605 5,605 Heteroskedasticity robust standard errors in parentheses (also corrected for sampling and cluster correlation).
*** p<0.01, ** p<0.05, * p<0.1
Source: Authors’ estimations from panel data VHLSSs 2002-2008.
Effect of urbanization on household expenditure and poverty
Rural households living in provinces with a high proportion of urban population tend to have higher consumption expenditure. A one percent increase in the urban population share increases per capita expenditure of rural households by 0.096 percent (see Table A.4 in Appendix). Increased income due to urbanization was translated into increased consumption.
Finally, we estimate the effect of urbanization on rural poverty using equation (5) (Table 12). Since urbanization increases household expenditure, it reduces the expenditure poverty rate of rural households. The effect of urbanization on the poverty rate tendes to be smaller overtime, since the poverty rate decreased overtime. In 2002, a one percentage point increase in the proportion of urban population of provinces results in a 0.12 percentage point reduction in the expenditure poverty rate. In 2008, the reducing-poverty effect of the urbanization is 0.05 percentage points.
Table 12: Impact of urbanization on rural poverty rate (percentage point)
Year 2002 Year 2004 Year 2006 Year 2008
-0.119*** -0.076*** -0.056*** -0.051*** (0.032) (0.022) (0.016) (0.015)
Robust standard errors in parentheses. The standard error is calculated using non-parametric bootstrap with 500 replications.
The poverty rate and the urbanization level are both measured in percentage. *** p<0.01, ** p<0.05, * p<0.1.
Source: Authors’ estimations from panel data VHLSSs 2002-2008.
25
This paper examines the effect of urbanization on income, expenditure and poverty of rural households in Vietnam using panel data from VHLSSs 2002, 2004, 2006 and 2008. The main findings show that urbanization tends to reduce agricultural lands of rural households. There are more landless rural households during the process of urbanization and industrialization. Urbanization stimulates the transition from farm to non-farm activities in rural areas. Rural households in high urbanization provinces have lower crop income and livestock income, but higher wages and non-farm income. Urbanization also increases the probability of receiving private transfers. It implies that urbanization can increase rural-urban migration and migrants-sending households receive remittances from their migrants.
The income increase due to higher wages and non-farm incomes is higher than the income decrease due to lower farm income. As a result, urbanization contributes to increase rural household; increase per capita income and per capita expenditure. More specifically, a one percent increase in the share of urban population at the provincial level increases per capita income and per capita expenditure of rural households by around 0.09 percent. Similarly to the case of India (Cali and Menon, 2009), we find that urbanization reduce the expenditure poverty in rural Vietnam, albeit with a small magnitude. A one percentage point increase in the proportion of urban population of provinces results in a 0.05 percentage point reduction in the poverty rate in 2008.
Overall, our analysis suggests that urbanization can increase income and consumption expenditure and reduce poverty of rural households in Vietnam. This finding provides important implications for poverty reduction policies, especially since the poverty reduction pace has been slow in the recent years. In addition to poverty reduction programs targeted to the poor, policies and programs that stimulate the urbanization process and the linkages between urban and rural development can be effective measures to reduce overall as well as rural poverty. Similarly, urbanization can play an important role in rural poverty reduction in other developing countries with similar economic and geographical conditions such as the Philippines, Indonesia, Laos, and Cambodia.
26
References
Acosta, P., C. Calderon, P. Fajnzylber, and H. Lopez. 2007. What is the impact of international remittances on poverty and inequality in Latin America?. World
Development 36(1): 89-114
Actionaid (2009), The impacts of the global economic crisis on migration patterns in Viet Nam”, Research report, Actionaid, Autralisan Government Aid Program, Oxfarm, Hanoi, Vietnam.
Adams, R. 2006. Remittances and poverty in Ghana. World Bank Policy Research Working Paper 3838, The World Bank, Washington, DC.
Adams, R., and Page, J. (2005). Do International Migration and Remittances Reduce Poverty in Developing Countries?. World Development, 33, 1645-1669.
Alam, S., Ambreen F., and Butt. M. S. 2007. “Sustainable Development in Pakistan in the Context of Energy Consumption Demand and Environmental Degradation.” Journal of
Asian Economics, 18 (5): 825–837.
Allen, R. (2009), The British Industrial Revolution in Global Perspective. Cambridge University Press.
Angrist, D. J., and Krueger, A. B. 2001. “Instrumental Variables and the Search for Identification: From Supply and Demand to Natural Experiments.” Journal of Economic
Perspectives, 15(4): 69–85.
Angrist, D. J. 2001. “Estimation of Limited Dependent Variable Models With Dummy Endogenous Regressors: Simple Strategies for Empirical Practice.”, Journal of Business & Economic Statistics, 29(1): 1-28.
Azam, J. P., and Gubert F. (2006). Migrants’ Remittances and the Household in Africa: A Review of Evidence. Journal of African Economies, 15(2), 426-462.
Bairoch, P. (1988), Cities and Economic Development: From the Dawn of History to the
Present, The University of Chicago Press.
Berdegue, J.A., E. Ramirez, T. Reardon, and G. Escobar (2001). Rural nonfarm employment and incomes in Chile, World Development, 29(3), pp. 411-425.
Bertinelli L. and Black D. (2004), “Urbanization and growth”, Journal of Urban Economics 56 (2004) 80–96.
Besley, T. and R. Burgess. 2000. Land reform, poverty reduction, and growth: Evidence from India. Quarterly Journal of Economics, 115 (2): 389-430.
27
Bloom. D., Cunning, D., and Fink, G., 2018. Urbanization and the Wealth of Nations,
Science, 13 February 2008, vol. 319.
Brauw, A. and Harigaya T. 2007. Seasonal migration and improving living standards in Vietnam. American Journal of Agricultural Economics 89(2): 430-447.
Cali, M. and Menon C. (2009), “Does Urbanisation Affect Rural Poverty? Evidence from Indian Districts”, SERC Discussion Paper 14, Spatial Economics Research Centre, the UK.
Cameron, A. C. and P. K. Trivedi (2009), Microeconometric using Stata, Stata Press. Coxhead, I. A. and Warr, P. G., 1991. Technical change, land quality and income distribution: A General equilibrium analysis. American Journal of Agricultural
Economics, 73: 345-60.
Cu C. L. 2005. Rural to urban migration in Vietnam. Chapter 5 in “Impact of Socio-economic Changes on the Livelihoods of People Living in Poverty in Vietnam”, edited by Ha Huy Thanh and Shozo Sakata, Institute of Developing Economies, Japan External Trade Organization.
Dang, A., Goldstein, S. and McNally, J.W. 1997. Internal migration and development in Vietnam. International Migration Review 31(2): 312–337.
Dang, N. A. 2001. Rural labor out-migration in Vietnam: a multi-level analysis. In
Migration in Vietnam-Theoretical Approaches and Evidence From a Survey. Transport Communication Publishing House.
Dang, N. A., C. Tackle and X. T. Hoang. 2003. Migration in Vietnam: A review of information on current trends and patterns, and their policy implications. Paper presented at the Regional Conference on Migration, Development and Pro-Poor Policy Choices in Asia, on 22-24 June 2003 in Dhaka, Bangladesh.
Dang, N. A., Goldstein, S., and Mc Nally, J. 1997. Internal migration and development in Vietnam. International Migration Review 31(2): 312-337.
Datt, G. and Ravallion, M., 1996. How important to India’s poor is the sectoral composition of economic growth. World Bank Economic Review 10 (1): 1-25.
De Janvry, A. 1981. "The Role of Land Reform in Economic Development: Policies and Politics." American Journal of Agricultural Economics 63 (2): 384-92.
Deichmann, U. F. Shilpi and R. Vakis, (2008). Spatial specialization and farm-non-farm linkages, Policy Research Working Paper 4611: The World Bank.
28
Deininger, K., S. Jin and H. K. Nagarajan. 2008. Efficiency and equity impacts of rural land rental restrictions: Evidence from India. European Economic Review 52(5): 892-918. Demery, L. and Squire, L. (1995), Poverty in Africa: an Emerging Picture, Washington, DC, World Bank.
Dollar, D. and Kraay, A. (2000), Growth Is Good for the Poor, Development Research Group, Washington, D.C., World Bank.
Duan, N., Manning, W.G., Moris, C., and Newhouse, J.P., 1983. A comparison of alternative models for the demand for medical care. Journal of Business and Economics
Statistics 1, 115–126.
Fafchamps, M. and F. Shilpi, (2005). Cities and Specialization: Evidence from South Asia, Economic Journal, Vol. 115, April: 477-504.
Fay, M., and Opal. C. 2000. Urbanization without growth: A not-souncommon phenomenon. Policy Research Working Paper, no. 2412: The World Bank.
Finan, F., Sadoulet, E., and De Janvry, A., 2005. Measuring the poverty reduction potential of land in rural Mexico. Journal of Development Economics 77: 27– 51.
Fujita, M., Krugman, P. & Mori, T., 1999. "On the evolution of hierarchical urban systems," European Economic Review, Elsevier, vol. 43(2), 209-251, February.
Gallup, J.L., J.D. Sacks, and A. Mellinger, 1999, Geography and economic development.
International Regional Science Review 22, 179-232.
Glewwe, P (1991). "Investigating the Determinants of Household Welfare in Cote d'Ivoire." Journal of Development Economics 35: 307-37.
Government of Vietnam (2009), Decree No. 42/2009/ND-CP on Classification of Urban Areas in Vietnam, dated on 07/05/2009, Hanoi, Vietnam.
Greene, W. (2004), “Fixed effects and bias due to the incidental parameters problem in the Tobit model”, Econometric Reviews 23(2), 125 – 147.
GSO (2010), Phương án điều tra biến động dân số và kế hoạch hoá gia đình 1/4/2010 (The plan to conduct Population Change and Family Planning Survey 1/4/2010), General Statistics Office of Vietnam, Hanoi, Vietnam.
GSO (2011), “Migration and Urbanization in Vietnam: Patterns, Trends and Differentials”, Monograph, General Statistics Office of Vietnam (GSO), Hanoi, Vietnam. Haggblade, S., Hazell, P., and Reardon, T. (2010), The Rural Non-farm Economy: Prospects for Growth and Poverty Reduction, World Development, Volume 38, Issue 10, 1429-1441.
29
Harris, R. and Todaro, P. (1970), "Migration, Unemployment and Development: A Two-Sector Analysis", American Economic Review 60 (1): 126–142
Henderson, V. (2003), “The Urbanization Process and Economic Growth: The So-What Question”, Journal of Economic Growth, Vol. 8(1), 47-71.
Henderson, V. (2003), “Urbanization and Economic Development”, Annals of Economics
and Finance, 4, 275-241.
Hentschel, J., Lanjouw, J., Lanjouw, P. and Poggi, J., 2000. “Combining census and survey data to trace the spatial dimensions of poverty: a case study of Ecuador”, World
Bank Economic Review, Vol. 14, No. 1: 147-65.
Krugman, P., 1991, Increasing returns and economic geography. Journal of Political
Economy 99, 483-99.
Lewis, W. A., 1954. “Economic development with unlimited supplies of labour.” The
Manchester School 22: 139-191.
Manning, W.G., Duan, N., and Rogers, W.H., 1987. Monte Carlo evidence on the choice between sample selection and two-part models. Journal of Econometrics 35, 59–82. Martinez-Vazquez, J., Panudulkitti P., and Timofeev A. (2009), “Urbanization and the Poverty Level”, Working Paper 09-14, Andrew Young School of Policy Studies, Georgia State University.
McKenzie, D. and Sasin M. 2007. Migration, remittances, poverty, and human capital: conceptual and empirical challenges. Policy Research Working Paper 4272, The World Bank.
Nguyen V. C. & Tran N. T. and Roy V. D. W., 2010. "Poverty and Inequality Maps in Rural Vietnam: An Application of Small Area Estimation," Asian Economic Journal, vol. 24(4), pages 355-390
Nguyen, C., and Tran, A. (2013), “The effect of crop land on poverty reduction: Evidence from Vietnam” with Tran Ngoc Anh, European Review of Agricultural Economics, doi: 10.1093/erae/jbt032.
Nguyen, C., Van den Berg M., and R. Lensink (2013), “The Impacts of International Remittances on Income, Work Efforts, Poverty and Inequality: New Evidence for Vietnam”, a chapter in book "Banking the World: Empirical Foundations of Financial Inclusion" edited Robert J. Cull, Asli Demirguc-Kunt and Jonathan Morduch, the World Bank and MIT Press.