HAL Id: hal-00867132
https://hal.archives-ouvertes.fr/hal-00867132
Preprint submitted on 27 Sep 2013HAL is a multi-disciplinary open access archive for the deposit and dissemination of sci-entific research documents, whether they are pub-lished or not. The documents may come from teaching and research institutions in France or abroad, or from public or private research centers.
L’archive ouverte pluridisciplinaire HAL, est destinée au dépôt et à la diffusion de documents scientifiques de niveau recherche, publiés ou non, émanant des établissements d’enseignement et de recherche français ou étrangers, des laboratoires publics ou privés.
The persistence of firms’ knowledge base: A quantile
approach to Italian data
Alessandra Colombelli, Francesco Quatraro
To cite this version:
Alessandra Colombelli, Francesco Quatraro. The persistence of firms’ knowledge base: A quantile approach to Italian data. 2013. �hal-00867132�
1
The persistence of firms’ knowledge base: A quantile approach to
Italian data
1Alessandra Colombellia,b,c and Francesco Quatraro*a,c
a) University of Nice Sophia Antipolis, GREDEG-CNRS, 250 rue Albert Einstein, 06560 Valbonne, France
b) DISPEA, Politecnico di Torino, Corso Duca degli Abruzzi 24, 10129 Torino, Italy c) BRICK, Collegio Carlo Alberto, Via Real Collegio 30, 10024 Moncalieri (Torino), Italy
ABSTRACT.
The paper investigates the patterns of persistence of innovation and of the properties of firms’ knowledge base (KB) across a sample of Italian firms in the period 1998-2006. The analysis draws upon a theoretical representation of knowledge as a collective good, stemming from the recombination of knowledge bits that are fragmented and dispersed across economic agents. On this basis, we derived properties of the KB like the coherence, the cognitive distance and the variety, and investigated their patterns of persistence over time. The empirical analysis is implemented by exploring the autocorrelation structure of such properties within a quantile regression framework. The results suggest that the properties of knowledge are featured by somewhat peculiar patterns as compared to knowledge stock, and that such evidence is also heterogeneous across firms in different quantiles.
JEL Classification Codes: L20, L10, 032
Keywords: Persistence; Innovation; Knowledge Coherence; Variety; Cognitive Distance; Quantile regression; autocorrelation
* Corresponding address: 250, rue Albert Einstein, 06560 Valbonne (France). Ph.: +33 4 93 95 43 73. Email: [email protected].
1
A preliminary version of this paper has been presented at the Workshop “Un decennio perduto? Come
innescare la competitività del sistema produttivo italiano”, held in Trento on the 6th and 7th Dedember 2011,
and at the SEIK seminar series organized by the BRICK at the Collegio Carlo Alberto on the 30th May 2012. We
are particularly grateful to Antonio Accetturo, Cristiano Antonelli, Marco Guerzoni, Fabio Montobbio and Giuseppe Scellato for their insightful comments. The authors also acknowledge the financial support of the European Union D.G. Research with the Grant number 266959 to the research project ‘Policy Incentives for the Creation of Knowledge: Methods and Evidence’ (PICK-ME), within the context Cooperation Program / Theme 8 / Socio-economic Sciences and Humanities (SSH) and of the Collegio Carlo Alberto with the framework of the research project IPER. We wish to thank Second Rolfo for making the access to the Bureau Van Dijk AIDA dataset at the CERIS-CNR possible.
2
1 Introduction
The issue of innovation persistence has attracted increasing attention in the last decades, following the seminal contribution by Geroski et al. (1997). The idea that innovation activities are featured to some extent by dynamic increasing returns made possible by learning and creative accumulation has shaped this stream of literature.
The extant empirical analyses have been based on the use of proxies like the introduction of product or process innovation drawn from innovation surveys or firms’ patenting activity, showing that actually there is a degree of persistence in innovative activities. The use of patenting activity however allows to grasping the phenomenon of the persistence in the generation of technological knowledge from a quantitative viewpoint, but does not allow to dig into qualitative issues concerning the nature of the knowledge base (KB).
In this paper we propose to extend the analysis of persistence of innovation by focusing on the properties of the KB underlying the introduction of technological innovation. We adopt a collective approach to technological knowledge, according to which new knowledge emerges out of the recombination of knowledge inputs fragmented and dispersed in the economic environment (Weitzmann, 1998; Fleming, 2001; Saviotti, 2004 and 2007; Quatraro, 2012). This opens up different methodological avenues to the implementation of synthetic indicators to describe the properties of KB at different levels of analysis.
The study conducted in this paper is based on the analysis of the co-occurrence of technological classes within patent documents, which allow to providing operational translation to concepts like knowledge variety, coherence and cognitive distance. These can be thought as featuring properties of firms’ KB, which are closely related to firms’ innovative performances (Nesta and Saviotti, 2005). In this perspective the persistence of knowledge properties appears to be different and yet highly complementary to the persistence of innovation.
The investigation of persistence patterns (or the absence thereof) is carried out on a sample of Italian firms observed between 1998 and 2006. We analyze the serial autocorrelation of growth rates of such properties, looking at the first three lags. We also implement quantile regression analyses to see if persistence patterns changes across the distribution of sampled firms. The results suggest that, while innovation shows a great deal of persistence, the properties of firms’ KB are more likely to be characterized by negative autocorrelation, which is to say alternation of high-growth and slowdown periods. This evidence is even more marked for those firms characterized by dramatically low or exceptionally high growth rates.
The rest of the paper is organized as follows. Section 2 provides a short review of the literature on persistence and proposes its grafting onto a collective knowledge framework. Section 3 presents the data and discusses the methodology. In Section 4 we show and discuss the empirical results of econometric estimations. Finally Section 5 provides some preliminary conclusions and avenue for further research.
3
2 Persistence of Innovation and Knowledge Structure
The persistence of innovation activities has been the object of the analysis of a large body of literature in the last decade, both from a theoretical and empirical viewpoint. The main theoretical underpinnings lie in the concepts of cumulativeness and technological learning. According to neo-Schumpeterians, knowledge accumulation and technological learning account for the main forces leading to innovation persistence. Schumpeter himself distinguished between two different patterns of innovations (Schumpeter, 1912 and 1942). On the one hand, in the ‘creative destruction’ dynamics knowledge is conceived as a free good and, thus, all the firms can fish in the same pool of accessible technologies. As a consequence, new innovators introduce new technology while old innovators rest stuck in old innovation. On the other hand, the pattern of ‘creative accumulation’ emphasizes the cumulative nature of technological change. Knowledge is created and accumulated within firms. This builds high barriers to entry and, as a consequence, established large firms become key actors in the process of technological change. Within this framework success breeds success, current innovation is explained by past innovation and, thus, innovation is persistent (Alfranca et al., 2002).
In evolutionary theory, the persistence of innovation activities stems from competition and selection mechanisms. In this view, the accumulation of knowledge and learning dynamics lead to the formation of firm-specific routines that may generate a stable pattern of economic activities. Yet, the inertia stemming from routines can be counteracted by dynamic forces like technological competition and innovation that push the economic system towards evolution (Nelson and Winter’s, 1982). As a consequence, firms that survive to the market competition are those that persistently implement new techniques and introduce new ideas, which, in turn, increase their profitability and market share. Thus, the selection mechanism that pushes firms to persistently rely on innovation is a function of their internal competencies, technological capability and profitability.
A recent strand of literature has attempted to empirically analyze the persistence of innovation. It is possible to distinguish two main lines of research in this area. A first set of studies aims at analyzing the persistence in the introduction of innovation trying to understand whether innovators have a stronger probability than non-innovators to keep innovating. In particular, these empirical works focus on the determinants and the features of the persistency by observing firms’ patenting activity over time (Geroski et al., 1997, Malerba et al. 1997, Cefis and Orsenigo 2001, Cefis 2003, Alfranca et al., 2002) or the introduction of product and process innovation as revealed by innovation surveys repeated over time (Peters 2009, Raymond et al. 2006, Roper and Hewitt-Dundas 2008). These works, explicitly or implicitly, are based on the dynamic capabilities theory (Teece and Pisano 1994) and refer to the idea that technical change builds upon accumulated competencies and that new knowledge are generated by what has been learned in the past. A second set of studies examines persistency in the effects of innovation rather than the persistence of innovation per se (Cefis and Ciccarelli 2005). These works build upon the idea that the stream of profits generated by past innovation gives firms the opportunity to keep innovating and confirm that the impact of innovation on performance is cumulative and long lasting (Antonelli et al., 2012).
4
While the theoretical and empirical literature on the subject has much focused on the importance of internal technological capabilities and financial resources for the persistence of innovation, less attention has been paid to the collective and systemic nature of knowledge creation (Colombelli and von Tunzelmann, 2011). In particular, the focus on innovation as a simple count of the patents a firm has applied for, or as the count of product or process innovations introduced by firms, limits the scope of the analysis to the intensity of the innovation effort, but it does not say anything about the properties of the technological knowledge generated and the underpinning search strategies. The emphasis on patent counts, or on any kind of knowledge stock measure, has the undesirable disadvantage of implying a representation of technological knowledge as a homogeneous stock, as if it were the outcome of a quite uniform and fluid process of accumulation made possible by R&D investments, the same way as capital stock (Griliches, 1979; Mansfield, 1980). Such kind of representation is however hardly useful to investigate the nature of firms’ search strategies, as it only allows for evaluating it from a quantitative rather than a qualitative viewpoint.
On the contrary there is a large consensus in the literature on the fact that knowledge technological knowledge can be depicted as an outcome of a collective undertaking strongly influenced by the availability of local sources of knowledge and by the quality of interactions (Allen, 1983; von Hippel 1988; Antonelli, 1999). The collective knowledge approach implies therefore the existence of agents characterized by bounded rationality, which cannot have the full command of the whole knowledge space, and therefore need to access knowledge dispersed and fragmented in the economic system in order to feed the combinatorial dynamics leading to the production of new knowledge (von Hayek, 1945).
In this perspective, more recently an increasingly share of scholars in the economics of innovation has elaborated theoretical approaches wherein the process of knowledge production is viewed as the outcome of a recombination process (Weitzmann, 1998; Kauffman, 1993). The creation of new knowledge is represented as a search process across a set of alternative components that can be combined one another. A crucial role is played here by the cognitive mechanisms underlying the search process aimed at exploring the knowledge space so as to identify the pieces that might possibly be combined together. The set of potentially combinable pieces turns out to be a subset of the whole knowledge space. Search is supposed to be local rather than global, while the degree of localness appears to be the outcome of cognitive, social and technological influences (Nightingale, 1998; Fleming, 2001).
Firms’ KB can be accordingly understood as a network of interacting elements, say technological competences. Both the links and the properties of the nodes provide useful information to qualify their combinatorial strategies (Quatraro, 2012). A synthetic, although partial, representation of the internal structure of the KB can be built by drawing upon the frequency with which two technologies are combined together in the firms’ KB (Colombelli et al., 2013a and b). Basically, this characterization takes into account the average degree of complementarity and similarity of the technologies which the KB is made of, as well as the variety of the observed pairs of technologies that lead us to derive three main properties of knowledge structure at a general level:
Variety is related to the technological differentiation within the KB, in particular with respect to the diverse possible combinations of pieces of knowledge in the sector, from the creation
5
of a radically new type of knowledge to the more incremental recombination of already existing types of knowledge.
Coherence can be defined as the extent to which the pieces of knowledge that agents within the sector combine to create new knowledge are complementary one another.
Similarity (or dissimilarity) refers to the extent to which the pieces of knowledge used in the sector are close one another in the technology space.
The dynamics of technological knowledge can therefore be understood as the patterns of change in its properties, i.e. in the patterns of recombination across the elements in the knowledge space. In other words, the investigation of such properties of the KB provides an interesting implementation of the idea of architectural change (Henderson and Clark, 1990) applied to the analysis of knowledge dynamics. Moreover, this approach captures both the cumulative character of knowledge creation and the possible link to the relative stage of development of a technological trajectory (Dosi, 1982; Saviotti, 2004 and 2007; Krafft et al. 2009 and 2011).
The persistence of the properties of firms’ KB is different from, and yet complementary to the persistence of innovation. Firms’ innovative performances are indeed affected by the characteristics of the their KB (Nesta and Saviotti, 2005; Antonelli and Colombelli, 2013). These latter are however more related to the ability by which firms can, or intend to, perseverate in pursuing a given search strategy, be it of ‘exploration’ or ‘exploitation’ (March, 1991).
Following this distinction, Levinthal and March (1993) and Tushman and O’Reilly (1996) have emphasized the need to maintain an appropriate balance between exploration and exploitation in firms’ search strategies. The so-called ‘ambidexterity’ hypothesis stemming from these contributions suggests that from the firm’s viewpoint too much exploration or too much exploitation may hinder the generation of new technological knowledge. This is also consistent with Noteboom’s notion of optimal cognitive distance (Nooteboom, 2000). Actually on the one hand the productivity of innovation activities is affected by the degree of variety, coherence and similarity of firms’ KB. The higher the coherence, the more efficient the recombination process. However, excessive coherence may reduce the scope for identification of new technological opportunities. Similar arguments may apply to similarity and variety. On the other hand, the marginal cost of technological knowledge is likely to decrease as coherence increases. However, also in this case, excessive coherence may jeopardize the knowledge generation process so as to require the commitment of further resources, reducing the pace at which they decrease. In this direction, rather than aiming at persistently increasing coherence, similarity and variety, firms’ would be better off by counterbalancing rapid growth periods with subsequent periods of decrease.
Our basic research question in this direction is to what extent the firms’ KB is characterized by persistent integration or variety. By exploring the autocorrelation structure of the growth rates of knowledge properties, we investigate the extent to which these appear to be characterized by self-enforcing rather than cyclical dynamics.
We also wonder whether some differential behaviors can be detected featuring high-growing (in terms of knowledge properties) from low-growing firms. For example, a firm showing a faster growth rate of internal coherence of its KB is one that explores the knowledge space in the domain of complementary technologies, profiting from the exploitation of the cumulated technological competences. The investigation of the persistence of coherence may therefore help understanding
6
whether increasing coherence is a self-enforcing dynamics or it is preceded by former exploration activities in which many different alternatives are tried and eventually discarded by selecting only those with higher fitness values.
Similarly, we can gain better understanding of the dynamics by which firms develop their KB by increasing the average degree of similarity or amongst the technologies in their portfolios or their variety. In this perspective, we turn now to describe the data and the methodology we will use to provide an operational definition of the properties of knowledge structure and to investigate their persistence over time.
3 Data and Methodology
3.1 The dataset
The dataset used in this paper is an unbalanced panel of Italian firms that applied for a patent on the period 1998-2006. The dataset has been obtained by merging three sources of information. First of all, the PATSTAT database (April 2011) contains detailed information on worldwide patent applications to the European Patent Office2. This information is crucial to implement the properties of knowledge structure that will be described in what follows. Secondly we obtained information on Italian firms by the Bureau Van Dijk AIDA dataset. Finally, we used the harmonized matching tables described by Thoma et al. (2010) to combine the EPO and the AIDA datasets on the basis of the Bureau Van Dijk firm identification code.
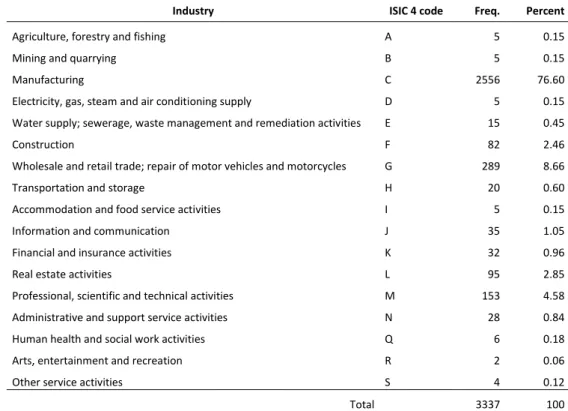
Our final sample consists of 3,499 active firms having applied for more than a patent at the EPO in the period under scrutiny. Table 1 shows the distribution of firms across ISIC 4 macro sectors. Quite in line with expectations, the bulk of the sample operates within the manufacturing sector (about 77%). Besides manufacturing, ‘Wholesale and retail trade’ and ‘Professional, scientific and technical activities’ sectors also show relatively high shares, i.e. 8.66% and 4.58% respectively. Table 2 shows instead the size distribution of sampled firms3. Also in this case the evidence is hardly surprising, as most of the firms can be classified as small firms (about 39%). If one sums up the figures about the first three size classes, we obtain that about the 76% of the sampled firms operates at a scale that characterizes them as small-medium sized.
>>> INSERT Table 1 AND Table 2 ABOUT HERE <<<
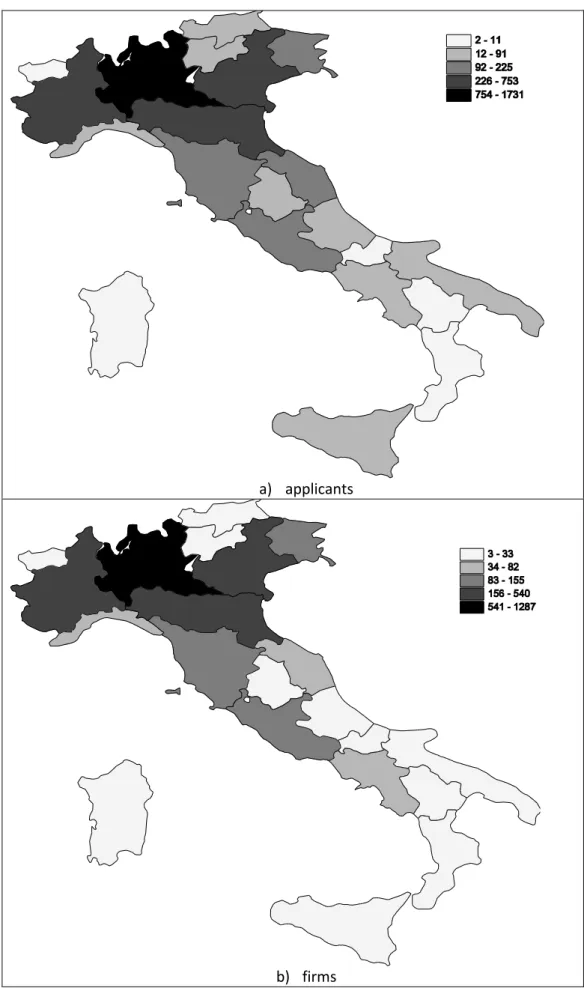
In Figure 1 we finally show the geographical distribution of firms. It is quite evident that the large majority of both firms and applicants is in Northern regions. The Lombardy region shows the highest
2
The limits of patent statistics as indicators of technological activities are well known. The main drawbacks can be summarized in their sector-specificity, the existence of non patentable innovations and the fact that they are not the only protecting tool. Moreover the propensity to patent tends to vary over time as a function of the cost of patenting, and it is more likely to feature large firms (Pavitt, 1985; Griliches, 1990). Nevertheless, previous studies highlighted the usefulness of patents as measures of production of new knowledge. Such studies show that patents represent very reliable proxies for knowledge and innovation, as compared to analyses drawing upon surveys directly investigating the dynamics of process and product innovation (Acs et al., 2002). Besides the debate about patents as an output rather than an input of innovation activities, empirical analyses showed that patents and R&D are dominated by a contemporaneous relationship, providing further support to the use of patents as a good proxy of technological activities (Hall et al., 1986).
3
The total number of firms in Table 2 is slightly higher than that in Table 1 as the industrial classification field contains some missing values.
7
number of innovating firms, followed by Piedmont, Emilia-Romagna and Veneto. Friuli Venezia-Giulia and two central regions, i.e. Lazio and Tuscany fall instead in the median class.
>>> INSERT Figure 1 ABOUT HERE <<<
The general picture that emerges from this preliminary exploration of the dataset is that the sample is mostly composed of small or medium-sized firms, active in the manufacturing sectors and located in the Northern regions of Italy. The following section will introduce the indicators proxying for the properties of the knowledge structure of the firms that are the object of our analysis.
3.2 The Implementation of Knowledge Indicators
For what concerns the definition of the knowledge related variables, let us start by the traditional firm’s knowledge stock. This is computed by applying the permanent inventory method to patent applications. We calculated it as the cumulated stock of past patent applications using a rate of obsolescence of 15% per annum: , ,
(
1
)
,1
it it t ih
E
E
, where hi,t is the flow of patent applications and δ is the rate of obsolescence4. The investigation of the persistence of the knowledge stock allows to linking the results of our analysis to the existing literature on innovation persistence. However, the generation of new technological knowledge entails not only a quantitative phenomenon. In order to dig into the nature of the KB, we propose to calculate a number of indicators based on the information contained in patent documents.
The implementation of knowledge characteristics proxying for variety, coherence and similarity, rests on the recombinant knowledge approach. In order to provide an operational translation of such variables one needs to identify both a proxy for the bits of knowledge and a proxy for the elements that make their structure. For example one could take scientific publications as a proxy for knowledge, and look either at keywords or at scientific classification (like the JEL code for economists) as a proxy for the constituting elements of the knowledge structure. Alternatively, one may consider patents as a proxy for knowledge, and then look at technological classes to which patents are assigned as the constituting elements of its structure, i.e. the nodes of the network representation of recombinant knowledge. In this paper we will follow this latter avenue5. Each technological class j is linked to another class m when the same patent is assigned to both of them. The higher is the number of patents jointly assigned to classes j and m, the stronger is this link. Since technological classes attributed to patents are reported in the patent document, we will refer to the link between j and m as the co-occurrence of both of them within the same patent document6. On this basis we calculated the following characteristics of firms’ KB (firm related subscripts are omitted for the sake of clarity).
4
Different depreciation rates have been implemented, which provided basically similar results.
5 See Strumsky et al. (2012) for a compressive discussion on the use of patents technological classes to study
technological change.
6
It must be stressed that to compensate for intrinsic volatility of patenting behaviour, each patent application is made last five years.
8
3.2.1 Knowledge variety measured by the informational entropy index
Knowledge variety is measured using the informational entropy index. Entropy measures the degree of disorder or randomness of the system; systems characterized by high entropy are characterized by high degrees of uncertainty (Saviotti, 1988). The entropy index measures variety. Information entropy has some interesting properties (Frenken and Nuvolari, 2004) including multidimensionality. Consider a pair of events (Xl, Yj), and the probability of their co-occurrence plj. A two dimensional total variety (TV) measure can be expressed as follows:
l j lj ljp
p
Y
X
H
TV
(
,
)
log
21
(1)Let the events Xl and Yj be citation in a patent document of technological classes l and j respectively.
Then plj is the probability that two technological classes l and j co-occur within the same patent. The measure of multidimensional entropy, therefore, focuses on the variety of co-occurrences or pairs of technological classes within patent applications.
The total index can be decomposed into ‘within’ and ‘between’ parts whenever the events being investigated can be aggregated into a smaller number of subsets. Within-entropy measures the average degree of disorder or variety within the subsets; between-entropy focuses on the subsets, measuring the variety across them.
It can be easily shown that the decomposition theorem holds also for the multidimensional case (Frenken and Nuvolari, 2004). Let the technologies i and j belong to the subsets g and z of the classification scheme respectively. If one allows lSg and jSz (g = 1,…,G; z = 1,…, Z), we can write:
g Z S l jS lj gzp
P
(1a) Which is the probability to observe the couple lj in the subsets g and z, while the intra subsets variety can be measured as follows:
g z S l jS lj gz 2 gz lj gz/P
p
1
log
P
p
H
(1b) The (weighted) within-group entropy can be finally written as follows:9
G 1 g Z 1 z gz gzH
P
RTV
(2)Between group (or unrelated variety) can instead be calculated by using the following equation:
G 1 g Z 1 z gz 2 gz QP
1
log
P
H
UTV
(3)According to the decomposition theorem, we can rewrite the total entropy H(X,Y) as follows:
G g Z z gz gz QP
H
H
TV
1 1 (4) When considering the International Patent Classification (IPC), the whole set of technological classes can be partitioned on the basis of macro technological fields. For example, two 4-digit technologies A61K and H04L belong respectively to the macro classes A and H. In our notation, H04L would be the technology l and H the macroset Sg. Similarly A61K would be the technology j and A the macroset Sz.Within-group entropy (or related variety) measures the degree of technological differentiation within the macro-field, while between-group variety (or unrelated variety) measures the degree of technological differentiation across macro-fields. The first term on the right-hand-side of equation (2) is the between-entropy, the second term is the (weighted) within-entropy.
We can label between- and within-entropy respectively as unrelated technological variety (UTV) and related technological variety (RTV), while total information entropy is referred to as general technological variety (Frenken et al., 2007). This means that we consider variety as a global entity, but also as a new combination of existing bits of knowledge versus variety as a combination of new bits of knowledge. When variety is high (respectively low), this means that the search process has been extensive (respectively partial). When unrelated variety is high compared to related variety, the search process is based essentially on the combination of novel bits of knowledge rather than new combinations of existing bits of knowledge.7
7 It must be noted that by measuring the degree of technological differentiation, the calculation of information
entropy is affected by the number of technological classes observed, but not necessarily by the number of technological classes in the classification itself. Indeed, the introduction of new technological classes that are not observed does not affect the calculations in that they would be events with zero probability. Entropy rises or falls according to the number of technological classes that are actually observed in the patent sample. It reaches the maximum if all events are equiprobable, i.e. if all technological classes show the same relative frequency. If probabilities are unevenly distributed, one can have very low values of information entropy even if a very large number of technologies is observed.
10
3.2.2 The knowledge coherence index
Firms need to combine or integrate many different pieces of knowledge to produce a marketable output. Competitiveness requires new knowledge and knowledge about how to combine old and new pieces of knowledge. We calculate the coherence of the KB, defined as the average relatedness or complementarity of a technology chosen randomly within the sector with respect to any other technology (Nesta and Saviotti, 2006; Nesta, 2008)8.
Obtaining the knowledge coherence index requires a number of steps. We describe how to obtain the index at sector level. First of all, we need to calculate the weighted average relatedness WARl of technology l with respect to all other technologies in the sector. This measure builds on the measure of technological relatedness lj (Nesta and Saviotti, 2005, 2006). We start by calculating the relatedness matrix. The technological universe consists of k patent applications. Let Plk = 1 if the patent k is assigned the technology l [l= 1, …, n], and 0 otherwise. The total number of patents assigned to technology l is Ol
kPlk. Similarly, the total number of patents assigned to technology j is
k jk
j P
O . Since two technologies can occur within the same patent,
j
l O
O , and thus the observed the number of observed co-occurrences of technologies l and j is Jlj
kPlkPjk.. Applying this relationship to all possible pairs yields a square matrix (n n) in which the generic cell is the observed number of co-occurrences:
8 The function used to measure coherence is completely different from the one used to measure informational
entropy. The fact that in both cases the co-occurrence of technological classes enters the calculations does not mean that both functions must lead to the same result. The informational entropy function measures the variety of the set, corresponding to the number of distinguishable entities it contains. The coherence function was introduced by Teece et al (1994) to measure the coherence of a firm based on its products. Nesta and Saviotti (2005, 2006) have subsequently adapted it to measure the coherence of the knowledge base of a firm. The coherence function measures the extent to which the distinguishable entities in the set (in our case the types of knowledge corresponding to different technological classes) are used together irrespective of the number of entities contained in the set. The two functions are in principle independent since they use the same type of data to calculate different properties of the same system. The mathematical independence of the two functions does not imply that the evolution of the corresponding properties is independent. Thus, if new technological classes are introduced into the knowledge base of a sector (an increase in the number of distinguishable entities of the set) there is no reason to expect the capacity of firms to combine the new types of knowledge to be created instantly. We expect that as new types of knowledge are introduced into the knowledge base of a sector, the firms will slowly learn to combine them thus leading to a temporary fall in coherence.
11 nn n nj lj j n l J J J J J J J J J ln 1 1 1 1 11 (5)
We assume that the number xij of patents assigned to technologies i and j is a hypergeometric random variable of the mean and variance:
K
O
O
x
X
E
lj i j lj
(
)
(6)
1
2K
O
K
K
O
K
l j lj lj
(7)If the observed number of co-occurrences Jij is larger than the expected number of random co-occurrences ij, then the two technologies are closely related: the fact that the two technologies occur together in the number of patents xij is not common or frequent. Hence, the measure of relatedness is given by the difference between the observed and the expected numbers of co-occurrences, weighted by their standard deviation:
lj lj lj lj J
(8)Note that this measure of relatedness has no lower or upper bounds:
lj
;
. Moreover, theindex shows a distribution similar to a t-test, so that if
lj
1.96;1.96
, we can safely assume thenull hypothesis of non-relatedness of the two technologies i and j. The technological relatedness matrix ’ can be considered a weighting scheme to evaluate the technological portfolio in the technological region.
Following Teece et al. (1994), WARl is defined as the degree to which technology l is related to all other technologies jl in the firm’s patent portfolio, weighted by patent count Pjt:
l j jt l j lj jt ltP
P
τ
WAR
(9)12
Finally the coherence of the firm’s KB at time t is defined as the weighted average of the WARlt measure:
l l lt lt lt tP
P
WAR
R
(10)Note that this index implemented by analysing the co-occurrence of technological classes within patent applications, measures the degree to which the services rendered by the co-occurring technologies are complementary, and is based on how frequently technological classes are combined in use. The relatedness measure lj indicates that utilization of technology l implies use also of technology j in order to perform specific functions that are not reducible to their independent use. This makes the coherence index appropriate for the purposes of this study and marks a difference from entropy, which measures technological differentiation based on the probability distribution of pairs of technological classes across the patent sample9.
If the coherence index is high, this means that the different pieces of knowledge have been well combined or integrated during the search process. Due to a learning dynamics, the actors in the sector have increased capability to identify the bits of knowledge that are required jointly to obtain a given outcome. In a dynamic perspective, therefore, increasing values for knowledge coherence are likely to be associated with profitable technological opportunities, typical of the exploitation stage in the technological life cycle, in which search behaviours are driven mostly by organized search within well identified areas of the technological landscape. Conversely, decreasing values of knowledge coherence are likely to be related to the exploration stage in the technological lifecycle, when search behaviour is driven mostly by random screening across untried areas of the technological landscape in the quest for new and more profitable technological trajectories.
9
To make it clear, informational entropy is a diversity measure which allows to accounting for variety, i.e. the number of categories into which system elements are apportioned, and balance, i.e. the distribution of system elements across categories. (Stirling, 2007). In this sense entropy does not say anything about the relationships between technological classes, but provides a measure of the diversity of technological co-occurrences, suggesting whether in a sector most of the observed co-occurrences focus on a specific couple or on the contrary whether the observed co-occurrences relate to a large number couples. In this framework, related and unrelated variety provide a measure of the extent to which observed variety applies to couples of technologies that belong to the same macro domain or to different macro-domains. One would expect established technologies to be characterized by relatively low variety of co-occurrences, insofar as the recombination focus on a relatively small numbers of technological classes that have proved to be particularly fertile. On a different ground, the coherence index is based on a normalized measure of how much each observed technology is complementary to all other technologies in the analyzed patents. In this sense it cannot be understood as a measure of diversity. The relatedness index indeed provides a measure of the degree to which two technologies are actually jointly used as compared to the expected joint utilization. The index allows to establishing a relationship of complementarity between the technologies in the analyzed patents. Based on the relatedness measure (tau), the coherence index provides an aggregate description of the degree to which the observed technologies in a given sector are complementary to one another.
13
3.2.3 The cognitive distance index
We need a measure of cognitive distance (Nooteboom, 2000) to describe the dissimilarities among different types of knowledge. A useful index of distance can be derived from technological proximity proposed by Jaffe (1986, 1989), who investigated the proximity of firms’ technological portfolios. Breschi et al. (2003) adapted this index to measure the proximity or relatedness between two technologies10.
Let us recall that Plk = 1 if the patent k is assigned the technology l [l= 1, …, n], and 0 otherwise. The total number of patents assigned to technology l is Ol
kPlk. Similarly, the total number of patents assigned to technology j is
k jk
j P
O . We can, thus, indicate the number of patents that are classified in both technological fields l and j as: 𝑉𝑙𝑗 = 𝑃𝑘 𝑙𝑘𝑃𝑗𝑘. By applying this count of joint
occurrences to all possible pairs of classification codes, we obtain a square symmetrical matrix of co-occurrences whose generic cell Vlj reports the number of patent documents classified in both
technological fields l and j.
Technological proximity is proxied by the cosine index, which is calculated for a pair of technologies l and j as the angular separation or uncentred correlation of the vectors Vlm and Vjm. The similarity of technologies l and j can then be defined as follows:
n 1 2 j n 1 2 l n 1 l j lj V V V V S m m m m m m m (11)The idea behind the calculation of this index is that two technologies j and l are similar to the extent that they co-occur with a third technology m. Such measure is symmetric with respect to the
10 Cognitive distance is the inverse of similarity or the equivalent of dissimilarity. The measure of similarity has
been introduced by biologists and ecologists to measure the similarity of biological species and to understand to what extent they could contribute to biodiversity. The same measure has been applied by Jaffe (1986) to the similarity of technologies. It is not the only possible measure of similarity but it is the most frequently used one. The rational for its use is starts from the assumption that when two technologies, i and j, can be combined with a third technology k, they are similar. We call this measure cognitive distance both because the two terms are used as synonyms in the biological literature and, even more so, because cognitive distance is a concept used by Bart Nooteboom (2000) which has a number of very interesting implications for firm behavior and performance. In particular, the cognitive distance between different firms is expected to affect the probability that they form technological alliances. Intuitively, the need for a firm to learn a completely new technology (discontinuity) will lead to the incorporation into the firm's knowledge base of new patent classes, which would make the knowledge base recognizably different from what it was at previous times. The dissimilarity of the knowledge base can be expected to keep rising with respect to the pre-discontinuity knowledge base until the technology lifecycle has achieved maturity, at which stage the knowledge base of the firm will have stabilized, thus leading to a fall in cognitive distance.
14
direction linking technological classes, and it does not depend on the absolute size of technological field. The cosine index provides a measure of the similarity between two technological fields in terms of their mutual relationships with all the other fields. Slj is the greater the more two technologies l and j co-occur with the same technologies. It is equal to one for pairs of technological fields with identical distribution of co-occurrences with all the other technological fields, while it goes to zero if vectors Vlm and Vjm are orthogonal (Breschi et al., 2003)11. Similarity between technological classes is thus calculated on the basis of their relative position in the technology space. The closer technologies are in the technology space, the higher is Slj and the lower their cognitive distance (Engelsman and van Raan, 1994; Jaffe, 1986; Breschi et al., 2003).
The cognitive distance between j and l can be therefore measured as the complement of their index of technological proximity:
lj
lj 1 S
d (12)
Having calculated the index for all possible pairs, it needs to be aggregated at the industry level to obtain a synthetic index of technological distance. This is done in two steps. First we compute the weighted average distance of technology l, i.e. the average distance of l from all other technologies.
l j jt l j lj jt ltP
P
d
WAD
(13)where Pj is the number of patents in which the technology j is observed. The average cognitive distance at time t is obtained as follows:
l l lt lt lt tP
P
WAD
CD
(14)The cognitive distance index measures the inverse of the similarity degree among technologies. When cognitive distance is high, this is an indication of the increased difficulty or cost the firm faces to learn the new type of knowledge which is located in a remote area of the technological space. Increased cognitive distance is related to the emergence of discontinuities associated with paradigmatic shifts in the firms’ KB. It signals the combination of core technologies with unfamiliar technologies.
11 For Engelsman and van Raan (1994), this approach produces meaningful results particularly at a ‘macro’ level,
i.e. for mapping the entire domain of technology. An alternative approach to calculating technological proximity can be found in Sorenson and Singh (2007).
15
3.2.4 Scope of the KB
The scope of the KB (KScope) is measured by the number of IPC technology classes in which a firm has applied patents. Let the technological universe consist of m technological classes, and let Zm,t = 1
if firm i has applied at least one patent assigned to technology m at time t, 0 otherwise. The scope of firms’ KB is defined as:
m mt
t Z
KScope , (15)
While informational entropy accounts for both variety, i.e. the number of observed categories, and balance, i.e. the distribution of patents across the categories, knowledge scope accounts only for variety (Stirling, 2007).
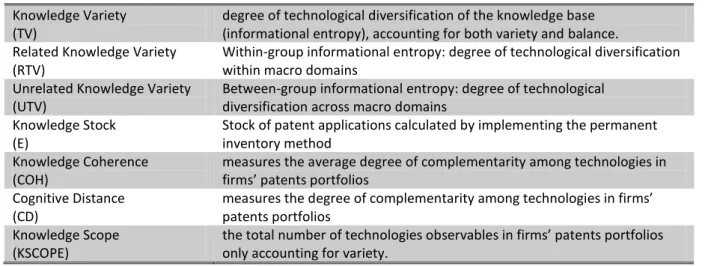
In Table 3 we provide a synthesis of the variables definitions.
>>> INSERT Table 3 ABOUT HERE <<<
The adoption of these variables marks an important step forward in the operational translation of knowledge creation processes. In particular, they allow for a better appreciation of the collective dimension of knowledge dynamics. Knowledge is indeed viewed as the outcome of a combinatorial activity in which intentional and unintentional exchange among innovating agents provides the access to external knowledge inputs (Fleming and et al., 2007). In other words these measures allow for featuring the innovation behaviour of firms, as well as its evolution. In this perspective, an increase in knowledge coherence is likely to signal the adoption of an exploitation strategy, while a decrease is linked to exploration strategies. Increasing values of cognitive distance are instead related to random screening across the technology landscape, while decreasing cognitive distance is more likely to be linked to organized search behaviour. Knowledge variety is likely to increase in any case when new combinations are introduced in the system. However the balance between related and unrelated variety should be such that the related one is likely to dominate during exploitation phases, while the unrelated one gains more weight in the exploration strategies (Krafft et al., 2009).
3.3 Methodology
The empirical analysis of persistence has traditionally focused on innovation proxied by the application for a patent or the introduction of process/product innovations. The former explicit analysis by Geroski et al. (1997) adopts a proportional hazards model, while in subsequent works the most widespread methodology is the analysis of transition probability matrixes, which basically consists in assessing the probability that a firms innovate at time t, given its innovation performances at time t-1 (Cefis and Orsenigo, 2001; Cefis, 2003; Antonelli et al. 2012).
16
A somewhat less covered methodology to tackle the issue of persistence consists in the analysis of serial autocorrelation of growth rates. Cefis and Ciccarelli (2005) provide in this respect a former implementation of such empirical strategy to analyze the differential in the persistence of profits between innovators and non-innovators. In the recent years, however, the analysis of the serial correlation of growth rates has gained momentum, for what concerns mainly firms performances in terms of sales or employment growth. These analyses are clearly cast in a persistence perspective, and emphasize the potentials of such methodology both in terms of predictive power and of policy design (Coad, 2009; Coad and Hoelzl, 2009; Coad and Rao, 2010).
In this vein the application of serial autocorrelation analysis to the growth rates of knowledge structure properties may yield important results concerning the existence (or the absence) of persistence. In order to proceed with the analysis, we define growth rates of the relevant variables as follows:
, , 1
,t ln it ln it
i X X
Growth (16)
Where X is measured in terms of knowledge capital stock; knowledge coherence; cognitive distance; knowledge variety; related knowledge variety; unrelated knowledge variety; knowledge scope. All these variables, which have been introduced in the previous section and better explained in appendix A, are calculated for firm i at time t. Following previous empirical works (Bottazzi et al, 2011; Coad, 2010), the growth rates distributions have been normalized around zero in each year by removing means as follows:
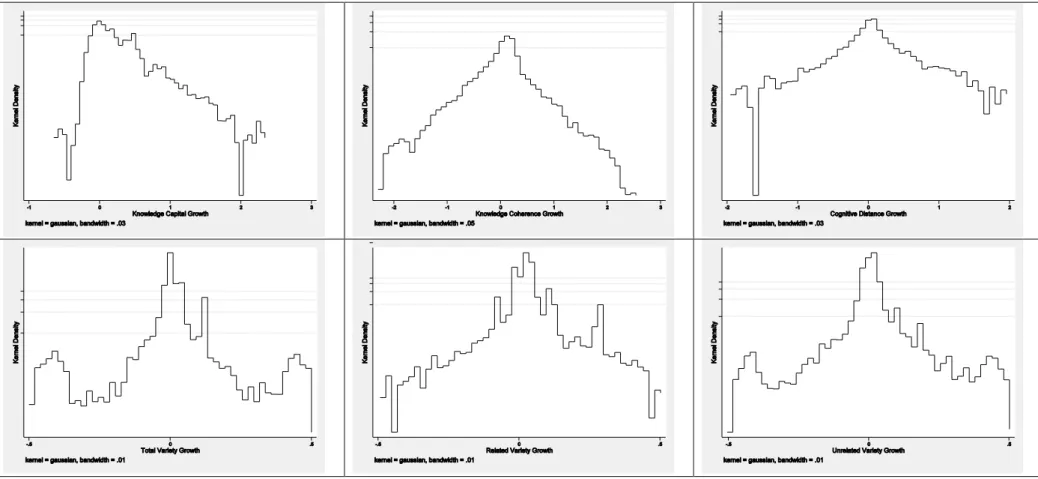
n i t i t i t i Growth N Growth s 1 , , , 1 (17) Where N stands for the total number of firms in the sample. This procedure effectively removes average time trends common to all the firms caused by factors such as inflation and business cycles. The empirical model we will run in the analysis will take therefore the following form:Figure 2 shows the distribution of firms’ growth rates for all the relevant variables. As evidenced by the figure, the empirical distribution of the growth rates for our sample seems closer to a Laplacian than to a Gaussian distribution (with the only exception of knowledge capital). This is in line with previous studies analysing the distribution of firm growth rates (Bottazzi et al. 2007; Bottazzi and Secchi 2006; Castaldi and Dosi 2009).
>>>INSERT Figure 2 ABOUT HERE<<<
Such evidence suggests that standard regression estimators, like ordinary least squares (OLS), assuming Gaussian residuals may perform poorly if applied to these data. To cope with this, a viable and increasingly used alternative consists of implementing the least absolute deviation (LAD) techniques, which are based on the minimization of the absolute deviation from the median rather than the squares of the deviation from the mean.
K k k it k it t is
s
1 , , 0 ,
(18)17
Following Coad (2010), we do not include individual dummies in the analysis. Although unobserved heterogeneity, due, for example, to sector of activity, location, etc. , can have important effects on the estimation results, the inclusion of firm-specific dummies along with lagged variables could produce biases in the fixed-effects estimation of the dynamic panel-data models, a problem known as the Nickell-bias. An alternative approach would be to use instrumental variables (IV) or GMM estimators (Blundell and Bond, 1998). However, it is difficult to find good instruments, particularly when dealing with growth rates. If the instruments are weak, IV estimation of panel VAR could lead to imprecise estimates. Binder et al. (2005) propose a panel VAR model including firm-specific effects, which is based on the assumption of normally distributed errors, but this assumption does not apply to the growth rates of the variables in our regressions.
Since we are dealing with rates rather than levels of growth, in our view any firm-specific components have been mostly removed. We follow the large literature on analysis of firm growth rates which states that the non-Gaussian nature of growth rate residuals is a more important econometric problem and deserving of careful attention. Given the distributional properties of the variables, we prefer to implement LAD estimators.
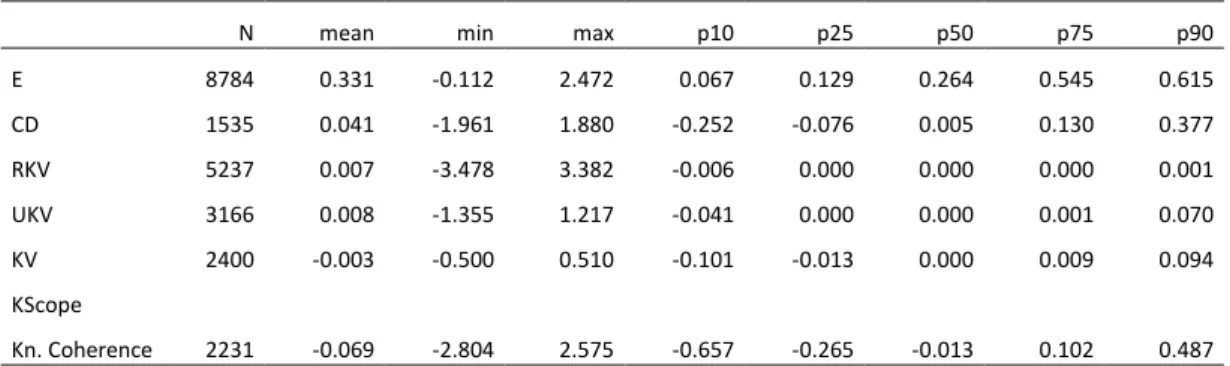
Descriptive statistics for the properties of knowledge structure are shown in Table 4. The reported variables are growth rates before normalization. On average we can observe that the sampled firms seem to be characterized by decreasing coherence, increasing cognitive distance and knowledge capital. The values across the percentiles also suggest that growth rates are characterized by highly skewed distributions.
>>>INSERT Table 4 AND Table 5 ABOUT HERE<<<
In Table 5 we show instead the matrix of correlations among the variables we use in the empirical exercise, marking a significance level of 5%. Although some significant pattern of correlation can be identified, these do not raise any sever concern, as the variables are not used together in the regression estimates.
4 Econometric Results and Discussion
The main focus of this paper is the analysis of the persistence (or the absence of it) of the properties of knowledge structure. The investigation of serial autocorrelation of growth rates allows us to appreciate the dynamics of such indicators, by revealing whether they are characterized by substantial self-enforcing mechanisms according to which firms building their technology portfolio around routinized exploitation activities (or random exploration) at some point in time are likely to perseverate in that direction, or they are rather likely to change direction in the course of time. In Table 6 we report the results of the estimation of equation (3) carried out by implementing the LAD estimator. Due to the nature of the data, we limit ourselves to the analysis of the first three lags. The first column reports the evidence concerning the traditional measure of knowledge capital stock. We can notice how from this data knowledge production appears to be clearly persistent. The coefficient on the first lag is indeed positive and significant. The same applies also to the coefficient on the second lag, the magnitude of which is anyway lower than the previous one. The third lag
18
shows instead a negative and significant coefficient. These results would suggest that persistence in firms’ knowledge production tends to gradually expire. In particular, positive growth rates at time t are likely to engender further positive growth rates in the first two future years. However, this effect is stronger in the first year than in the second one. At the third year we observe an inversion of the effect. This evidence is compatible with an inverted U-shaped relationship of the growth rate of knowledge stock at time t and its lagged values, and suggest that the effects of firms’ innovation efforts do not last indefinitely.
>>> INSERT Table 6 ABOUT HERE <<<
Column (2) reports the results concerning knowledge coherence. Let us recall that knowledge coherence is a proxy of the degree to which the technologies that make the technological portfolio of firms are complementary to one another. In other words it is an indicator of the degree of integration of firms’ KB. The coefficient on the first lag is negative and significant, and the same applies to the coefficient on the second lag, although the magnitude is lower. The coefficient on the third lag is again negative, although not significant. This would suggest that at the overall level, increasing growth rates of coherence are preceded by two years of decreasing growth rate. This evidence is consistent with the ambidexterity hypothesis recalled in Section 2. Too much coherence may hinder the effectiveness of the knowledge generation process of firms, the same way as too low coherence may do. Increasing rates of coherence appear therefore to be followed by decreasing coherence, and vice versa, suggesting that firms attempt to find out a balance between exploration and exploitation in their technological activities.
Columns (3) to (5) report the results of estimations for what concern knowledge variety, and its components related and unrelated variety. The variety indexes we used, which are described in detail in the appendix, are based on the information entropy index, and in particular on its multi-dimensional extension. This means that variety here refers to the observed combination of technologies in firms’ KB. This index provides therefore an idea of the extent to which firms try and experiment new combination. The results indicate that there is some degree of persistence in knowledge variety (KV), as revealed by the positive and significant coefficient on the second lag. The same applies also to related variety (RKV), which show a positive and significant coefficient also on the third lag. The strongest persistent dynamics characterize instead unrelated variety (UKV), which show positive and significant coefficients on all of the three lags. Thus it seems that pursuing variety in the past brings about new variety in the future, in terms of both related and unrelated components. The procedure by which the index is derived reveals that the concepts of ‘related’ and ‘unrelated’ variety refer basically to the belonging of technologies to the same technological domain, as defined by the classification system under utilization (in our case the International Patent Classification). This means that an increase in unrelated variety may signal an increase in combinations between technology from different technological domains, but that can have a high degree of complementarity or similarity.
Column (6) provides the results concerning the cognitive distance index. In this case only the negative coefficient on the first lag is significant. This would suggest the existence of a somewhat erratic dynamics of cognitive distance, which can be characterized by ‘interruption to growth’. This evidence is once more with the idea that firms try and balance the exploration across distant technological fields and the exploitation of technologies close to their core competencies. Column(7)
19
finally provides the evidence about knowledge scope (KSCOPE), which is characterized by negative and significant coefficients on all of the three lags. Increasing scope at one moment in time appears therefore to follow decreasing scope in at least three preceding years (or viceversa). Once again, this is consistent with the idea about the cyclical behavior of firms search strategies, according to which firms tend to smooth their diversification efforts once some profitable research avenues are identified, and eventually invigorate them when their research activities enter some decreasing returns phase.
4.1 Quantile regression analysis
In the preceding section we have investigated the serial autocorrelation of the growth rates of knowledge structure properties at the overall level. However, we can expect that firms in the dataset do not behave in the same way. To the purposes of this paper we are in particular interested in detecting possible differential behaviors for firms characterized by different growth rates of the variables under scrutiny. For example, are firms characterized by higher growth rates of coherence featured by peculiar autocorrelation patterns as compared to firms characterized by decreasing coherence?
The use of quantile regression techniques, first introduced by Koenker and Bassett (1978) can be of great help in this direction12. Besides of being robust to outliers and heavy-tailed distributions, the quantile regression methodologies are able to describe the entire conditional distribution of the dependent variable. Firms showing significanty higher or lower growth rates of the relevant variables are of particular relevance for the present study, and thus we can have a special focus on them by calculating coefficient estimates at various quantiles of the conditional distribution. Finally, it also worth recalling that this empirical approach avoids the restrictive assumption that the error terms are identically distributed at all points of the conditional distribution. This allows for accounting for firm heterogeneity and for considering the possibility that estimated slope parameters vary at different quantiles of the conditional growth rate distribution.
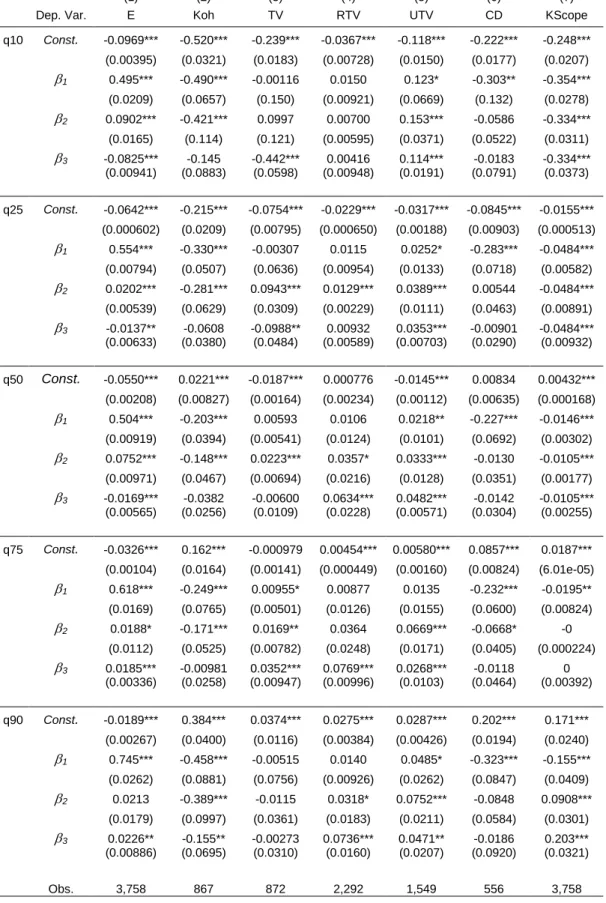
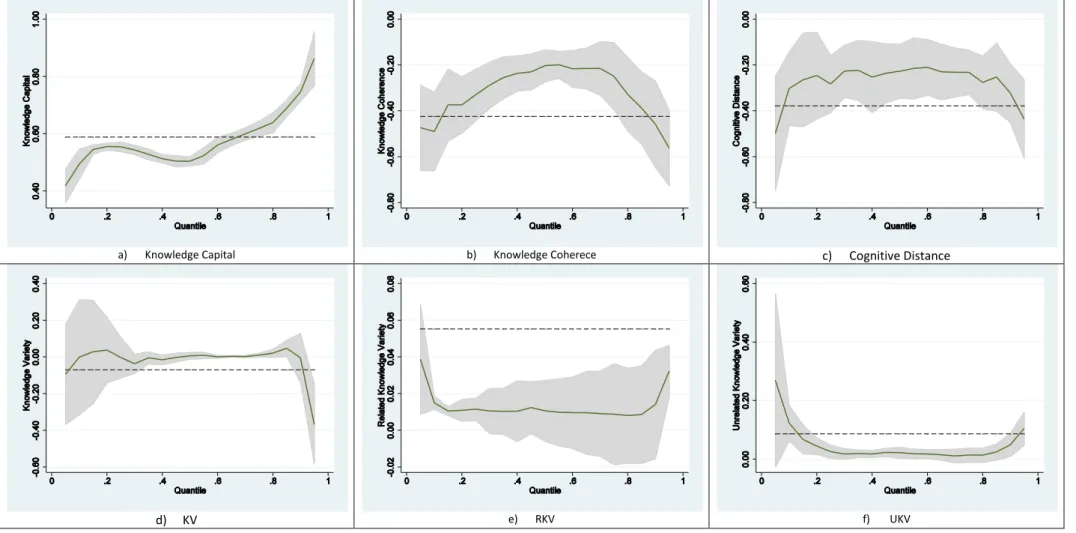
In Table 7 we report the results of the quantile estimation, while Figure 3 provides a summary representation (taking into account only the first lag). The coefficients can be interpreted as the partial derivative of the conditional quantile of the dependent variable with respect to particular regressors.
The results evaluated at the median are by definition the same as the those of the LAD estimation. If we look at first column, we can notice that the persistence of knowledge capital is robust across all of the percentiles identified. This means that both firms characterized by slow growth rates of knowledge capital and those characterized by high growth rates experience self-enforcing dynamics. The magnitude of the first lag coefficient increases as growth rates increase. Therefore, some ‘learning effect’ can be devised, according to which those firms more proactive in the generation of technological knowledge will experience a stronger boost on the future innovation performances.
>>> INSERT Table 7 and Figure 3 ABOUT HERE <<<
20
Column (2) shows the results concerning knowledge coherence. We can notice that the negative coefficient on the autocorrelation coefficients is common to all the quantiles. The uppermost quantile is however the only one characterized by a negative and significant coefficient also on the third lag. The diagram (b) of Figure 3 helps us to interpret these findings, supporting the idea that firms experiencing a particular dramatic fall in knowledge coherence have probably experienced above-average growth in the previous period, while firms showing particularly high growth rates of coherence have probably experienced poor performances in the past. This evidence provides further support to the interpretation based on the ambidexterity hypothesis. Instead of pursuing an endless growth of knowledge coherence, firms organize their search activities so as to counterbalance excessive exploitation with increasing exploration.
Columns (3) to (5) report the results concerning KV, RKV and UKV respectively. As far as KV is concerned, the first lag is positive and significant only for the 75% quantile, suggesting that firms in this class experience some persistence dynamics. Moreover, regression results for this area of the distribution also show positive and significant coefficients on the second and third lag. The results are somehow mixed in the other quantiles, whereby in the lowermost quantile the only significant (and negative) coefficient is on the third lag, while in the 25% quantile the coefficient on the second lag is positive and significant while that on the third lag is negative and significant. Also the evidence about RKV and UKV is rather mixed across quantiles, suggesting however that some degree of persistence mainly characterized the 10% and the 90% quantiles, i.e. those firms characterized either by particularly high of dramatically low growth rates of such indicators.
Column (6) provides the results about cognitive distance. The negative and significant coefficient on the first lag is robust to all quantiles. However, by looking also at Figure 3, we can notice that firms at the 10% and those at the 90% quantiles are featured by relatively higher (in absolute values) coefficients. This is again consistent with the evidence we have found about knowledge coherence, and with the idea that firms are likely to introduce a discontinuity in their search behavior when they have achieved either a too much or a too little average degree of similarity in the technologies they can command.
5 Conclusions
This paper has proposed to extend the analysis of innovation persistence to the investigation of the persistence patterns of the properties of firms’ knowledge. To this purpose, we have implemented a set of indicators grounded on the recombinant knowledge approach and able to synthetically describe the nature of knowledge, and analyzed the serial autocorrelation patterns of their growth rates.
The empirical results has provided support to the existence of persistent dynamics in innovation as measured by traditional proxies like knowledge capital stock. However knowledge generation entails not only a quantitative phenomenon. The investigation of the persistence of knowledge properties like variety, coherence and cognitive distance allows us to link the structure of firms KB to the search strategies that they pursue. Increasing coherence and decreasing cognitive distance are indeed associated to exploitation dynamics, while decreasing coherence and increasing cognitive distance are rather typical of exploration dynamics (Colombelli et al., 2013a). In this direction, we based the interpretation of our results on the ambidexterity hypothesis. Rather than pursuing persistent
21
increase of knowledge coherence, cognitive distance and variety, firms would be better off by counterbalancing the forces leading to exploitation with the forces leading to exploration.
Consistently with this hypothesis, when the properties of the KB are at stake, negative autocorrelation is mostly observed, suggesting that periods of growth are more likely to be followed by sharp decrease (or viceversa). The implementation of quantile regression techniques shows that such evidence is even more marked for firms in the 10% and in the 90% quantiles, i.e. those firms experiencing dramatically low or particularly high growth rates of knowledge properties. Firms characterized by significantly high growth rates of coherence or cognitive distance are more prone to direct their future search behavior towards strategies leading to the smoothing of such indicators. This is much consistent with the lifecycle interpretation of such properties (Krafft et al., 2009). Such results are to be considered as preliminary, and some extensions would be particularly useful. First of all, it would be useful to carry out such an analysis on a wider dataset, including firms from different countries as well as allowing from longer time series. Moreover, it would be also important to cluster the regressions according to different firms size classes, as well as to implement a temporal disaggregation of the sample. On the whole, the results provided in this paper open up a new avenue to the analysis of persistence, and allows for a better understanding of firms’ search strategies, rather than simply observing whether a firm has introduced an innovation or not.
22
6 References
Acs, Z., Anselin, L., Varga, A. 2002. Patents and Innovation Counts as Measures of Regional Production of New Knowledge, Research Policy31: 1069-1085.
Alfranca, O., Rama, R., von Tunzelmann, N. 2002. A patent analysis of global food and beverage firms: The persistence of innovation, Agribusiness 18: 349 – 368.
Allen, R. C. 1983. Collective invention, Journal of Economic Behavior and Organization 4: 1-24. Antonelli, C. 1999. The Microdynamics of Technological Change, London: Routledge.
Antonelli, C. and Colombelli, A. 2013. Knowledge cumulability and complementarity in the knowledge generation function. LEI&BRICK Working Paper n. 3/2013, Department of Economics, University of Torino.
Antonelli, C., Crespi, F., Scellato, G. 2012. Patterns of persistence in productivity growth. The Italian evidence, Structural Change and Economic Dynamics 23: 341-353.
Binder, M., C. Hsiao and C. H. Pesaran, 2005, Estimation and inference in short panel vector autoregressions with unit roots and cointegration, Econometric Theory, 21, 795–837.
Blundell R.W., Bond S.R. 1998. Initial conditions and moment restrictions in dynamic panel data models, Journal of Econometrics 87: 115-143.
Bottazzi, G., Cefis, E., Dosi, G., Secchi, A. 2007. Invariances and Diversities in the Patterns of Industrial Evolution: Some Evidence from Italian Manufacturing Industries, Small Business Economics 29: 137-159.
Bottazzi, G., Coad, A., Jacoby, N., Secchi, A. 2011. Corporate Growth and Industrial Dynamics: Evidence from French Manufacturing, Applied Economics, 43: 103-116.
Bottazzi, G., Secchi, A. 2006. Explaining the Distribution of Firms Growth Rates, Rand Journal of Economics 37: 234–263.
Breschi S., Lissoni, F., Malerba, F. 2003. Knowledge relatedness in firm technological diversification, Research Policy 32: 69-97.
Castaldi, C., Dosi, G. 2009. The patterns of output growth of firms and countries: Scale invariances and scale specificities, Empirical Economics 37: 475-495.
Cefis, E. 2003. Is there persistence in innovative activities?, International Journal of Industrial Organization 21: 489-515.
Cefis, E., Ciccarelli, M. 2005. Profit differentials and innovation, Economics of Innovation and New Technology 14: 43-61.