HAL Id: hal-01368922
https://hal.archives-ouvertes.fr/hal-01368922
Submitted on 20 Sep 2016HAL is a multi-disciplinary open access archive for the deposit and dissemination of sci-entific research documents, whether they are pub-lished or not. The documents may come from teaching and research institutions in France or abroad, or from public or private research centers.
L’archive ouverte pluridisciplinaire HAL, est destinée au dépôt et à la diffusion de documents scientifiques de niveau recherche, publiés ou non, émanant des établissements d’enseignement et de recherche français ou étrangers, des laboratoires publics ou privés.
Maxime Lenormand, T. Louail, Marc Barthelemy, José Javier Ramasco
To cite this version:
Maxime Lenormand, T. Louail, Marc Barthelemy, José Javier Ramasco. Is spatial information in ICT data reliable?. Spatial Accuracy 2016, Jul 2016, Montpelllier, France. �hal-01368922�
Is spatial information in ICT data reliable?
Maxime Lenormand1,*, Thomas Louail2,3, Marc Barthelemy4,5, Jos´e J. Ramasco2
1Irstea, UMR TETIS, 500 rue Franc¸ois Breton, FR-34093 Montpellier, France 2IFISC (CSIC-UIB), Campus UIB, E-07122 Palma de Mallorca, Spain 3G´eographie-Cit´es (CNRS - Paris 1 - Paris 7), 13 rue du four, FR-75006 Paris, France 4Institut de Physique Th´eorique, CEA-CNRS (URA 2306), F-91191, Gif-sur-Yvette, France
5CAMS, EHESS-CNRS (UMR 8557), 190-198 avenue de France, FR-75013 Paris, France
*Corresponding author: [email protected]
Abstract
While an increasing number of human activities are studied using data produced by individuals’ ICT devices, there have been relatively few contributions investigating the robustness of results against fluctuations of data characteristics. In particular, when ICT data contain spatial informa-tion, they represent an invaluable new source for analyzing urban phenomena. Here, we present a stability analysis of higher-level information extracted from mobile phone metadata passively produced during an entire year by 9 million individuals in Senegal. We focus on two specific information-retrieval tasks: (a) the identification of land use in the region of Dakar by analyzing the temporal rhythms of the communication activity; (b) the identification of home and work lo-cations of anonymized individuals, allowing for the construction of the Origin-Destination (OD) matrices for commuting flows. Our analysis reveals that the spatial distributions of land use com-puted for different samples are remarkably robust, with on average 80% of shared surface area between the different spatial partitions. The OD matrix is less stable with a share of about 70% of commuters in common when considering all types of flows. Better results can be obtained at larger levels of aggregation. These different results confirm that ICT data are mostly a very useful source for the spatial analysis of urban systems, but that their reliability should be tested more thoroughly.
I INTRODUCTION
Massive amounts of geolocated data are passively and continuously generated by individuals when they use their mobile and connected devices: smart phones, credit cards, GPSs, RFIDs or remote sensing devices. This deluge of digital footprints is growing at an extremely fast pace and represents an unprecedented opportunity for researchers, to address quantitatively challenging problems, in the hope of unveiling new insights on the dynamics of human societies. Many fields are concerned by the development of new techniques to handle these vast datasets, and range from applied mathematics, physics, to computer science, with plenty of applications to a variety of disciplines such as medicine, public health and social sciences for example. Although big data have the advantage of large samples sizes (millions of observations), and high spatio-temporal resolution, they also raise new challenging issues. Some are technical and related to the storage, management and processing of these data (Kaisler et al.,2013), and others are methodological, such as the statistical validity of analysis performed on such data. For example, in the case of mobile phone data, researchers have often no control on the data collection that is usually made for other purposes. In many cases various hidden biases can affect the spatial behavior of anonymized individuals. Observing the world through the lenses
of data generated by information and communications technologies (ICT) may therefore lead to possible distortions, and possibly to erroneous conclusions (Lewis, 2015). It is thus crucial to perform statistical tests and to develop methods in order to assess the robustness of the results obtained with ICT data. In the research community that studies human mobility (in particular in cities, and related urban dynamics Ratti et al.(2006); Louail et al. (2014);Calabrese et al. (2015); Louail et al. (2015), efforts in this sense have been made in recent years, notably by comparing the results obtained with different data sources (Tizzoni et al., 2014; Lenormand et al., 2014; Deville et al., 2014; Alexander et al., 2015; Toole et al., 2015). However, the robustness of results to sample selection has, to our knowledge, never been studied yet.
In the following we present two examples of such uncertainty analysis on results obtained with mobile phone data recorded in Senegal in 2013 (de Montjoye et al.,2014). We concentrate on two information-retrieval tasks: first, we evaluate the uncertainty when inferring land use from the rhythms of human activity (Soto and Fr´ıas-Mart´ınez, 2011; Fr´ıas-Mart´ınez et al., 2012; Toole et al., 2012; Pei et al., 2014; Lenormand et al., 2015), and second, we study the un-certainty when identifying individuals’ most frequented locations (Ahas et al.,2010;Isaacman et al.,2011;Lenormand et al., 2014;Toole et al.,2015). We conclude by mentioning possible future steps to clearly assess the relevance of various ICT data sources for studying different phenomena.
II STUDY AREA AND DATA DESCRIPTION
We focus here on the region of Dakar, Senegal. The mobile phone data consists in call de-tail records (CDR) of phone calls and short messages exchanged by more than 9 million of anonymized Orange’s customers. They were collected in Senegal in 2013, and were released to research teams in the framework of the 2014 Orange Data for Development challenge (de Mon-tjoye et al.,2014). We will use for our study the second dataset (SET2) that was made available by Orange. It contains fine-grained location data on a rolling 2-week basis at the individual level. For each of the 25 two-week periods, a sample of about 300, 000 mobile phone users is selected at the country scale. Whenever one of these individuals uses his/her mobile phone during the two-week period, the time and his/her position (at the level of serving cell tower) is recorded. This information can be used to study human activity and mobility patterns in the region of Dakar that is here divided into 457 spatial subunits. The partition is the Voronoi tes-sellation constructed from the location of antennas in the city chosen as nodes. Each Voronoi cell approximates thus the activity zone served by the antenna located at its center (see Figure 1a).
III INFERRING LAND USE FROM MOBILE PHONE ACTIVITY
Geolocalized ICT data have been widely used to infer land use from human activity (Soto and Fr´ıas-Mart´ınez, 2011; Fr´ıas-Mart´ınez et al., 2012; Toole et al., 2012; Pei et al., 2014; Lenor-mand et al., 2015). The basic idea is to divide the region of interest into zones, then extract a temporal signal of activity for each of these zones, and finally cluster together zones that dis-play similar signals. Each of these clusters corresponds to a certain type of activity (Residential, Commercial, . . . ). We use here the functional approach proposed inLenormand et al.(2015). The method takes as input, for each cell, a signal composed of 168 points (24h×7days), each value corresponding to the number of users located in this cell, at this hour of the day and this day of the week. These signals are then normalized by the total hourly activity, in order to subtract trends introduced by circadian rhythms. A Pearson correlation matrix between cells is then computed. Two spatial units whose activity is strongly correlated in time will have a high
positive correlation value. This similarity matrix can be represented by a undirected weighted network, which is then clustered using the Infomap community detection algorithm (Rosvall and Bergstrom, 2008). This method has the advantage to be non-parametric (the number of clusters is not fixed a priori).
In order to extract temporal signals of activity in the region of Dakar, we first need to estimate the number of people in each zone, per hour, for each of the 350 days of our original sample. To do so, we rely on the following criteria: each person counts only once per hour. If a user is detected in k different zones within a certain 1-hour time period, each registered position will count as (1/k) ‘units of activity’ for each of these k cells. The average number of users per hour and per day is 30, 500, which represents about 1% of the total population of the region of Dakar. To assess the robustness of land use identification from mobile phone activity to sample selec-tion, we apply the functional approach described above to 100 weeks drawn at random from our original sample (after removing outliers). Note that the days of the weeks are drawn separately, and they are therefore not necessarily chronologically ordered.
0.25 0.30 0.35 0.40 0.45 0.50 0.55 0.25 0.30 0.35 0.40 0.45 0.50 0.55 0.25 0.30 0.35 0.40 0.45 0.50 0.55Residential 0.15 0.20 0.25 0.30 0.35 0.40 0.15 0.20 0.25 0.30 0.35 0.40 0.15 0.20 0.25 0.30 0.35 0.40 Propor tion of Mobile Phone User Business 0.25 0.30 0.35 0.40 0.45 0.50 0.55 0.25 0.30 0.35 0.40 0.45 0.50 0.55 0.25 0.30 0.35 0.40 0.45 0.50 0.55 6 12 18 0 6 12 18 0 6 1218 0 6 12 18 0 6 12 18 0 6 1218 0 6 12 18 Nightlife Time of day (a) (b)
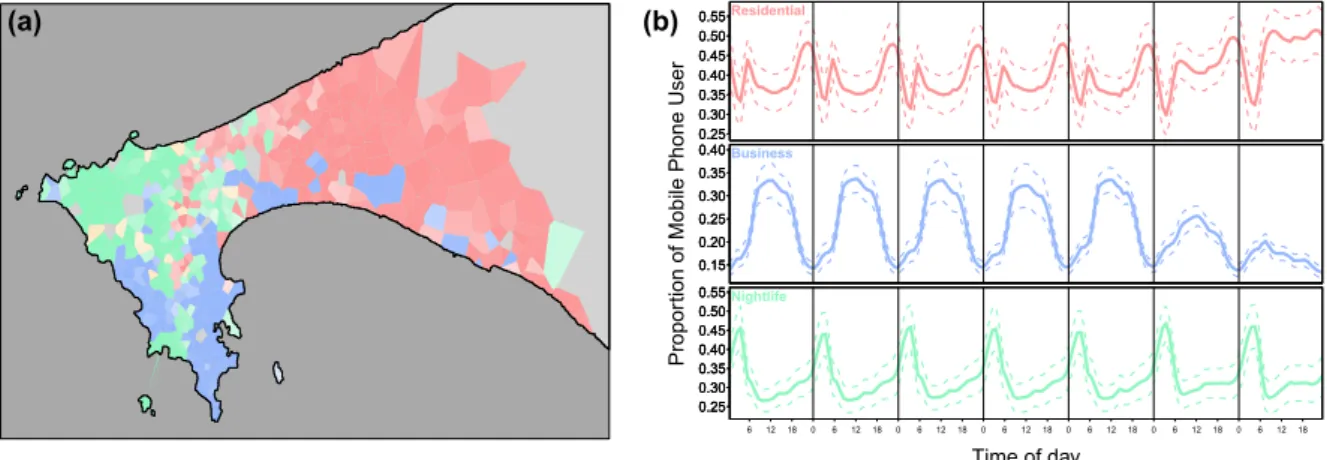
Figure 1: (a) Map of the region of Dakar displaying the three clusters. Colors vary from white to the most recurrent cluster identified in the 100 random sample. The color saturation depends on the number of times the zone was classified as the most recurrent cluster. The color code is red for Residential, blue for Business, green for Nightlife and orange for other types of land use. (b) Temporal patterns associated with the three clusters. The solid lines represent the average temporal profile computed over 100 random extractions, while the dashed lines represent the standard deviations.
First, we observe that three clusters emerge systematically, and represent on average 95% of the total surface. The remaining 5% correspond to other clusters with no clear patterns, probably associated with some local one-time events. We show on Figure1b the average temporal profiles and the variability around this average for each of these three clusters. Each of the clusters can be roughly associated with a dominant land use:
• A Residential activity corresponds to a high probability of mobile phone use during early mornings, evenings and week end days.
• A Business cluster displays a significantly higher activity from 9am to 5-6pm during weekdays.
• A Nightlife activity profile is characterized by a high activity during night hours (1am-4am).
The Nightlife cluster (in green) covers the area of the international airport, and also the neigh-borhood of ”la Pointe des Almadies”, where live mainly wealthy people – most of the rich/so-phisticated nightclubs are also located there. The Business cluster covers Dakar’s CBD (”Le
Plateau”), where are located most of the companies headquarters, and also the port. Finally the residential cluster cover the rapidly growing parts of Dakar peninsula, who profit from the highway construction. It is worth noting that the results are consistent with the ones obtained with another mobile phone dataset in Spain (Lenormand et al.,2015), except that in the case of Dakar, the method is not able to distinguish between industrial (or logistic) and leisure nightlife activities (seeLenormand et al.(2015) for more details).
0 10 20 30 40 50 60
Residential Business Nightlife Other
P
ercentage of total surf
ace
Land use type (a) 60 70 80 90 100 0.00 0.02 0.04 0.06 0.08 0.10 0.12
Shared Surface Area (%)
PDF (b) Residential Business Nightlife Total
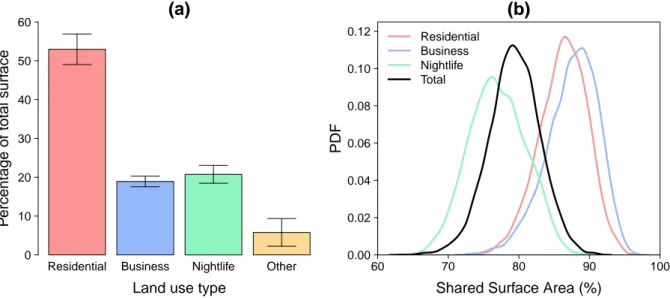
Figure 2: Uncertainty when inferring land use from mobile phone activity. (a) Area covered by the different land use types, expressed as a percentage of the total surface. The values have been averaged over 100 random samples, and the error bars represent the standard deviation. (b) Probability density function of the shared surface area between each pair of spatial distributions according to the type of land use.
As can be observed in Figure 2a, the area covered by the different types of land use is quite stable over the 100 samples, with the residential land use type representing on average about 55% of the total surface, while we observe about 20% for the Business and Nightlife clusters. Nevertheless, the stability of the proportion does not imply that they follow the same spatial distribution from one sample to another. To check for the stability, we compute the surface area shared by two spatial distributions Sl and Sl0 of a given type l and obtained with two different
samples. The expression for this quantity is SSA(Sl, Sl0) = 2
ASl∩S0 l
ASl+ AS0l
, (1)
where AS denotes the surface area of spatial distribution S. Note that in our case ASl ' ASl0
(Figure2a). Similarly, we can defined the total surface area shared by two spatial partitions P and P0 (with the same number and types of land use) of the region of interest,
SSA(P, P0) = P lASl∩S0 l P lASl . (2)
The results are displayed in Figure 2b. The similarities between the 100 different spatial dis-tributions is globally high, with on average 80% of shared surface area between the spatial partitions. The agreement is larger for residential and business clusters with an average shared surface area around 90%. For the nightlife land use type we find a result about 75%.
A map of the region of Dakar displaying the uncertainty associated with the land use identifi-cation is shown in Figure 1a. The colors represent the different land use types, where a zone has been assigned to the most recurrent cluster type over the 100 land use identifications. The color saturation is related to the uncertainty quantified with the number of times the zone was classified as given recurrent cluster: the color is darker if the uncertainty is low, paler otherwise. Most of the zones have been assigned the same clusters more than 80% of the time. This leads us to the conclusion that the identification of land use from mobile phone activity shows a high level of robustness to sample selection.
IV IDENTIFYING HOME-WORK LOCATIONS FROM MOBILE PHONE
ACTIV-ITY
Geolocalized ICT data are also widely used to identify the most visited locations of an individ-ual during his/her daily life trajectory, allowing to extract the origin-destination (OD) matrices of commuting flows, a fundamental object in mobility studies. A simple heuristic is that the most frequented place of a user in the late afternoon/evening and in the early morning can be identified as a proxy for his/her place of residence, while the most frequented area during work-ing hours can be a proxy to his/her work (or activity) place. This simple assumption allows the accurate determination of mobility flows at intermediate geographical scales (see for example Tizzoni et al. (2014); Lenormand et al. (2014); Alexander et al. (2015); Toole et al. (2015)). However, the robustness of the results to sample selection has never been investigated.
For each of the 25 two-week periods and for each user, we apply the following home and work location extraction procedure:
• For each hour of the two weeks period (weekends excepted) during which an individual used his/her mobile phone, we identify the most frequently visited zone during this hour (based on his/her geolocalized mobile phone activity).
• Hours of activity are then divided into two groups, daytime hours (between 8am and 5pm) and nighttime hours (between 7pm and 7am).
• Filter 1: We keep only the users who have been ‘active’ at least ten 1-hour periods during daytime, and ten 1-hour periods during nighttime (spread over at least half of the days of the two-week period) .
• For both groups of hours (daytime and nightime), we identify the spatial unit in which the user has been localized the highest number of hours.
• Filter 2: We keep only users with a fraction of hours spent at ”home” location and ”work” location larger than one third of the total number of locations visited during nighttime and daytime, respectively.
The two filters allow us to discard users not showing enough regularity in order to estimate their main nighttime (’Home’) and daytime activity (’Work’) locations. The source code of this method is available online1.
At the end of the process, after filtering out users living and/or working outside the region of Dakar, the remaining number of users is on average ≈ 65, 000. This number is quite stable over the 25 two-weeks periods, varying at most by 15% around this average. The resulting 25 two-weeks commuting networks can then be compared using several similarity metrics, such as the one described in Lenormand et al.(2016). We consider 2 commuting networks T and T0, where Tij is the number of users living in zone i and working in zone j, and we will use
three different metrics, that encode different network properties. First, the common fraction of
commuters (CPC), varying from 0, when no agreement is found, to 1, when the two networks are identical, is estimated as
CP C(T, T0) = 2 Pn i,j=1min(Tij, T 0 ij) Pn i,j=1Tij + Pn i,j=1T 0 ij . (3)
Second, we will consider the common proportion of links (CPL) that measures similarity in the networks’ topological structure, and is calculated as
CP L(T, T0) = 2 Pn i,j=11Tij>0· 1Tij0>0 Pn i,j=11Tij>0+ Pn i,j=11Tij0>0 . (4)
Third, the common share of commuters according to the distance (CPCd), assessing the simi-larity between commuting distance distributions is given by
CP Cd(T, T0) =
P∞
k=1min(Nk, Nk0)
N , (5)
where Nk stands for the number of users with a commuting distance ranging between 2k − 2
and 2k kms. 1x2 2x2 4x2 1x2 2x2 4x2 1x2 2x2 4x2 CPC CPL CPCd 0.3 0.4 0.5 0.6 0.7 0.8 0.9 1.0
Similarity metrics
(a) All flows Inter−zonal flows 1 2 3 1 2 3 1 2 3 CPC CPL CPCd 0.3 0.4 0.5 0.6 0.7 0.8 0.9 1.0Similarity metrics
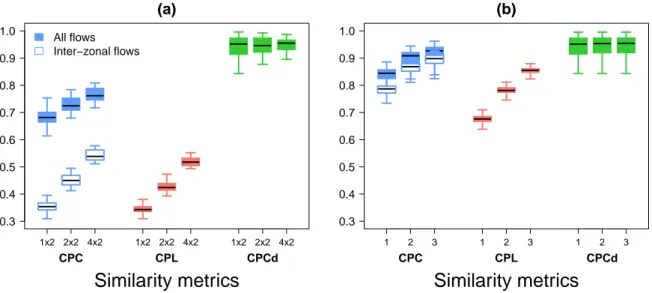
(b)Figure 3: Uncertainty in the identification of the most frequently visited locations from mobile phone activity. (a) Boxplots of the CPC (blue), CPL (red) and CPCd (green) between the 25 two-weeks com-muting networks (1x2), 12 one-month comcom-muting networks (2x2) and 6 two-months comcom-muting net-works (4x2). One-month and two-months commuting netnet-works have been obtained by aggregation of consecutive two-weeks commuting networks. (b) Boxplots of the CPC (blue), CPL (red) and CPCd (green) between the 25 two-weeks commuting networks, according to the grid cell side length (1 km, 2 km and 3 km). The CPC values obtained when considering only inter-zonal flows are also displayed.
The boxplots for the CPC, CPL and CPCd values obtained by comparing the 25 two-weeks commuting networks are displayed in Figure3a (1x2). The results are not completely conclu-sive, with different commuting networks showing a good agreement around 70% of commuters in common (considering both inter- and intra-zonal flows), but with a value falling down to 35% when only inter-zonal flows are considered. The CPL values are also quite low, around 35% of links are in common between the different networks. An encouraging result is that the common part of commuters according to the distance is very high, showing around 90% of similarity
between the 25 commuting distance distributions. However, it is important to keep in mind that these mixed results are obtained with a few thousand users for each two-weeks commuting network, drawn at a high spatial resolution with an average surface area equal to 0.5 km2.
In-deed, as it can be observed in Figure3, both temporal and spatial aggregations of the networks greatly improve the results. The aggregation of consecutive two-weeks commuting networks allow us to perform pairwise comparisons of 12 one-month commuting networks (2 × 2) and 6 two-months commuting networks (4), and we clearly observe that the temporal aggregation improves the results. The two-weeks commuting networks can also be aggregated spatially, by projecting the data on a regular lattice (see Lenormand et al. (2014) for more details about the aggregation method), and results of the comparison of the two-weeks commuting networks according to the size of the grid cells (resp. 1 km, 2 km and 3 km) are represented in Figure3b. Here again, we observe a significant improvement, with CPC values almost always larger than 0.75.
In order to go further, for each of the 25 two-week periods and for each user, we identify the home and work locations for each of the two weeks considered independently, by following the procedure described above. This allows us to assess the influence of the sampling of points along individual trajectories when identifying the home and work locations. We then compare the locations identified for each of the two weeks. Considering the high spatial resolution and the small time window, a good agreement is obtained, with an accuracy of 85.3 ± 1.3% for home (average ± standard deviation over the 25 two-week periods) and 79.1 ± 2.7% for work. Moreover, 60% of the inaccurate locations are less than 2 kms distant from each other. We can therefore conclude that the identification of users’ home-work locations from mobile phone activity also shows a high level of robustness to sample selection.
V DISCUSSION
Data passively produced through information and communications technologies have been in-creasingly used by researchers since the middle of the 2000’s to analyze a variety of human processes and activities. In particular, our understanding of human mobility has been deeply re-newed thanks to these new sources. The longitudinal tracking of anonymized individuals opens the door to an enhanced understanding of human and social phenomena that could not be stud-ied empirically with such a level of detail. However, these data may obviously suffer from a number of biases (Lewis,2015), which include in particular sample selection. Systematic tests are then required for ensuring statistical validity, along with cross-checks between various data sources.
With this in mind, we performed two uncertainty analysis of results obtained with mobile phone data produced by millions of anonymized individuals and collected during an entire year. In the first part of the analysis, we assessed the uncertainty when inferring land use from human activ-ity, estimated from the number of mobile phone users at different moments of the week. A good agreement was obtained between the land uses identified from 100 randomly selected samples of individuals, with on average 80% of shared surface area between land uses in the resulting maps. In the second part of the analysis, we investigated the influence of sample selection on the identification of users’ home and work locations. We first examined the impact of the se-lection of users on the journey-to-work commuting networks extracted at the city scale. In our case-study of the city of Dakar, we showed that the level of uncertainty was highly dependent of the spatio-temporal resolution, and that good results were reachable with a reasonable level of aggregation. We then analyzed the effect of the sampling of locations along mobile phone
users’ trajectories on the identification of their home and work locations. Most of the locations identified with different samples were the same, or very close to one another.
For these two spatial information retrieval tasks, our results suggest that the level of uncertainty associated with sample selection is low. Further work in this direction include the reproduc-tion of such uncertainty analysis with other datasets coming from different countries and data sources. An important aspect of the rapidly growing ‘new science of cities’ (Batty,2013), which heavily relies on new data sources, is to be able to reproduce results with different datasets, and to characterize and control to what extent the information provided by different sources are biased in a particular direction.
More studies in this spirit need to be done to strengthen the foundations of the field dedicated to the understanding of urban mobility and urban dynamics through ICT data. From a publication point of view, trying to reproduce previous results with different data sources, or to estimate the robustness of previously published results, might not be as appealing as proposing new measures and models, but is crucially important as well.
ACKNOWLEDGMENTS
Partial financial support has been received from the Spanish Ministry of Economy (MINECO) and FEDER (EU) under project ESOTECOS (FIS2015-63628-C2-2-R), and from the EU Com-mission through project INSIGHT. The work of TL has been funded under the PD/004/2015, from the Conselleria de Educaci´on, Cultura y Universidades of the Government of the Balearic Islands and from the European Social Fund through the Balearic Islands ESF operational pro-gram for 2013-2017. JJR acknowledges funding from the Ram´on y Cajal propro-gram of MINECO. References
Ahas R., Silm, S.and J. O., Saluveer E., Tiru M. (2010). Using Mobile Positioning Data to Model Locations Meaningful to Users of Mobile Phones. Journal of Urban Technology 17(1), 3–27.
Alexander L., Jiang S., Murga M., Gonz´alez M. C. (2015). Origin–destination trips by purpose and time of day inferred from mobile phone data. Transportation Research Part C: Emerging Technologies 58, Part B, 240–250. Batty M. (2013). The New Science of Cities. MIT Press.
Calabrese F., Ferrari L., Blondel V. D. (2015). Urban sensing using mobile phone network data: a survey of research. ACM Computing Surveys (CSUR) 47(2), 25.
de Montjoye Y.-A., Smoreda Z., Trinquart R., Ziemlicki C., Blondel V. D. (2014). D4D-Senegal: The Second Mobile Phone Data for Development Challenge. arXiv preprint arXiv:1407.4885.
Deville P., Linard C., Martin S., Gilbert M., Stevens F. R., Gaughan A. E., Blondel V. D., Tatem A. J. (2014). Dy-namic population mapping using mobile phone data. Proceedings of the National Academy of Sciences 111(45), 15888–15893.
Fr´ıas-Mart´ınez V., Soto V., Hohwald H., Fr´ıas-Mart´ınez E. (2012). Characterizing urban landscapes using geolo-cated tweets. In SocialCom/PASSAT, pp. 239–248. IEEE.
Isaacman S., Becker R., C´aceres R., Kobourov S., Martonosi M., Rowland J., Varshavsky A. (2011). Identifying Important Places in People’s Lives from Cellular Network Data. In K. Lyons, J. Hightower, and E. M. Huang (Eds.), Pervasive Computing. Springer Berlin Heidelberg.
Kaisler S., Armour F., Espinosa J. A., Money W. (2013). Big Data: Issues and Challenges Moving Forward. In 2014 47th Hawaii International Conference on System Sciences, Volume 0, pp. 995–1004.
Lenormand M., Bassolas A., Ramasco J. J. (2016). Systematic comparison of trip distribution laws and models. Journal of Transport Geography 51, 158–169.
Lenormand M., Picornell M., Cant´u-Ros O. G., Tugores A., Louail T., Herranz R., Barthelemy M., Fr´ıas-Mart´ınez E., Ramasco J. J. (2014). Cross-Checking Different Sources of Mobility Information. PLoS ONE 9(8), e105184.
Lenormand M., Picornell M., Garcia Cant´u O., Tugores A., Louail T., Herranz R., Barthelemy M., Fr´ıas-Mart´ınez E., Ramasco J. J. (2015). Comparing and modeling land use organization in cities. Royal Society Open Sci-ence 2, 150459.
Lewis K. (2015). Three fallacies of digital footprints. Big Data & Society 2(2).
Louail T., Lenormand M., Picornell M., Cant´u O. G., Herranz R., Frias-Martinez E., Ramasco J. J., Barthelemy M. (2015). Uncovering the spatial structure of mobility networks. Nature Communications 6.
Louail T., Lenormand M., Ros O. G. C., Picornell M., Herranz R., Frias-Martinez E., Ramasco J. J., Barthelemy M. (2014). From mobile phone data to the spatial structure of cities. Scientific reports 4.
Pei T., Sobolevsky S., Ratti C., Shaw S. L., Zhou C. (2014). A new insight into land use classification based on aggregated mobile phone data. International Journal of Geographical Information Science 28, 1988–2007. Ratti C., Frenchman D., Pulselli R. M., Williams S. (2006). Mobile landscapes: using location data from cell
phones for urban analysis. Environment and Planning B: Planning and Design 33(5), 727–748.
Rosvall M., Bergstrom C. T. (2008). Maps of random walks on complex networks reveal community structure. Proceedings of the National Academy of Sciences 105(4), 1118–1123.
Soto V., Fr´ıas-Mart´ınez E. (2011). Automated land use identification using cell-phone records. In Proceedings of the 3rd ACM international workshop on MobiArch, HotPlanet ’11, New York, NY, USA, pp. 17–22. ACM. Tizzoni M., Bajardi P., Decuyper A., King G. K. K., Schneider C. M., Blondel V., Smoreda Z., Gonz´alez M. C.,
Colizza V. (2014). On the Use of Human Mobility Proxies for Modeling Epidemics. PLOS Comput Biol 10(7), e1003716.
Toole J. L., Colak S., Sturt B., Alexander L. P., Evsukoff A., Gonz´alez M. C. (2015). The path most traveled: Travel demand estimation using big data resources. Transportation Research Part C: Emerging Technologies 58, Part B, 162–177.
Toole J. L., Ulm M., Gonz´alez M. C., Bauer D. (2012). Inferring Land Use from Mobile Phone Activity. In Proceedings of the ACM SIGKDD International Workshop on Urban Computing, UrbComp ’12, New York, NY, USA, pp. 1–8. ACM.