HAL Id: halshs-00179979
https://halshs.archives-ouvertes.fr/halshs-00179979
Submitted on 17 Oct 2007HAL is a multi-disciplinary open access archive for the deposit and dissemination of sci-entific research documents, whether they are pub-lished or not. The documents may come from teaching and research institutions in France or abroad, or from public or private research centers.
L’archive ouverte pluridisciplinaire HAL, est destinée au dépôt et à la diffusion de documents scientifiques de niveau recherche, publiés ou non, émanant des établissements d’enseignement et de recherche français ou étrangers, des laboratoires publics ou privés.
Does Team-Based Compensation Give Rise to Problems
when Agents Vary in their Ability ?
Claude Meidinger, Jean-Louis Rullière, Marie Claire Villeval
To cite this version:
Claude Meidinger, Jean-Louis Rullière, Marie Claire Villeval. Does Team-Based Compensation Give Rise to Problems when Agents Vary in their Ability ?. 2001. �halshs-00179979�
GATE
Groupe d’Analyse et de Théorie
Économique
UMR 5824 du CNRS
DOCUMENTS DE TRAVAIL - WORKING PAPERS
W.P. 01-13
Does Team-Based Compensation Give Rise to Problems
when Agents Vary in their Ability?
Claude Meidinger, Jean-Louis Rullière, Marie-Claire Villeval
2001
GATE Groupe d’Analyse et de Théorie Économique UMR 5824 du CNRS
93 chemin des Mouilles – 69130 Écully – France B.P. 167 – 69131 Écully Cedex
Tél. +33 (0)4 72 86 60 60 – Fax +33 (0)4 72 86 60 90 Messagerie électronique [email protected]
Does Team-Based Compensation Give Rise to Problems
when Agents Vary in their Ability?
1Claude Meidinger
a,Jean-Louis Rullière
b,Marie-Claire Villeval
b aTEAM, CNRS and University Paris I-Panthéon Sorbonne, Paris, France
b
GATE, CNRS and University Lumière Lyon 2, Lyon, France
Abstract
This paper reports the results of an experiment on how team composition influences both the contract offer of employers and employee performance when a revenue-sharing scheme is introduced. Experimental evidence shows that the principal ceases trying to monitor her team through a contract offer when agents vary in their ability. In this case, agents focus more heavily on their teammate's behaviour than on the principal's offer and therefore, regardless of the level of team-based compensation, a large amount of free-riding occurs within the team. In contrast, when the team is homogeneous, agents are better able to use the contract offer as a coordination device among themselves and therefore achieve higher efficiency.
JEL classification: J33, C91, C92, D63
Keywords: Experiments, Free-Riding, Compensation, Peer Pressure, Teamwork.
L'hétérogénéité des équipes est-elle compatible avec une rémunération collective?
Résumé :
Cet article rend compte d'une expérience sur la manière dont la composition d'une équipe influence à la fois la conception du contrat par le principal et la performance des salariés lorsque l'on introduit une rémunération de groupe de type partage du profit. Les résultats indiquent que le principal renonce à essayer de monitorer son équipe à travers son offre contractuelle lorsque les agents n'ont pas tous la même habileté. Dans ce cas, les agents se focalisent bien plus sur le comportement de leur co-équipier que sur l'offre du principal. Dès lors, quel que soit le mode de partage entre le principal et l'équipe, le free-riding se développe massivement au sein de l'équipe. Par contre, quand l'équipe est homogène, les agents parviennent davantage à utiliser l'offre contractuelle comme dispositif de coordination entre eux et parviennent ainsi à coopérer plus souvent et à atteindre un meilleur niveau d'efficience.
Mots clés : Expérimentation, Passager clandestin, Compensation, Pression des pairs, Travail en équipe.
1 We would like to thank M. Boyer and C. Montmarquette for their helpful suggestions while visiting CIRANO, University of Montreal. We are also grateful to A. Perrot, J.P. Ponssard, M. Visser, S. Zamir and seminar participants at CREST in Paris for their remarks and comments. Special thanks to R. Zeiliger for developing the computer program used in this experiment. Financial support from the Rhône-Alpes Regional Council is gratefully acknowledged. Any errors contained herein are the sole responsibility of the authors.
1. Introduction
Firms' performance and team-based compensation would appear to be contradictory parameters. A moral hazard problem (the "1/n problem") arises in teams where a dominant strategy for each agent consists of free-riding on the effort of other agents (Holmström, 1982). In teams where residual returns are equally shared, the concern for cost control wanes and agents are incited to exert less effort. This problem tends to increase with the size of the partnership, since as the number of partners sharing the revenue rises, the individual reward from additional effort declines.
An empirical assessment of the efficiency of team-based compensation was initially investigated within professional partnerships where contracts are observable, such as legal partnerships (Leibowitz and Tollison, 1980) or medical group practices (Newhouse, 1973; Gaynor and Pauly, 1990; Encinosa, Gaynor and Rebitzer, 1997). These studies have revealed the importance of free-riding and shirking in teams where residual returns are equally shared. Group incentives without goal-setting fail to increase team productivity (Weiss, 1987). As a consequence, an empirical assessment of the impact of non-productivity-based group incentives usually concludes that such incentives fail to increase firms' performance (Erev, Bornstein and Galili, 1993; Nalbantian and Schotter, 1997), whereas individual piece-rate pay does play a role in improving performance (Booth and Franck, 1999; Lazear, 2000; Prendergast, 1999).
However, studies of profit sharing programs and Employee Stock Ownership Plans have shown that firms which practise as well as adopt profit-sharing plans benefit from productivity differentials, as compared to firms which do not introduce such schemes (see the survey conducted by Weitzman and Kruse, 1990). The incentive to free-ride, induced by group compensation, can be offset by factors such as repetition of the game, interaction effects among human resource management policies (Ichniowski, Shaw and Prennushi, 1997), and peer pressure (Kandel and Lazear, 1992). Cross-section estimates (Fitzroy and Kraft, 1987) and experimental evidence on teams (Carpenter, 1999) have shown how group rewards can favour horizontal monitoring and mutual assistance, hence cooperation in instances where individual effort is not observable except by co-workers. A final source of increased effort induced by group rewards lies in reciprocity considerations (Fehr, Gächter and Kirchsteiger, 1997; Fehr and Gächter, 1998), in particular between a fair principal and reciprocating team members (Güth and Alii, 1999; Rossi and Warglien, 1999; Meidinger, Rullière and Villeval, 2001). Yet, it should be noted that empirical studies also suggest that introducing group compensation leads to less productive employees improving their effort, while more productive employees do not alter their contribution (Weiss, 1987; Hansen, 1997). Similarly, a real-effort experiment performed on contests indicates that less-capable agents expend a high level of effort despite their smaller chances of winning the contest, driving up the effort of
others (van Dijk, Sonnemans and van Winden, 2001). This finding could reveal that individuals, depending on both their ability and the incentive structure, do not respond in the same manner to team-based compensation. Thus, the efficiency of group incentives may be influenced not only as team size increases, but also when worker ability varies (Prendergast, 1999).
This paper is aimed at examining whether or not heterogeneity in a team's ability hinders the efficiency of team-based compensation (e.g. revenue-sharing). It is intended to identify both the influence of team composition on the design of a group incentive contract by the principal and the impact of such an offer on team cooperation.
Empirical investigation was conducted in an experimental setting. This methodological choice has been motivated by three elements. First, imposing exogenous team-based compensation on all subjects enables circumventing the selection bias problem that affects the results of certain empirical tests on incentive provision. Second, it allows directly observing individual behaviour in the presence of changes in controlled environmental parameters, while limiting the risk associated with uncontrolled omitted variables and the use of proxies. Lastly, it serves to distinguish between monetary aspects and peer pressure in motivating individual behaviour.
The experiment focuses on a game played with three players (one principal and two agents). The principal designs a contract by deciding on her share of the outcome and the agents decide, non-cooperatively, whether to accept or reject the contract and then on the extent of their individual effort. In the so-called symmetric treatment, both agents have the same level of productivity, whereas in the asymmetric treatment, one agent's productivity is twice that of his teammate.
Experimental evidence indicates that when agents vary in ability, team-based compensation gives rise to much more free-riding. Heterogeneous teams display low rates of cooperation because principals refrain from monitoring teams through contract design and agents focus more heavily on their teammates' behaviour rather than on the principal's offers. In contrast, when teams exhibit homogeneous abilities, agents utilise contract offers as a coordination device and a higher rate of cooperation results when they are offered a greater share of the outcome.
This paper is organised as follows. Section 2 presents the basic structure of the principal multi-agent game, the layout of the two types of treatment (symmetric and asymmetric) and theoretical predictions. Section 3 introduces the experimental design. Section 4 discusses the experimental data and comments on the econometric results. The final section summarises the results and provides concluding remarks.
2. The principal-team game
2.1 Basic structure of the game
The game involves three players: a principal (subject X) and a team of two agents (subjects Y1 and Y2), required to share a pie whose size depends on their decisions. Let
us define ρi and ei as player Yi's productivity and effort level (i∈
{ }
1,2 ), respectively. Without any complementarity in the agents' effort, the resulting outcome is py= p(ρ1 1e +ρ2 2e ), with p being the price of output. This outcome is to be divided according to a sharing scheme designed by the principal; such a scheme is characterised by both a parameter θ (that determines the principal's share) and a team payment formula (that determines the allocation of (1−θ py among the agents). This payment ) formula entails a revenue-sharing mechanism that distributes an equal share of the outcome to each agent regardless of his productivity level. The adoption of such equality in sharing is in fact more likely in small groups (Encinosa, Gaynor and Rebitzer, 1997). Moreover, a collective possession of talent acts in support of this type of scheme since agents are not considered as being responsible for their productivity level but only for their effort level (Fleurbaey and Maniquet, 1999). The outcome is thus shared by allocating θpy to the principal and (1−θ)py/2 to each agent.The agents' payoffs are determined by subtracting an individual cost of effort from their share. The corresponding cost function is the same for both agents:
C e e a i i ( )= 2 , with a > 0
At the beginning of the game (during Stage 1), the principal designs a contract and makes a "take it or leave it" offer to the agents, by specifying a value for the share parameter θ of either 0.5 or 0.33. These share values correspond to an equal share based on balanced weighting either between the team and the principal or between the members of the triad (leaving aside the cost of efforts borne by the agents alone). During Stage 2, both agents, informed of the principal's offer, decide simultaneously whether to accept or reject the offer. If at least one agent rejects the offer, the current round is over and the payoff is zero for all three subjects. If both agents accept the offer, each decides non-cooperatively on his level of effort, with ei ≥0 . These decisions then determine the outcome to be shared: py = p(ρ1 1e +ρ2 2e ).
2.2 Symmetric and asymmetric treatment of the game
With parameter values p=12 and a=4, two types of treatment have been conducted: a symmetric treatment and an asymmetric treatment. According to the symmetric treatment, both agents exhibit the same productivity (ρ1 =ρ2 =1) and each must choose a level of effort equal to either 6 or 14. In the asymmetric treatment, the productivity of agent Y2 is twice that of agent Y1 (ρ1 =1 and ρ2 =2) and each must choose a level of effort equal to either 12 or 22. Tables 1-4 show the agents' and principal's payoffs for both types of treatment.
[Insert Tables 1-4 about here]
As shown in these tables, it is clear that a "prisoner's dilemma" is encountered for the team in both types of treatment and for each value of θ. Once θ has been given, in a symmetric as well as an asymmetric treatment, each agent displays a strictly dominant strategy that consists of choosing his low level of effort. For this reason, the choice of
such a level is called the "free-riding strategy" and the choice of a high level of effort is the "cooperation strategy".
2.3 Theoretical predictions
Since alternative payment levels have been normalised to zero, the participation constraint of agents' non-negative payoff is satisfied by any principal offer. In a one-shot game, for both types of treatment and with each agent playing his free-riding strategy, the principal should offer a 0.50 contract. Neither agent Y1 nor Y2 has any incentive to reject such an offer, hence the principal can obtain a better payoff with a 0.50 contract than with a 0.33 contract: the payoff will be 72 (instead of 48) in the symmetric treatment and 216 (instead of 144) in the asymmetric treatment.
Conditions however could be different in a repeated game without reshuffling. Notwithstanding the traditional backward-induction argument, players in such a game could seek coordination on a better issue. In the two types of treatment, through the costly rejection of a 0.50 contract in a given round, both agents can individually motivate the principal to offer them a better contract in the subsequent rounds. A better contract would provide the agents with the opportunity to coordinate on the cooperation issue. For both types of treatment, as shown in Table 5 below, it is clear that coordination on the cooperation issue with a 0.33 contract makes all parties better off than when agents coordinate on the free-riding issue with a 0.50 contract.
[Insert Table 5 about here]
We are seeking to investigate the comparative efficiency of such coordination in both types of treatment. In asymmetric treatment, due to differences in ability, the incentive to free-ride varies from one agent to the next. When teamed with a partner who cooperates, the less-productive agent exhibits the greatest incentive to free-ride2. In
contrast, in symmetric treatment, both agents have the same incentive to free-ride.
3.Experimental design
The experiment was performed at GATE, using the Regate software. Six 20-period sessions were run. 72 participants were drawn from the undergraduate classes of the Engineering and Textile School of Lyon; no subject was introduced into such experiment. 24 groups were formed in all, 12 each playing the symmetric treatment and asymmetric treatment. Group assignments were randomly organised at the beginning of the session. In order to study how subjects learn to cooperate over time within a triad, a partner-matching protocol was employed so that each participant could interact with the same two other participants throughout a session. All interactions between participants
2
Weiss (1987) and Hansen (1997) consider that the most capable employees are less motivated by group incentives and should be more inclined to free-ride, because they need higher reward to increase their contribution following the introduction of team-based compensation. Here, we do not consider the effect of a change in the mode of compensation. In contrast therefore, less-capable agents have a stronger incentive to free-ride on the high productivity of their partners. For the same reason, Farell and Scotchmer (1988) show that in partnerships, the most capable agents try to constitute homogeneous teams to reject the low-ability employees.
remained anonymous. A session lasted 45 minutes on average, not counting the time needed to answer a post-experiment questionnaire and to pay participants. All transactions were conducted in ECU (Experimental Currency Units), with the ECU-French franc conversion rate set at 100 ECU = 5 FF for symmetric treatment and 100 ECU = 2.5 FF for asymmetric (in order to obtain comparable average payments of subjects for both types of treatment). At the end of the session, each subject was paid (in FF) the sum of his payoffs obtained during the 20 periods. A show-up fee of 15 FF was added to the total.
At the beginning of a session, participants were handed a copy of the instructions as the experimenter read them aloud (see Appendices A and B). Productivity levels and payoff functions, with respect to the share parameter, and the selected efforts were made common knowledge. Questions were answered privately by the experimenter. Each subject was then randomly assigned by the computer the role of either principal (subject X) or agent in the symmetric treatment, and either a low-productivity agent (subject Y1) or high-productivity agent (subject Y2) in the asymmetric treatment. In the asymmetric treatment, each principal was matched during each period with the same two heterogeneous agents. Each participant kept the same role throughout the session.
At the beginning of each period, subject X makes an offer regarding the share of the future outcome. Agents Y1 and Y2 are informed of this offer and decide simultaneously and without any communication between themselves whether or not to accept it. If both agents decide to accept the offer, they select their own level of effort.
As regards information feedback at the end of each period, subjects were informed of: the acceptance decision, individual choices of effort levels, and each group member's payoff, in recognition of the fact that in firms, employees are usually able to observe the efforts of co-workers. The principal was given the same feedback, since Weiss (1987) and Hansen (1997) have provided examples of firms in which employers elect to pay employees according to the team outcome, despite the possibility of observing individual contributions.
Participants could see on the upper half of their computer screen a table displaying their cumulative decisions and the group's results in all of the session's preceding rounds.
4. Experimental evidence
This section presents a discussion of the overall statistics, the principal's behaviour, and the various aspects of team and individual behaviour with respect to contract acceptance and cooperation.
4.1 General results
[Insert Table 6 about here]
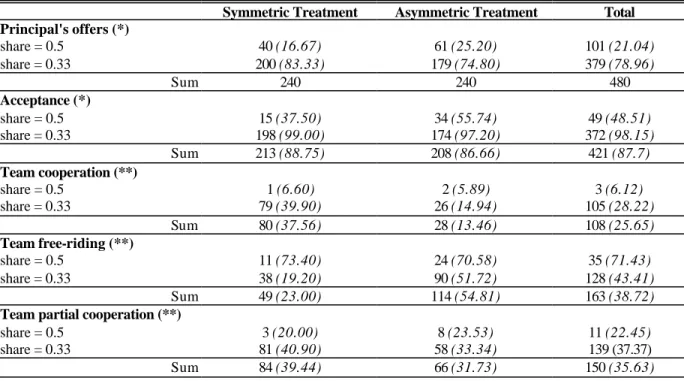
As shown in Table 6, a large majority of contracts (87.70%) are accepted. Among these 421 contracts, 25.65% induce team cooperation, 38.72% team free-riding and 35.63% partial team cooperation.
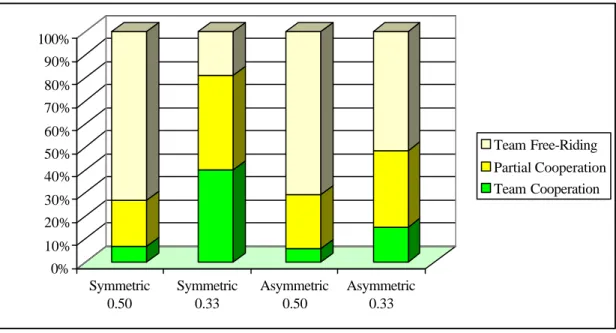
In both types of treatment, the majority of contracts offered are 0.33 contracts (83.33% in symmetric treatment and 74.58% in asymmetric treatment); such a breakdown in offers favours team cooperation. In symmetric treatment, a 0.50 contract induces 6.6% team cooperation and 73.4% team free-riding, whereas a 0.33 contract induces 39.9% team cooperation and 19.2% team free-riding. In asymmetric treatment, a 0.50 contract induces 5.89% team cooperation and 70.58% team free-riding, while a 0.33 contract induces 14.94% team cooperation and 51.72% team free-riding. These results have been illustrated in Figure 1 below.
[Insert Figure 1 about here]
The differing impact of the principal's offer on team cooperation between the two types of treatment has also been documented in Tables 7 and 8 below, which display the various issues played by the team for an accepted contract. The data clearly reveal that a 0.33 contract incites much more team cooperation in symmetric than in asymmetric treatment.
[Insert Tables 7 and 8 about here]
Focus must therefore be placed both on the determinants of group behaviour, with respect to the type of treatment, and on the determinants of individual behaviour within groups of the principal and agents.
4.2 Principal's behaviour
The majority of principals offer 0.33 contracts. Yet it should be pointed out that the frequency of these offers is greater in symmetric (83.33%) than in asymmetric treatment (74.58%). A χ test (5.526) on these data leads to accepting the hypothesis of a 2 difference between types of treatment (at a level of 2%). A Wilcoxon-Mann-Whitney test concludes that a principal offers a significantly greater number of 0.33 contracts in symmetric rather than asymmetric treatment. However, given the same principal behaviour in both types of treatment, such a difference may obviously also be attributed to differences in team behaviour.
A data panel analysis has been conducted in order to identify the determinants of the principal's behaviour and to test the hypothesis of a difference in behaviour between the two types of treatment. Repeated observations (20) on the same units (24 groups) are available and we can choose between treating individual (group) effects as either fixed or random effects. Fixed effects would be appropriate if the groups in the sample could not be considered as randomly-drawn from some underlying population. Because groups have been randomly constituted from a sample of heterogeneous individuals and because the specific value of some fixed group effects lie beyond the scope of this study, random effects were chosen. This random-effect approach also allows for deriving estimations independent of the values of fixed effects and for making inferences with respect to population characteristics. The following variables have been considered:
share = 1 if the principal's share is 0.33, and = 0 if the share is 0.50,
accept_1 = 1 if the contract was accepted in the preceding round, and = 0 otherwise, teamfr_1 = 1 if the team free-rode in the preceding round, and = 0 otherwise, round = 1-20 for the ranking of interactions within groups,
where i denotes the group number and t the round number.
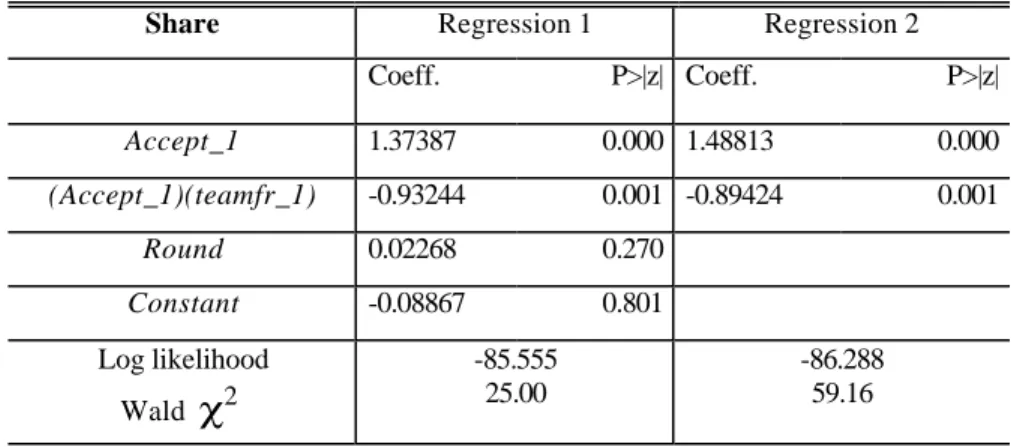
Separate Probit regressions with random effects were run in accordance with the following model:
prob share( )= f Z( ), with Z being a latent variable defined by the following equation: Zit =β β1+ 2accept_1+β3(accept_ )(1 teamfr_ )1 +β'4round +(vi +ε it)
with vi +ε an error term consisting of two components: a time-invariant group-it specific component, and a remainder component assumed to be uncorrelated over time. In both of these regressions, the proportion of total variance contributed by the panel-level variance is significantly different from zero. Tables 9 and 10 show the regression results.
[Insert Tables 9 and 10 about here]
It appears that the principal's behaviour differs from one type of treatment to the next. In asymmetric treatment, the principal's offers do not depend on the team behaviour during the previous round, whereas this behaviour is highly significant in symmetric treatment. Moreover, in symmetric treatment, the acceptance of contracts exerts a significantly positive effect on a 0.33 offer, while team free-riding has a negative influence. Table 11 below presents the predicted probabilities of a 0.33 offer for both types of treatment and as a function of team behaviour during the previous round.
[Insert Table 11 about here]
Such a difference in the principal's behaviour between types of treatment could naturally be attributed to principals' expectations that team cooperation through a 0.33 contract is much more likely in a symmetric rather than asymmetric team. In symmetric treatment, the advantage of team cooperation and the incentives to free-ride are similar for both agents, a situation that could favour team cooperation. In contrast, in asymmetric treatment, because of the difference in agents' productivity, incentives to free-ride are much stronger for the first agent than for the second, which could introduce greater conflict between agents and dissuade principals from attempting to monitor team behaviour through the type of contract offered.
This difference in behaviour may also, in part, be attributed to the different structure of the principal's financial incentives from one type of treatment to the next. In comparing the principal's payoff obtained for a 0.33 contract with team cooperation to that obtained for a 0.50 contract with team free-riding, the financial incentive to induce team cooperation through a 0.33 contract is greater (55.5%) in symmetric treatment than in asymmetric (22.2%).
In symmetric treatment, not surprisingly, team free-riding has a negative impact on 0.33 contract offers, which could suggest that principals are willing to punish agents by keeping a greater share for themselves in the following round whenever the team
free-rides. A more striking feature here perhaps is the positive influence of contract acceptance on the principal's offer. A contract accepted in the previous round does not incite principals to offer a 0.50 contract during the following round, in spite of the incurred risk in the case of team free-riding with 0.33 contracts; team free-riding confronts the principals with the risk of a 33% decrease in their payoff when comparing 0.33 and 0.50 contracts. Yet, the risk of greater loss in the case of a 0.50 contract's rejection, coupled with the principal's fear of such rejection, can also provide an explanation for the positive effect of acceptance on subsequent offers.
4.3 Contract acceptance by the team
Although all contracts satisfy the participation constraint, some do get rejected (11.25% in symmetric treatment and 13.33% in asymmetric treatment). A Wilcoxon-Mann-Whitney test allows accepting the null hypothesis of no difference in rejection rates between types of treatment (p < 0.2981).
As displayed in Figure 2 however, a huge difference in rejection rates as a function of the principal's offer is apparent.
[Insert Figure 2 about here]
The rejection of 0.50 contracts can indeed be interpreted as punishment aimed at monitoring the principal: 25.8% of the teams that rejected a contract in the previous round reject it again during the next round in asymmetric treatment and 34.46% do the same in symmetric treatment, despite the cost such a rejection entails. The rejection of 0.33 contracts could be considered as mistakes since the principal cannot offer a better share (only 1% of the 0.33 contracts are rejected in symmetric treatment and 2.8% in asymmetric). Yet in spite of these low rejection rates, such behaviour could also be interpreted as a monitoring device used by an agent to induce his partner to cooperate.
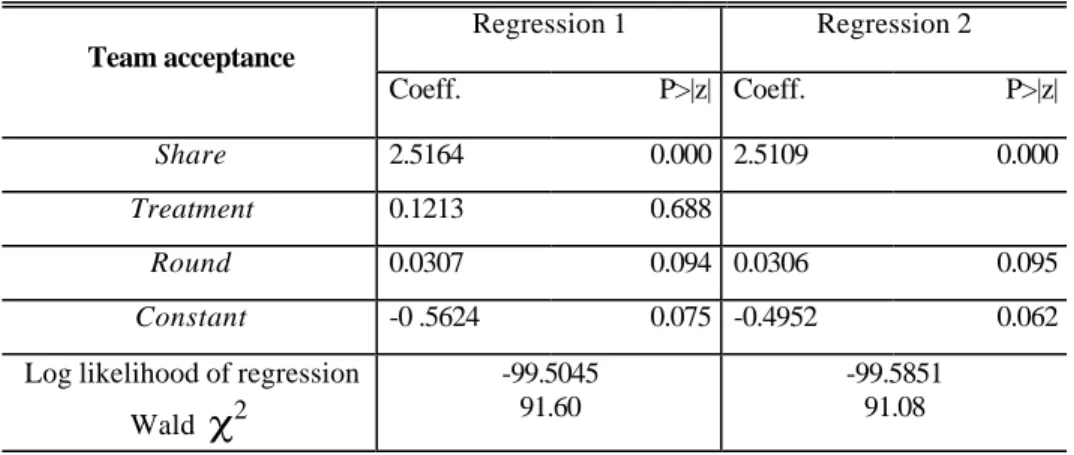
Let us first consider the team's attempts to monitor the principal through contract acceptance and rejection. A panel data analysis with random effects is used to generate additional information on agents' acceptance behaviour. Because the level of variability in the team acceptance variable is not sufficient to allow separating regressions by type of treatment, the 480 observations were pooled and a dummy variable was included in the regression in order to identify a possible treatment-correlated difference.
By setting the variable accept = 1 if the contract is accepted by the team and = 0 otherwise, and setting the treatment dummy variable = 1 for asymmetric treatment and = 0 for symmetric treatment, the two following Probit regressions were run to identify the determinants of acceptance probability (prob(accept)).
[Insert Table 12 about here]
A likelihood ratio test shows that the proportion of total variance contributed by the panel-level variance component is significantly different from zero. It should be noted that the treatment variable is not significant, whereas the principal's offer and round number are. Not surprisingly then, a 0.33 contract offer increases acceptance probability and the positive round effect reveals that the probability of accepting an offer rises over time.
Regression 2 yields Figure 3, which interestingly suggests that the round effect is mainly concentrated on the 0.50 offers. As the repeated experiment progresses, teams are increasingly inclined to accept such offers, most likely because of the cumulative cost of multiple rejection.
[Insert Figure 3 about here]
It is also clear however that in order to fully understand teams' contract rejection, individual behaviour needs to be examined more closely. Let us now consider individuals' attempts to monitor co-workers within the team. A contract is rejected as soon as one agent declines the offer. Since the treatment variable is not significant in explaining team acceptance, the 480 observations were pooled and the regressions assumed a common behaviour for both agents. We are therefore considering that individual acceptance probability depends on: the contract proposed during the current round (share), the partner's cooperation in the preceding round (Y_icoop_1 = 1 if the partner cooperated), the round number, and the treatment (to ensure the insignificance of the dummy variable). Table 13 below shows the results of a Probit regression with random effects.
[Insert Table 13 about here]
It once again appears that no significant difference is present between the two types of treatment, whereas the principal's offer and round number are significant. Of particular relevance here is the insignificance of the partner's previous choice, which may indicate that contract rejection is not used as a peer pressure mechanism to induce partner cooperation.
4.4 Team cooperation
As shown in Table 6, team behaviour seems to be influenced both by the principal's contract offer and by the type of treatment. Generally speaking (see the two following Probit regressions with teamcoop = 1 if both agents cooperate and = 0 otherwise), team cooperation does depend both on the principal's offer (a 0.33 contract offer exerts a positive effect on the probability of team cooperation) and on the type of treatment (symmetric treatment favours team cooperation). The round number, in contrast, is not correlated with team cooperation.
[Insert Table 14 about here]
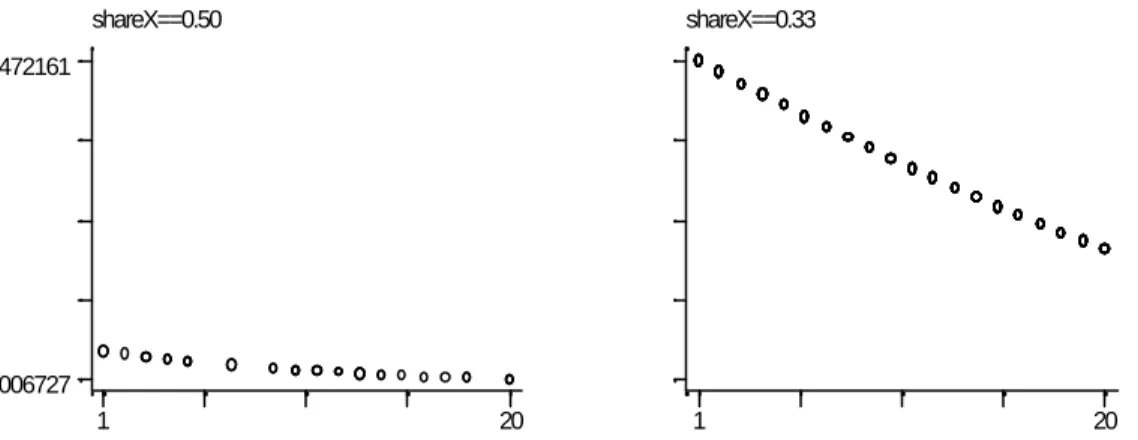
The treatment effect however is being investigated herein through a dummy variable, which assumes that such an effect can only be accounted for through a difference in the constant term of the latent variable equation. Thus, Probit regressions have also been separately run for each type of treatment in order to obtain more information on differences between the two (see Table 15 below).
It should be noted that the non significant effect of round number obtained in the overall sample results in fact from two opposing and counterbalancing effects related to the type of treatment: the round effect is positive in asymmetric treatment and negative in symmetric treatment, as displayed in the following figures.
[Insert Figures 4 and 5 about here]
In addition, and perhaps of even greater pertinence, the principal's offer (while favouring team cooperation in symmetric treatment) has no significant impact in asymmetric treatment. This finding potentially suggests that in asymmetric treatment, the individual cooperation of each agent is much more heavily incited by the behaviour of the team partner in the preceding round rather than by what the principal offered. This suggestion requires further investigation of individual behaviour in each type of treatment.
4.5 Individual cooperation
Testing the hypothesis that the asymmetry of agents leads them to focus more heavily on the partner's behaviour than on the principal's offer can be investigated by introducing both the principal's offer and the partner's previous choice into the Probit regressions. In both types of treatment, with a common behaviour assumed for agents Y1 and Y2, we have considered that an agent's cooperation probability depends on: the current contract (share), the partner's choice in the preceding round (Y_icoop_1 = 1 if the partner cooperated), and the round number. Table 16 presents the results obtained for both types of treatment.
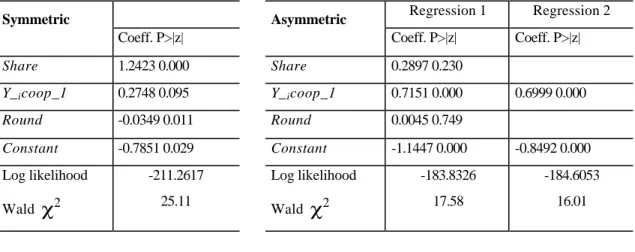
[Insert Table 16 about here]
Whereas in symmetric treatment the variables share and Y_icoop_1 are both significant, only Y_icoop_1 is significant in asymmetric treatment. For asymmetric treatment therefore, both agents are much more preoccupied by how the partner behaved in the preceding round than by the principal's current offer. From the results of Regression 2, an agent cooperates with a probability of 0.1978 if the partner free-rode in the previous round and with a probability of 0.4406 if he cooperated.
It must be noted at this juncture that if the assumption of common agent behaviour in symmetric treatment seems justified due to the same incentive to free-ride, such an assumption might not necessarily be justified in asymmetric treatment. Assuming that the partner cooperates, free-riding then provides each agent with the percentage increase in payoff shown in Table 17. In asymmetric treatment therefore, the less-able agent Y1 has greater incentive to free-ride than the more-able agent Y2.
[Insert Table 17 about here]
To test the hypothesis that both agents display common behaviour in asymmetric treatment, despite the incentive differences, we have included a dummy variable
(dummy = 1 for agent Y ) for this treatment and run a Probit regression with random 1 effects on the following variables:
[Insert Table 18 about here]
From the above table, it is clear that, despite incentive differences between agents, no significant difference in agent behaviour can be detected. For both agents, the only truly significant variable therefore is the partner's choice in the preceding round.
4.6 On the future of team cooperation
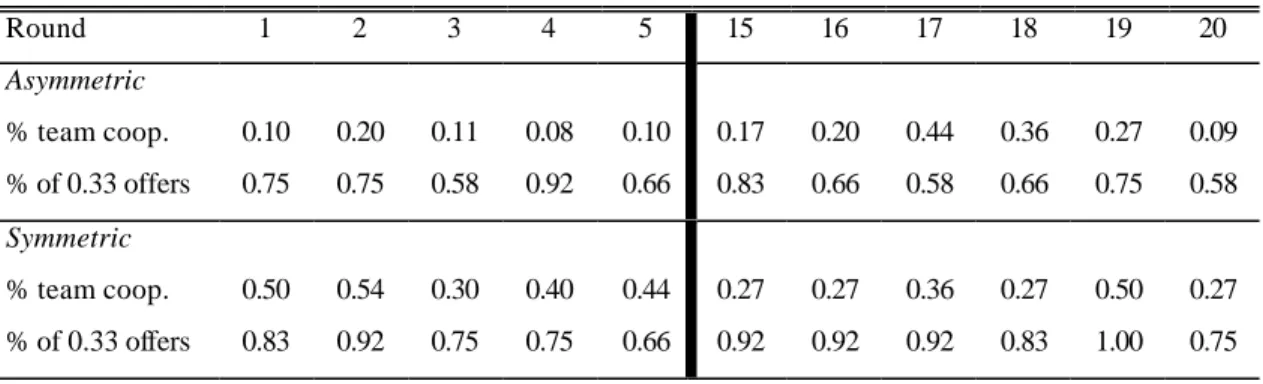
It is obviously difficult to extrapolate what was observed over 20 rounds to what may have transpired had the number of rounds been increased considerably. A closer look at the evolution in team cooperation rates over the rounds is perhaps instructive. Table 19 below shows the rates of both team cooperation and the 0.33 contract offers over the first five and last five rounds.
[Insert Table 19 about here]
In symmetric treatment, as partially revealed by this table, a steady decrease in team cooperation occurs in spite of a high level of 0.33 contract offers. In regressing over the 20 rounds the rate of team cooperation on the round number, the following equation is derived (with P>|t| in parentheses):
rate of team coop = - 0.008 round + 0.458 (0.034) (0.000)
This expression is basically in agreement with the decrease in predicted probability of cooperation for both agents over the rounds (see Table 16). This declining probability over time in symmetric treatment is consistent with behaviour observed in the one-shot and finitely-repeated prisoner's dilemma (Cooper, DeJong and Forsythe, 1996) as well as in the sequential prisoner's dilemma (Clark and Sefton, 2001).
In asymmetric treatment, apart from a pronounced end-game effect for team cooperation by the 20th round, an increase in team cooperation rate over time is roughly visible. Running a similar regression as for symmetric treatment, the following expression is obtained (with P>|t| in parentheses):
rate of team coop = 0.0118 round (0.000)
This result is in basic agreement with the increase in predicted probability of team cooperation over the rounds (see Table 15). This rising probability over time in asymmetric treatment could simply suggest that learning cooperative behaviour takes more time when agents vary in their ability. This assumption is consistent with Hansen (1997), who showed that introducing a group incentive plan immediately gives rise to free-riding, whereas its positive impact on effort is delayed by several months.
This divergent evolution (which partly reflects the divergent evolution of team cooperation probabilities obtained in the panel analysis) should perhaps be kept in mind before concluding that symmetric treatment will always lead to greater efficiency. It is possible to estimate the efficiency of both types of treatment by comparing the average total group earnings obtained in each treatment to that which could have been obtained by moving from free-riding in a 0.50 contract to cooperation in a 0.33 contract. The potential gain from such a move is (550-360) = 190 in asymmetric treatment and (238-126) = 112 in symmetric treatment. With an average total group earnings of 361.79 in asymmetric treatment and 168.76 in symmetric treatment, the efficiency of asymmetric treatment is only equal to (361.79-360)/190 = 0.0094, while that of symmetric treatment is (168.76-126)/112 = 0.3817.
5. Conclusion
Does team-based compensation give rise to problems when workers vary in their ability ? Facing a team of two agents with either similar (symmetric treatment) or different abilities (asymmetric treatment), a principal usually offers a 0.33 contract although she could keep half of the outcome for herself (i.e. a 0.5 contract). In both treatments, this choice is motivated by the fear of a contract rejection by the agents. As a matter of fact, such a rejection is a means by which agents can punish the principal for not offering a more advantageous contract. In a homogeneous team, a 0.33 contract is also designed to encourage the team members to cooperate instead of free-ride. In contrast, this objective is expected to be more difficult to reach when the agents vary in their ability; therefore, the principal ceases trying to monitor her heterogeneous team through contract offer.
Once the contract has been accepted, though this principal multi-agent relationship is triadic most agents behave as if they were involved in a bilateral relationship. In heterogeneous team, agents focus more heavily on their teammate’s behaviour than on the principal’s offer. In this case, regardless of the level of team-based compensation, agents reveal to be unable to coordinate and therefore a large amount of free-riding occurs within the team. In contrast, agents in homogeneous team are better able to use the contract offer as a coordination device among themselves to achieve higher efficiency. However, the future of cooperation remains an open question since the probability of team cooperation increases over time in asymmetric treatment, while decreasing in symmetric treatment.
References
Booth, A., Frank, J., 1999. Earnings, Productivity, and Performance-Related Pay. Journal of Labor Economics 17 (3), 447-463.
Carpenter, J.P., 1999. Mutual Monitoring in Teams: Theory and Experimental Evidence. Middlebury College, mimeo.
Clark, K., Sefton M., 2001. The Sequential Prisoner’s Dilemma: Evidence on Reciprocation. Economic Journal 111 (468), 51-68.
Cooper, R., deJong D.V., Forsythe R., 1996. Cooperation without Reputation: Experimental Evidence from Prisoner’s Dilemma Games. Games and Economic Behavior 12, 187-218.
Encinosa, W.E., Gaynor M., Rebitzer J.B., 1997. The Sociology of Groups and the Economics of Incentives: Theory and Evidence on Compensation Systems. NBER Working Paper, 5953.
Erev, I., Bornstein, G., Galili, R., 1993. Constructive Intergroup Competition as Solution to the Free Rider Problem: A Field Experiment. Journal of Experimental Social Psychology 29, 463-478.
Farell, J., Scotchmer S., 1988. Partnerships. Quarterly Journal of Economics 103 (2), 279-297.
Fehr, E., Gächter, S., Kirchsteiger G., 1997. Reciprocity as a Contract Enforcement Device: Experimental Evidence. Econometrica 65, 833-860.
Fehr, E., Gächter, S., 1998. How Effective are Trust- and Reciprocity-Based Incentives? In: Ben-Ner, A. and Putterman, L. (Eds.), Economics, Values and Organizations. Cambridge University Press, Cambridge.
Fitzroy, F.R., Kraft, K., 1995. On the Choice of Incentives in Firms. Journal of Economic Behavior and Organization 26, 145-160.
Fleurbaey, M., Maniquet, F., 1999. Cooperative Production with Unequal Skills: The Solidarity Approach to Compensation. Social Choice and Welfare 16, 569-583.
Gaynor, M., Pauly M.V., 1990. Compensation and Productive Efficiency in Partnerships: Evidence from Medical Group Practice. Journal of Political Economy 98 (3), 544-573.
Güth, W., Königstein, M., Kovacs, J., Zala-Mezo, E., 1999. Discriminating Incentive Schemes in one Principal Multiple-Agents Situations: A Theoretical and Experimental Analysis. Humboldt University, mimeo.
Hansen, D.G., 1997. Worker Performance and Group Incentives: A Case Study. Industrial and Labor Relations Review 51 (1), 37-49.
Holmström, B., 1982. Moral Hazard in Teams. Bell Journal of Economics 13 (2), 324-339.
Ichniowski, C., Shaw, K., Prennushi, G., 1997. The Effects of Human Ressource Management Practices on Productivity: A Study of Steel Finishing Lines. American Economic Review 87 (3), 291-313
Kandel E., Lazear, E.P., 1992. Peer Pressure and Partnerships. Journal of Political Economy 100 (4), 801-817.
Lazear, E.P., 2000. Performance Pay and Productivity. American Economic Review 90 (5), 1346-1361.
Leibowitz, A., Tollison, R., 1980. Free-Riding, Shirking and Team Production in Legal Partnerships. Economic Inquiry, 18, 380-394.
Meidinger, C., Rullière, J.L., Villeval, M.C., 2001. Free-Riding and Fairness in Principal-Multi-Agent Relationships. Rivista Internazionale di Scienze Sociali, Forthcoming.
Nalbantian, H.R., Schotter, A., 1997. Productivity under Group Incentives: An Experimental Study. American Economic Review 87 (3), 314-341.
Newhouse, J.P., 1973. The Economics of Group Practice. Journal of Human Resources 8 (1), 37-56.
Prendergast, C., 1999. The Provision of Incentives in Firms. Journal of Economic Literature 37 (1), 7-63.
Rossi, A., Warglien, M., 1999. Fairness in Hierarchical Triangles: An Experimental Study. University of Trento, mimeo.
Van Dijk, F., Sonnemans, J., van Winden, F., 2001. Incentives Systems in a Real Effort Experiment. European Economic Review 45, 187-214.
Van Huyck, J.B., Battalio R.C., Beil R.O, 1990. Tacit Coordination Games, Strategic Uncertainty, and Coordination Failure. American Economic Review 80 (1), 234-248.
Weiss, A., 1987. Incentives and Worker Behavior. In: Nalbantian, H.R. (Ed.), Information, Incentives and Risk Sharing. Rowman & Littlefield, Towota N.J., 137-150.
Weitzman, M.L., Kruse D.L., 1990. Profit-Sharing and Productivity. In: Blinder, A.S. (Ed.), Paying for Productivity: A Look at the Evidence. Brooking Institutions, Washington D.C., 95-140.
Appendix A: Instructions for the symmetric treatment
You will be participating in an economics experiment in which you can earn money. The amount of your earnings will depend not only on your decisions, but also on the decisions of the other participants.
This session consists of 20 periods. During each period, a subject X interacts with two subjects Y1 and Y2. You will be assigned one of these three roles (either X, Y1 or Y2) at random. You will keep the same role and interact with the same two other partic ipants throughout these 20 periods. You will never be informed of the identity of these participants.
Roles
q Subjects Y1 and Y2 are, as a team, to compose a pie, which will be shared among the three subjects; the amount of this pie is given in ECU (Experimental Currency Units).
q Subject X has to propose to Y1 and Y2 a scheme for sharing the pie.
Decision stages
Each period consists of two stages.
q Stage 1: Subject X decides whether to keep for himself either half or one-third of the pie to
be composed. The remainder will be shared equally between Y1 and Y2.
q Stage 2: Subjects Y1 and Y2 are informed of X’s decision. They then have to decide
whether to accept or reject this offer.
v If at least one subject rejects X’s offer, the period is over and the payoff of X, Y1 and Y2 is zero for the period.
v If both Y1 and Y2 accept X’s decision, each of them then has to choose between two numbers: 6 or 14.
This decision takes into account the two following elements:
- These two individual choices determine the size of the pie to be shared, which amounts to the sum of 12 times the number chosen by Y1 and Y2.
- In choosing the number 6, Y1 or Y2 bears a cost of 9 ECU, which will be deducted from his share of the pie. In choosing the number 14, Y1 or Y2 bears a cost of 49 ECU to be deducted from his share of the pie.
At the end of the period, X, Y1 and Y2 are informed of the numbers chosen by Y1 and Y2 as well as of the payoffs net of cost for each of them.
Two examples, from among the range of possibilities, are given below:
1st example:
X decides to keep half the pie
Y1 chooses the number 6 Y2 chooses the number 14 The pie amount then sums to: 12 × (6 + 14) = 240
X earns 240 / 2 = 120
Y1 earns [(120 / 2) - 49] = 51 Y2 earns [(120 / 2) - 49] = 11
2nd example:
X decides to keep one-third of the pie
Y1 chooses the number 14 Y2 chooses the number 14 The pie amount then sums to: 12 × (14 + 14) = 336
X earns 336 / 3 = 112
Y1 earns [(336 / 3) - 49] = 63 Y2 earns [(336 / 3) - 49] = 63
More generally, all of the possible decisions yield the following payoffs, net of costs (in ECU):
If X keeps one-third of the pie
ê ê
If X keeps half the pie
ê ê
Number chosen by Y2 Number chosen by Y2
6 14 6 14 6 48 39 39 80 71 31 6 72 27 27 120 51 11 Number chosen by Y1 14 80 31 71 112 63 63 Number chosen by Y1 14 120 11 51 168 35 35
The values in bold represent the numbers chosen by Y1 and Y2. In each cell, you can read 3 numbers corresponding, respectively, to:
X's payoff
Y1's payoff, net of costs Y2's payoff, net of costs
At the end of the session, you will be paid in French francs, in accordance with the following set of rules:
q 100 ECU = 5 FF
q Your final payoff is equal to the sum of your payoffs in each of the 20 periods. In addition, you will receive a show-up fee of 15 FF.
q You will be paid in a separate room in order to preserve the confidentiality of your payoff.
If you have any questions regarding these instructions, please raise your hand; your question will be answered in private. Throughout the entire session, talking is not allowed. Any violation of this rule will result in being excluded from the session and not receiving payment.
Appendix B . Instructions for the asymmetric treatment
You will be participating in an economics experiment in which you can earn money. The amount of your earnings will depend not only on your decisions, but also on the decisions of the other participants.
This session consists of 20 periods. During each period, a subject X interacts with two subjects Y1 and Y2. You will be assigned one of these three roles (either X, Y1 or Y2) at random. You will keep the same role and interact with the same two other participants throughout these 20 periods. You will never be informed of the identity of these participants.
Roles
q Subjects Y1 and Y2 are, as a team, to compose a pie, which will be shared among the three subjects; the amount of this pie is given in ECU (Experimental Currency Units).
q Subject X has to propose to Y1 and Y2 a scheme for sharing the pie.
Decision stages
Each period consists of two stages.
q Stage 1: Subject X decides whether to keep for himself either half or one-third of the pie to
be composed. The remainder will be shared equally between Y1 and Y2.
q Stage 2: Subjects Y1 and Y2 are informed of X’s decision. They then have to decide
whether to accept or reject this offer.
v If at least one subject rejects X’s offer, the period is over and the payoff of X, Y1 and Y2 is zero for the period.
v If both Y1 and Y2 accept X’s decision, each of them then has to choose between two numbers: 12 or 22.
This decision takes into account the two following elements:
- These two individual choices determine the size of the pie to be shared, which amounts to the sum of 12 times the number chosen by Y1 and 24 times the number chosen by Y2.
- In choosing the number 12, Y1 or Y2 bears a cost of 36 ECU, which will be deducted from his share of the pie. In choosing the number 22, Y1 or Y2 bears a cost of 121 ECU to be deducted from his share of the pie.
At the end of the period, X, Y1 and Y2 are informed of the numbers chosen by Y1 and Y2 as well as of the payoffs net of cost for each of them.
Two examples, from among the range of possibilities, are given below:
1st example:
X decides to keep half the pie
Y1 chooses the number 12 Y2 chooses the number 22 The pie amount then sums to: (12 × 12) + (24 × 22) = 672 X earns 672 / 2 = 336
Y1 earns [(336 / 2) - 36] = 132 Y2 earns [(336 / 2) - 121] = 47
2nd example:
X decides to keep one-third of the pie
Y1 chooses the number 22 Y2 chooses the number 22 The pie amount then sums to: (12 × 22) + (24 × 22) = 792 X earns 792 / 3 = 264
Y1 earns [(792 / 3) - 121] = 143 Y2 earns [(792 / 3) - 121] = 143
More generally, all of the possible decisions yield the following payoffs, net of costs (in ECU):
If X keeps one-third of the pie
ê ê
If X keeps half the pie
ê ê
Number chosen by Y2 Number chosen by Y2
12 22 12 22 12 144 108 108 224 188 103 12 216 72 72 336 132 47 Number chosen by Y1 22 184 63 148 264 143 143 Number chosen by Y1 22 276 17 102 396 77 77
The values in bold represent the numbers chosen by Y1 and Y2. In each cell, you can read 3 numbers corresponding, respectively, to:
X's payoff
Y1's payoff, net of costs Y2's payoff, net of costs
At the end of the session, you will be paid in French francs, in accordance with the following set of rules:
q 100 ECU = 2.5 FF
q Your final payoff is equal to the sum of your payoffs in each of the 20 periods. In addition, you will receive a show-up fee of 15 FF.
q You will be paid in a separate room in order to preserve the confidentiality of your payoff.
If you have any questions regarding these instructions, please raise your hand; your question will be answered in private. Throughout the entire session, talking is not allowed. Any violation of this rule will result in being excluded from the session and not receiving payment.
Tables
Table 1: Agents' payoffs in symmetric treatment
Y2 Y2
0.5 Contract
Free-riding Cooperation 0.33 Contract Free-riding Cooperation Free-riding 27 27 51 11 Free-riding 39 39 71 31 Y1 Cooperation 11 51 35 35 Y1 Cooperation 31 71 63 63
Table 2: Principal's payoffs in symmetric treatment
Y2 Y2 0.5 Contract Free-riding Cooperation 0.33 Contract Free-riding Cooperation Free-riding 72 120 Free-riding 48 80 Y1 Cooperation 120 168 Y1 Cooperation 80 112
Table 3: Agents' payoffs in asymmetric treatment
Y2 Y2
0.5 Contract
Free-riding Cooperation 0.33 Contract Free-riding Cooperation Free-riding 72 72 132 47 Free-riding 108 108 188 103 Y1 Cooperation 17 102 77 77 Y1 Cooperation 63 148 143 143
Table 4: Principal's payoffs in asymmetric treatment
Y2 Y2
0.5 Contract
Free-riding Cooperation 0.33 Contract Free-riding Cooperation Free-riding 216 336 Free-riding 144 224 Y1
Cooperation 276 396 Y1 Cooperation 184 264
Table 5: Payoffs according to treatment and strategies
Symmetric treatment Free-riding with a 0.50 contract Cooperation with a 0.33 contract Principal's payoff Agent's payoff 72 35 112 63
Asymmetric treatment Free-Riding with a 0.50 contract Cooperation with a 0.33 contract Principal's payoff Agent's payoff 216 72 264 143
Table 6: Summary statistics
Symmetric Treatment Asymmetric Treatment Total Principal's offers (*) share = 0.5 share = 0.33 40 (16.67) 200 (83.33) 61 (25.20) 179 (74.80) 101 (21.04) 379 (78.96) Sum 240 240 480 Acceptance (*) share = 0.5 share = 0.33 15 (37.50) 198 (99.00) 34 (55.74) 174 (97.20) 49 (48.51) 372 (98.15) Sum 213 (88.75) 208 (86.66) 421 (87.7) Team cooperation (**) share = 0.5 share = 0.33 1 (6.60) 79 (39.90) 2 (5.89) 26 (14.94) 3 (6.12) 105 (28.22) Sum 80 (37.56) 28 (13.46) 108 (25.65) Team free-riding (**) share = 0.5 share = 0.33 11 (73.40) 38 (19.20) 24 (70.58) 90 (51.72) 35 (71.43) 128 (43.41) Sum 49 (23.00) 114 (54.81) 163 (38.72) Team partial cooperation (**)
share = 0.5 share = 0.33 3 (20.00) 81 (40.90) 8 (23.53) 58 (33.34) 11 (22.45) 139 (37.37) Sum 84 (39.44) 66 (31.73) 150 (35.63) Note: (*) The percentages in parentheses are based on contracts offered. (**) = The percentages in parentheses are based on contracts accepted.
Table 7: Issues played in asymmetric treatment
Y2 Y2
Share: 0.33
Free-riding Coop. Share: 0.50 Free-riding Coop. Free-riding 90 32 Free-riding 24 4 Y1
Coop. 26 26
Y1
Coop. 4 2
Table 8: Issues played in symmetric treatment
Y2 Y2 Share: 0.33 Free-riding Coop. Share: 0.50 Free-riding Coop. Free-riding 38 29 Free-riding 11 2 Y1 Coop. 52 79 Y1 Coop. 1 1
Table 9: Symmetric treatment (N = 228)
Share Regression 1 Regression 2 Coeff. P>|z| Coeff. P>|z| Accept_1 1.37387 0.000 1.48813 0.000 (Accept_1)(teamfr_1) -0.93244 0.001 -0.89424 0.001 Round 0.02268 0.270 Constant -0.08867 0.801 Log likelihood Wald χ2 -85.555 25.00 -86.288 59.16
Table 10: Asymmetric treatment (N = 228)
Share Regression 1 Regression 2
Coeff. P>|z| Coeff. P>|z| Accept_1 -0.07143 0.814 (Accept_1)(teamfr_1) 0.14434 0.529 Round -0.01062 0.549 Constant 0.90299 0.018 0.7775 0.055 Wald χ2 = 0.68 prob > χ2 = 0.87
Table 11: Probability of a 0.33 contract offer
Behaviour during the previous round Probability of
share = 0.33 Contract rejection Contract acceptance with team free-riding
Contract acceptance without team free-riding
Symmetric treatment 0.50 0.723 0.932
Table 12: Contract acceptance by the team (N = 480) Regression 1 Regression 2 Team acceptance Coeff. P>|z| Coeff. P>|z| Share 2.5164 0.000 2.5109 0.000 Treatment 0.1213 0.688 Round 0.0307 0.094 0.0306 0.095 Constant -0 .5624 0.075 -0.4952 0.062 Log likelihood of regression
Wald χ2
-99.5045 91.60
-99.5851 91.08
Table 13: Individual acceptance (N = 798)
Regression 1 Regression 2 Individual acceptance Coefficient P>|z| Coefficient P>|z| Share 1.9372 0.000 2.1850 0.000 Y_icoop_1 0.0137 0.949 Round 0.0372 0.035 0.0349 0.001 Treatment 0.0854 0.727 Constant 0.1276 0.660 Log likelihood Wald χ2 115.6694 69.11 158.8145 193.99
Table 14: The determinants of team cooperation (N = 421)
Regression 1 Regression 2 Team cooperation Coefficient P>|z| Coefficient P>|z|
Share 0.8380 0.025 0.8421 0.024 Round -0.0025 0.865 Treatment -1.253 0.000 -1.2519 0.000 Constant -1.2744 0.002 -1.3051 0.001 Log likelihood Wald χ2 -170.9945 24.15 -170.0009 24.56
Table 15: The determinants of team cooperation in each treatment Team coop. Asymmetric Regression 1 Regression 2 Team coop. Symmetric
Coeff. P>|z| Coeff. P>|z| Coeff. P>|z|
Share 1.6161 0.006 Share 0.2272 0.658 Round -0.0413 0.036 Round 0.0498 0.038 0.0481 0.042 Constant -1.6446 0.008 Constant -2.4613 0.000 -2.2706 0.000 Log likelihood Waldχ2 -96.9043 11.62 Log likelihood Waldχ2 -67.065 4.33 -67.1636 4.15 (N = 213) (N = 208)
Table 16: Individual cooperation between types of treatment
Regression 1 Regression 2 Symmetric Coeff. P>|z| Asymmetric Coeff. P>|z| Coeff. P>|z| Share 1.2423 0.000 Share 0.2897 0.230 Y_icoop_1 0.2748 0.095 Y_icoop_1 0.7151 0.000 0.6999 0.000 Round -0.0349 0.011 Round 0.0045 0.749 Constant -0.7851 0.029 Constant -1.1447 0.000 -0.8492 0.000 Log likelihood Wald χ2 -211.2617 25.11 Log likelihood Wald χ2 -183.8326 17.58 -184.6053 16.01 (N = 374) (N = 350)
Table 17: Individual incentive to free-ride in asymmetric treatment
Agent Y1 Agent Y2 Share = 0.33 31.46 3.50 Share = 0.50 71.40 32.47
Table 18: Difference in agents' behaviour in asymmetric treatment (N = 350)
Agent coop Share Dummy*share Y_i coop_1 Dummy*Y_icoop_1 Round Dummy Const.
Coeff. P>|z| 0.4615 0.155 -0.3373 0.426 0.7814 0.001 -0.0897 0.783 0.0045 0.748 0.1146 0.777 -1.2145 0.001
Table 19: Rates of team cooperation and 0.33 contract offers
Round 1 2 3 4 5 15 16 17 18 19 20 Asymmetric % team coop. % of 0.33 offers 0.10 0.75 0.20 0.75 0.11 0.58 0.08 0.92 0.10 0.66 0.17 0.83 0.20 0.66 0.44 0.58 0.36 0.66 0.27 0.75 0.09 0.58 Symmetric % team coop. % of 0.33 offers 0.50 0.83 0.54 0.92 0.30 0.75 0.40 0.75 0.44 0.66 0.27 0.92 0.27 0.92 0.36 0.92 0.27 0.83 0.50 1.00 0.27 0.75
Figures
Figure 1: Team behaviour as a function of treatment
0% 10% 20% 30% 40% 50% 60% 70% 80% 90% 100% Symmetric 0.50 Symmetric 0.33 Asymmetric 0.50 Asymmetric 0.33 Team Free-Riding Partial Cooperation Team Cooperation
Figure 2: Rejection rates as a function of contracts
0 10 20 30 40 50 60 70 Contracts 0.33 Contracts 0.50 Asymmetric treatment Symmetric treatment
Figure 3: Evolution of acceptance probability over time 1 20 .32111 .995698 1 20 Share = 0.50 Share = 0.33
Figure 4: Probability of team cooperation over time in symmetric treatment shareX==0.50 1 20 .006727 .472161 shareX==0.33 1 20
Figure 5: Probability of team cooperation over time in asymmetric treatment
1 20
.013122 .09516