HAL Id: hal-00302859
https://hal.archives-ouvertes.fr/hal-00302859
Submitted on 8 Jun 2007HAL is a multi-disciplinary open access
archive for the deposit and dissemination of sci-entific research documents, whether they are pub-lished or not. The documents may come from teaching and research institutions in France or abroad, or from public or private research centers.
L’archive ouverte pluridisciplinaire HAL, est destinée au dépôt et à la diffusion de documents scientifiques de niveau recherche, publiés ou non, émanant des établissements d’enseignement et de recherche français ou étrangers, des laboratoires publics ou privés.
Development and evaluation of an operational SDS
forecasting system for East Asia: CUACE/DUST
C. H. Zhou, S. L. Gong, X. Y. Zhang, Y. Q. Wang, T. Niu, H. L. Liu, T. L.
Zhao, Y. Q. Yang, Q. Hou
To cite this version:
C. H. Zhou, S. L. Gong, X. Y. Zhang, Y. Q. Wang, T. Niu, et al.. Development and evaluation of an operational SDS forecasting system for East Asia: CUACE/DUST. Atmospheric Chemistry and Physics Discussions, European Geosciences Union, 2007, 7 (3), pp.7987-8015. �hal-00302859�
ACPD
7, 7987–8015, 2007
SDS numerical forecast system in
Asia and its performance C. H. Zhou et al. Title Page Abstract Introduction Conclusions References Tables Figures ◭ ◮ ◭ ◮ Back Close
Full Screen / Esc
Printer-friendly Version Interactive Discussion
Atmos. Chem. Phys. Discuss., 7, 7987–8015, 2007 www.atmos-chem-phys-discuss.net/7/7987/2007/ © Author(s) 2007. This work is licensed
under a Creative Commons License.
Atmospheric Chemistry and Physics Discussions
Development and evaluation of an
operational SDS forecasting system for
East Asia: CUACE/DUST
C. H. Zhou1, S. L. Gong1,2, X. Y. Zhang1, Y. Q. Wang1, T. Niu1, H. L. Liu1, T. L. Zhao2, Y. Q. Yang1, and Q. Hou1
1
Centre for Atmosphere Watch & Services (CAWAS), Chinese Academy of Meteorological Sciences, China Meteorological Administration (CMA), Beijing 100081, China
2
Air Quality Research Division, Science & Technology Branch, Environment Canada, 4905 Dufferin Street, Toronto, Ontario M3H 5T4, Canada
Received: 27 March 2007 – Accepted: 23 May 2007 – Published: 8 June 2007 Correspondence to: C. H. Zhou (zhouch@cma.gov.cn)
ACPD
7, 7987–8015, 2007
SDS numerical forecast system in
Asia and its performance C. H. Zhou et al. Title Page Abstract Introduction Conclusions References Tables Figures ◭ ◮ ◭ ◮ Back Close
Full Screen / Esc
Printer-friendly Version Interactive Discussion
Abstract
CUACE/Dust, an operational sand and dust storm (SDS) forecasting system for East Asia, was developed at CMA (China Meteorological Administration) by integrating a meso-scale dust aerosol model with a 3DVar data assimilation system that uses both surface network observation data and dust intensity data retrieved from the Chinese 5
Geostationary Satellite FY-2C. For spring 2006, CUACE/Dust successfully forecasted most of the 31 SDS episodes in East Asia. A detailed comparison of the modeling predictions for the 8–12 March episode with surface network observations and lidar measurements revealed a robust forecasting ability of the system. The time series of the forecasted dust concentrations for a number of representative stations for the whole 10
spring 2006 were also evaluated against surface PM10 monitoring data, showing a very good agreement in terms of the SDS timing and magnitudes near source regions where dust aerosols dominate. For the entire domain forecasts in spring 2006 (1 March–31 May), a TS (thread score) system evaluated the performance of the system against all available observations and rendered an averaged TS value of 0.31 for 24 h forecasts, 15
0.23 for 48 h and 0.21 for 72 h forecasts.
1 Introduction
As a natural weather phenomenon, sand and dust storm plays an important role in global climate changes. Its radiative forcing is estimated to be –0.6∼0.4 w m−2 with
great uncertainties (IPCC, 2001). Dust storms throughout Asia, Middle East and North-20
ern Africa are estimated to cycle more than 200 to 5000 Mt/year of mineral dust into the earth’s atmosphere (Tegen and Fung, 1994) with a total emission of about 800 Mt/year from Asia alone (Zhang et al., 1997). Although with a great interannual variability (Gong et al., 2006), most Asia SDS occurs in spring time. The frequency of SDS ranges from one day per year in most part of North China to about 100 days per year in places near 25
the desert like Yan Chi (Zhou, 2001). Dust storms directly cause low atmospheric visi-7988
ACPD
7, 7987–8015, 2007
SDS numerical forecast system in
Asia and its performance C. H. Zhou et al. Title Page Abstract Introduction Conclusions References Tables Figures ◭ ◮ ◭ ◮ Back Close
Full Screen / Esc
Printer-friendly Version Interactive Discussion
bility, thus impact the commercial and military operations and people’s daily life in dust prone regions. In these regions, the surface vegetation can also be destroyed when the plants are covered with heavy mineral particles or have been blown up by strong sandy wind during SDS. Unlike coarse mineral particles which deposit in and near the source regions, finer particles are suspended in the air for a longer time and more 5
easily transported to a place far away from the source areas. They can also take in or be taken by other chemical components like BC, OC or sulfate during the transports. These finer particles, especially with the diameter less than 10 µm, can be freely haled into human bodies to cause health problems. Some severe SDS could be a disaster like the one with visibility less than 50 m occurred 5 May in 1995 in Jin Chang, Gansu 10
province of China which caused 85 fatalities and 31 missing. To alleviate SDS impacts, a very effective way is to issue forecast and early warning information in dust prone regions.
Many attempts have been made for SDS simulations and forecasts. Those models, including NARCM (Gong et al., 2003b) from Canada, DREAM from Spain (Pe’rez et al., 15
2006) and CFORS (Uno et al., 2001) in Japan, have simulated SDS occurrence, trans-port and depositions. The model results show relatively good agreement with routine and intensified SDS observation such as satellite data, surface TSP (total suspended particle) and PM10 horizontal and vertical distributions. Because of varieties of dust emission schemes, horizontal and vertical resolutions, numerical methods, and differ-20
ent meteorological models, eight models from different counties show quite different performance for Asian dust episodes in March and April of 2003 in terms of flux, trans-port, horizontal and vertical distribution outputs in the DMIP project (Uno et al., 2006), which concluded that reliable surface land use conditions and soil/surface information are more important than the complexity of the dust emission scheme or the model 25
horizontal resolution.
In real time SDS forecasting, it is difficult to reproduce the soil-related land surface conditions for emissions. It may make the forecasting more difficult with the bias in me-teorological forecasts such as wind speed and precipitations. There are two ways to
al-ACPD
7, 7987–8015, 2007
SDS numerical forecast system in
Asia and its performance C. H. Zhou et al. Title Page Abstract Introduction Conclusions References Tables Figures ◭ ◮ ◭ ◮ Back Close
Full Screen / Esc
Printer-friendly Version Interactive Discussion
leviate these shortcomings. One is to upgrade more “real-time” wind erosion database including soil size distribution, deserts distribution, soil/dust size distribution and soil water etc. Another is to establish SDS data assimilation systems with satellite and/or surface observations to improve the SDS initial condition in the numerical systems.
This paper presents a SDS forecasting system – CUACE/Dust (Chinese Unified At-5
mospheric Chemistry Environment – Dust) developed by coupling dust aerosol micro-physics onto a mesoscale meteorological model with an improved SDS vertical dif-fusion and 3-D advection schemes at CMA. With CUACE/Dust, three-day SDS real time forecasting and early warning information has been issued in spring time from March to May in East Asia since 2005. In this paper, the frame and configurations of 10
CUACE/Dust, including the emission scheme together with a sand erosion database, improved advection and transport schemes, and a 3Dvar SDS data assimilation sys-tem, will be introduced. Then the model forecasting ability was analyzed and evaluated for the dust episodes in 2006 by comparing with surface dust and PM10 concentra-tions of the CMA observation networks and vertical structure from Lidar observaconcentra-tions 15
of NIES of Japan. The model average forecasting ability was also analyzed in the entire domain by a SDS scoring system with TS scores, misses, false alarms and forecast accuracy developed at CMA.
2 Description of CUACE/Dust
CUACE has been designed as a unified chemistry module which can be easily coupled 20
onto any atmospheric models at various temporal and spatial scales. It compasses a chemistry interface for tracers of aerosols and gases, which passes the atmospheric backgrounds like wind, temperature and humidity together with model configurations into the chemistry module to calculate the chemical/physical processes for the trac-ers. The chemical fields can also be fed back into the host model for aerodynamic 25
processes like diffusion and advection and post analysis through the interface. The chemistry module for aerosols in CUACE is a size-segregated multi-component
ACPD
7, 7987–8015, 2007
SDS numerical forecast system in
Asia and its performance C. H. Zhou et al. Title Page Abstract Introduction Conclusions References Tables Figures ◭ ◮ ◭ ◮ Back Close
Full Screen / Esc
Printer-friendly Version Interactive Discussion
rithm for all types of aerosols such as dust, sea salt, BC/OC, sulfate, nitrate and am-monium (Gong et al., 2003a). It includes major aerosol processes in the atmosphere such as the generation, hygroscopic growth, coagulation, nucleation, condensation, dry depositions, scavenging and aerosol activations.
2.1 Dust aerosol in CUACE 5
CUACE/Dust forecasting system was developed based on a size-segregated dust aerosol module of CAM (Canadian Aerosol Module) (Gong et al., 2003a) that was coupled into a mesoscale meteorological model – MM5 to conduct real time SDS fore-casting in Northeast Asia. A positive 3-D advection scheme called MPDATA has also been introduced and an anti-gradient diffusion scheme has been developed in the sys-10
tem for dust advection and diffusion processes, respectively.
In CUACE/Dust, all the atmospheric processes are included except for the coagu-lation and nucleation which are not important for mesoscale SDS simucoagu-lation and fore-casting. Particle size distribution plays a great role in aerosol microphysics and large scale transport processes. Studies (Zhang et al., 2003) show that the dominant mass 15
of the mineral aerosols in Northeast Asia was with diameters from 2 to 20 µm which accounts for about 53%–68% of the total mineral dust loading. It may shift slightly to course mode in heavy dust storms near the source regions and to fine mode in receptor regions. Based on the Zhang’s studies, the mineral aerosol size spectra in CUACE/Dust are divided into 12 size bins with a radius range of 0.02–0.04, 0.04– 20
0.08, 0.08–0.16, 0.16–0.32, 0.32–0.64, 0.64–1.28, 1.28–2.56, 2.56–5.12, 5.12–10.24, 10.24–15.36, 15.36–17.36, 17.36–20.72, 20.72–30 µm.
2.2 Dust emission schemes and erosion database
There are two dust emission schemes built in CUACE/Dust: (1) by Marticorena and Bergametti (1995), Alfaro et al. (1997), Alfaro and Gomes (2001) (hereinafter referred 25
com-ACPD
7, 7987–8015, 2007
SDS numerical forecast system in
Asia and its performance C. H. Zhou et al. Title Page Abstract Introduction Conclusions References Tables Figures ◭ ◮ ◭ ◮ Back Close
Full Screen / Esc
Printer-friendly Version Interactive Discussion
prehensive soil erosion database, which includes deserts and semi-deserts distribu-tions, soil grain-size, soil moisture content, snow cover, landuse and surface roughness length. For East Asia, parameters and data sets to drive these two schemes have been derived and compared (Zhao et al., 2006) . In current CUACE/Dust, the MBA scheme is used. A detailed desert distribution and soil texture data base for China was given 5
in (Gong et al., 2003b). The snow cover was retrieved from NOAA17 AVHHR at the resolution of 0.02◦
×0.02◦. 2.3 The host model – MM5
For the 2006 forecasting season, a nonhydrostatic version of MM5 was used as the me-teorological driver to host CUACE/Dust. Its horizontal dimensions are set to be 68×85 10
at a resolution of 108 km and the number of vertical sigma-levels is 24 with the sigma value for each level as 1.0, 0.996, 0.992, 0.986, 0.980, 0.970, 0.955, 0.930, 0.900, 0.860, 0.810, 0.760, 0.710, 0.660, 0.600, 0.530, 0.460, 0.390, 0.320, 0.250, 0.180, 0.110, 0.050 and 0. Ten days of meteorological forecasts from T213, an operational global medium range spectrum meteorological model with the resolution of 0.625◦, are
15
interpolated to formulate the meteorological initial, boundary and lateral conditions for MM5.
The key parameters from a host model that can significantly influence the perfor-mance of CUACE/Dust are the 3-D winds, boundary-layer turbulence, surface fluxes, cloud and precipitation as well as the soil moisture contents. They determine not only 20
the production of dust aerosol but also its long-range transports.
There are a number of improvements done to provide more reasonable parameters to drive the dust forecasts. In CUACE, a Multi-dimensional Positive Definite Advec-tion Transport Algorithm (MPDATA) (Smolarkiewicz, 2006) has been introduced as the advection scheme for all tracers. It is based on the upstream differential scheme and 25
was proposed firstly as a simple positive-definite advection scheme with small implicit diffusion for the advection of water-substance constituent in atmospheric cloud mod-els. A nonscillatory option can also be applied to this scheme to assure monotonicity.
ACPD
7, 7987–8015, 2007
SDS numerical forecast system in
Asia and its performance C. H. Zhou et al. Title Page Abstract Introduction Conclusions References Tables Figures ◭ ◮ ◭ ◮ Back Close
Full Screen / Esc
Printer-friendly Version Interactive Discussion
It is stable, consistent and conservative for positive definiteness. Vertical diffusion in sub-grid scale is often another important progress controlling the transports of tracers to the upper layer and to downwind regions. A nonlocal vertical diffusion scheme has been adopted in CUACE which is an improved approach from local-k method based on local gradients of wind and potential temperature with the deficiencies for highly unsta-5
ble conditions where the local gradients can not model the transport by large eddies representing the bulk property of the whole PBL (Hong and Pan, 1996).
2.4 Data assimilation system for CUACE/Dust
One of the unique features of CUACE/Dust system is the implementation of a three dimensional data assimilation module that combines the observations of the surface 10
monitoring networks with FY-2C SDS retrieval data (Hu et al., 2007; Niu et al., 2007). The assimilated dust concentrations have been updated as the model initial conditions everyday in the forecasting system.
2.5 Threat Score (TS) system for CUACE/Dust
A TS scoring system has been established to verify the model’s performance. The ob-15
servation for the evaluation merges the satellite retrieval information, surface synoptic observation and PM10 network in CMA (Wang et al., 20071). It can give out the veri-fication information of threat score, misses, false alarm ratio and accuracy for different forecast length at each mesh of the domain for the forecast system
1
Wang, Y. Q., Zhang, X. Y., Gong, S. L., Zhou, C. H., Hu, X. Q., Liu, H. L., Niu, T., and Yang, Y. Q.: Surface observation of sand and dust storm in East Asia and its application in CUACE/Dust forecasting system, Atmos. Chem. Phys. Discuss., submitted, 2007.
ACPD
7, 7987–8015, 2007
SDS numerical forecast system in
Asia and its performance C. H. Zhou et al. Title Page Abstract Introduction Conclusions References Tables Figures ◭ ◮ ◭ ◮ Back Close
Full Screen / Esc
Printer-friendly Version Interactive Discussion
3 Results and evaluation
Forecasting results for spring 2006 were evaluated and compared with available ob-servation data across East Asia. For a detailed description of the Chinese network observations during this period, one can refer to a companion paper (Wang et al., 20071) of this special issue. Analysis of synoptic weather patterns associated with 5
the dust storms for spring 2006 was also investigated, which defined the SDS process according to certain criteria (Yang et al., 2007).
There were 31 SDS episodes occurred from 1 March to 31 May in 2006 in Northeast (NE) Asia, among which 13 were Severe SDS, 12 were SDS and 6 were Blowing Dust (Table 1). For all the SDS episodes, 5 most striking and notorious severe SDS events 10
hit large regions and caused great damages in NE Asia, 10 transported to Beijing and 8 to Korean Peninsula and 3 to Japan Islands. The episodes 8–12 March was among the most striking ones which also hit Beijing, Korea peninsula and even to Japan. Because of its heavy extensity, magnitude, and long persistency, the case 8–12 March has been chosen to evaluate the CUACE/Dust’s performance on dust emission, vertical 15
distribution and long-range transport in the real time forecasting.
Besides the synoptic data and Chinese network observations (Wang et al., 20071), Lidar observation of back scattering intensity and depolarization ratio in every 15 min from a lidar observation network (http://www-lies.lidar.go.jp) of 10 stations were also used to compare with the forecasting results. These stations mostly located in NE Asia 20
for dust aerosol vertical distribution research since 2001 .(Sugimoto et al., 2000). Five stations named Shapotou (104.95◦E, 37.46◦N), Huhhot (111.4◦E, 40.9◦N), Beijing
(116.17◦E, 39.56◦N), Seoul (126.59◦E, 37.34◦N) and Tsukuba (140.12◦E, 36.05◦N)
from the network have been selected for vertical dust distribution comparison, rep-resenting the regions of the deserts, near source areas and downwind of the SDS 25
transport in NE Asia.
ACPD
7, 7987–8015, 2007
SDS numerical forecast system in
Asia and its performance C. H. Zhou et al. Title Page Abstract Introduction Conclusions References Tables Figures ◭ ◮ ◭ ◮ Back Close
Full Screen / Esc
Printer-friendly Version Interactive Discussion
3.1 Dust episode of 8–12 March 2006
Synoptic records show that during 8–12 March, a severe extensive SDS stroke Mon-golia, Northwest, North and Northeast China, Korea Peninsula, and Japan (Yang et al., 2007). It started at 14:00 (BST) on 8 March in Mongolia, hit China massively from 9 March and ended at 02:00 (BST) on 12 March in Korea Peninsula. SDS phenom-5
ena have been observed in Mongolia and many places in North China such as Inner Mongolia, Qinghai, Gansu, Ningxia, Shaanxi, Shanxi and Liaoning provinces. The black SDS phenomena have been observed in two stations: Zhurihe and Suniteyouqi, with zero visibility and wind speed exceeding 20 m/s and in 3 other stations nearby with visibility less than 100 m in the area of Onqin Daga Sand Areas in the afternoon 10
on 9 March. This severe SDS episode is the first and one of the strongest SDSs hit Northeast Asia in 2006.
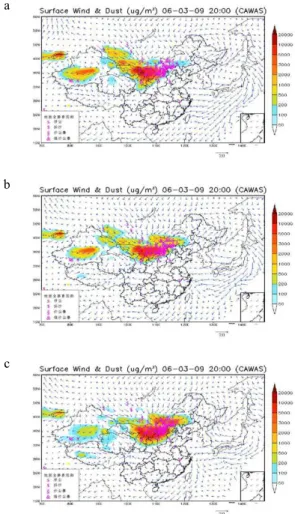
Three 72 hrs real time forecasts started at 00:00 Z of 6–8 March by CUACE/Dust successfully captured the 14 h onset of 8 March SDS originated from the west of Mon-golia where a cold air mass has swept to produce a severe SDS event. This is clearly 15
shown from the agreements between the surface dust reports observed in this region and the surface dust concentration centers from the model predictions at different fore-cast lengths (54 h, 30 h and 6 h) (Fig. 1). Forefore-casting the onset of a dust episode requires a good prediction of location and strength of the surface wind speeds and soil surface conditions. Dust emission has an apparent diurnal cycle in the source areas, 20
beginning in the morning and reaching the maximum in the afternoon and weakening thereafter. Both forecasts and observations indicated that this dust episode has not reached the class of Severe SDS until 14:00 (BST) in the afternoon on 9 March.
As the dust episode progressed, the SDS centre moved in southeast direction and its covering area increased. Figure 2 shows the 54 h, 30 h and 6 h forecast results 25
for 14:00 (BST) of 9 March with surface SDS observations, starting at 00:00 Z of 7, 8 and 9 March. All the three forecasted results show that the SDS concentrated in the region of south of Mongolia and Inner Mongolia of China, agreeing to the surface
ACPD
7, 7987–8015, 2007
SDS numerical forecast system in
Asia and its performance C. H. Zhou et al. Title Page Abstract Introduction Conclusions References Tables Figures ◭ ◮ ◭ ◮ Back Close
Full Screen / Esc
Printer-friendly Version Interactive Discussion
SDS observation with severe SDS, SDS and blowing dust observed in many stations over these regions. The 30 hrs forecasts were a little better than those of 54 h by good performance in the SDS region in and near China. The 6 h forecast was the best both in intensity and in coverage in these regions by covering all the SDS observation and without misses or false alarms when compared with the surface observation. For 5
this 6 h forecast, there were three high concentration centers. One was located at the Badain Juran, Tengger and Ulan Buh Deserts in the west of Inner Mongolia with the highest value over 20 000 µg m−3. The observed PM10 reached its peak of 6600 µg
m−3 in Ejilaqi, a station in the northwest edge of Badain Juran. Another centre was in
Onqin Daga sand areas in the east of Inner Mongolia with the highest predicted value 10
over 20 000 µg m−3 as the observed PM10 of over 6600 µg m−3 in Zhurihe, a station
in the west edge of Onqin Daga sand areas. The third one was in Middle Gobi of Mongolia with the highest forecasted value over 10 000 µg m−3.
Six hours later (9 March, 20:00 BST), the main body of the dust episode moved into China and covered most part of Inner Mongolia and part of Shaanxi, Shanxi, Hebei 15
and Liaoning provinces. The 60 h, 36 h and 12 h forecasts agreed reasonably with the surface records in and near the source areas with a missing forecast in the Onqin Daga sandy areas by the 60 h output (Fig. 3). One reason for this missing forecast is that the forecasted cold air mass along with Mongolian Cyclone has not reached there yet and located only in the west part of Inner Mongolia. Another reason is that there is a 20
less emission in the upstream Mongolia in previous prediction which causes less dust transported to this area. The other two (36 h and 12 h forecast) have forecasted the cold air-mass with the Mongolian Cyclone correctly.
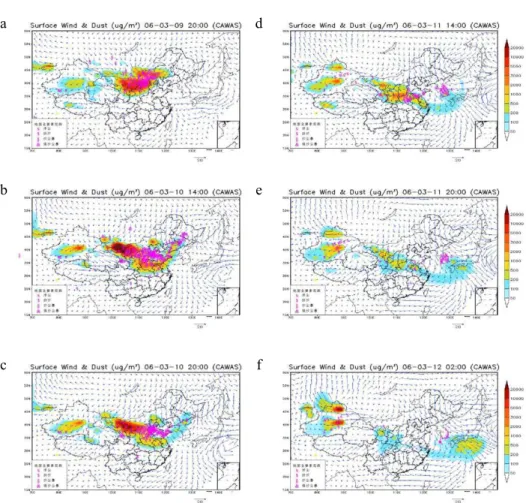
Forecasting the long-range transports of SDS is critical in providing the public enough time to reduce the damages of the SDS. From the observations, this episode 25
covered the downwind areas in east and north part of China, Korea Peninsula and Japan islands after three days from the onset. Figure 4 shows the model results fore-casted at 00:00 Z of 9 March for this long range transport. At 14:00 (BST) in the afternoon of 10 March, the forecasted surface concentration caught the SDS records
ACPD
7, 7987–8015, 2007
SDS numerical forecast system in
Asia and its performance C. H. Zhou et al. Title Page Abstract Introduction Conclusions References Tables Figures ◭ ◮ ◭ ◮ Back Close
Full Screen / Esc
Printer-friendly Version Interactive Discussion
in the west of Inner Mongolia which illustrated a new emission in this area while the front of the SDS has reached Liaoning, Bohai sea, Shangdong, Hebei, Henan, Shanxi Provinces at the moment. At 20:00 (BST) in the evening, the dust belt has moved to North Korea which was agreed by the surface observations. At 14:00 (BST) in the afternoon of 11 March, part of the dust belt still stayed in the area of Shanxi, Henan, 5
Jiangsu in China with suspended dust and haze observed in the stations over there. Another part of the dust belt has reached South Korea where there were suspended dusts observed in many stations. At 02:00 (BST) in the early morning of 12 March, there were a few suspended dusts observed in southern end of South Korea, where the forecasted dust belt was about to move out of this area.
10
Like the conventional weather forecasts, the forecast length accounts for the forecast difference and accuracy in dust concentration and meteorology and the influence of the initial assimilated SDS data. Generally speaking, shorter forecast length yielded a better result than longer forecast time. This is partially due to the ability of a meso-scale model to accurately predict the meteorology as a function of time. Another reason for 15
the difference comes mainly from the impact of SDS data assimilation. In CUACE, a 3DVAR system has assimilate the near real-time SDS data from surface SDS records and satellite retrieval SDS Infra-red differential Dust Index (SDS-IDDI) into the model to provide the initial SDS conditions. As the impact of 3Dvar initial conditions weakening, the wind filed plays a dominant role on the dust emission and transport. Due to this 20
reason, both of the outputs of 36 h and of 12 h have quite correctly forecasted the surface dust distribution and have little difference to each others (Fig. 3). More real SDS information and shorter time lag means more impact on SDS distribution which was exactly true for the case with the initial forecasting time of 00:00 Z on 9 March. Because of more surface and satellite observation information added into the model, 25
the dust concentration and distribution show much better than the other two with initial forecasting time of 00:00 Z on 7 March and on 8 March where little SDS observation information was available to be assimilated into the model prediction.
ACPD
7, 7987–8015, 2007
SDS numerical forecast system in
Asia and its performance C. H. Zhou et al. Title Page Abstract Introduction Conclusions References Tables Figures ◭ ◮ ◭ ◮ Back Close
Full Screen / Esc
Printer-friendly Version Interactive Discussion
is much higher than the spring average value of about 0.31, 0.23 and 0.21 respectively. The forecasting efficiency is 0.89, 0.85 and 0.84 for 24 h, 48 h and 72 h forecast.
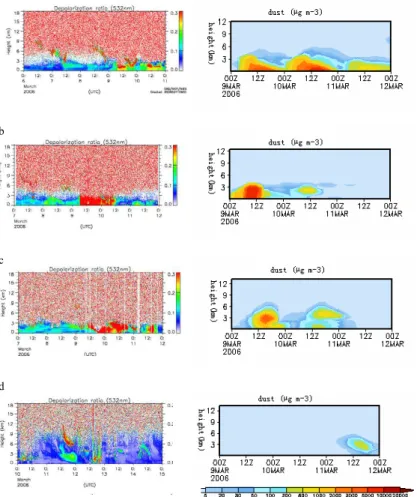
To further explore the performance of CUACE/Dust, the time-height sectional plots for this dust episode were compared with lidar observations at four stations of Shapo-tou, Huhhot, Beijing and Tskuba (Fig. 5). For ShapoShapo-tou, a station in the south of Badain 5
Juran Deserts, the predicted peak concentrations were in the layer under 1000 m, from 11:00 (BST) in the morning to 20:00 (BST) in the evening at each day from 9 March to 12 March and close to 5000, 10 000 and 1000 µg m−3 respectively. This agrees with
the lidar vertical profile observations in the station. Both the forecast and the observa-tion have a diurnal cycle which starts at about 11:00 (BST), reaches the maximum at 10
about 14:00 (BST) in the afternoon and weakens to 20:00 (BST). For Huhhot, a sta-tion to the east of Badain Juran Deserts areas, the forecasted concentrasta-tion peak of 10 000 µg m−3on 9 March starting from 11:00 (BST) to 20:00 (BST) was located under
3000 m and agreed well with the lidar observation. On 10 March, the daytime concen-tration peak with a value of 1000 µg m−3was much weaker than that of the previous
15
day, matching to the Lidar observation.
For Beijing, both model predictions and lidar observations showed that the dust storm was transported to it through the upper air and settled down to the surface at about 19:00 (BST) in the evening. The dust concentration center located at 2000–3000 m in altitude. For Tsukuba in Japan, the dust transported to its upper air over with a much 20
lower concentration of 500 µg m−3from the forecasts at a height of about 1000–6000 m
after 20:00 (BST) on 11 March when it was also the ending time of this dust episode from the surface weather stations on SDS. The relative strength and plume height of the time series were also monitored by the lidar.
The comparison in these four stations illustrates that CUACE/Dust has a good per-25
formance for the timely forecasts of dust storm arrival at most East Asian stations. This reflects the well developed micro-physical and metrological dynamic processes in the CUACE/Dust system to treat the dust emission in the source areas, vertical diffusion and horizontal transports to the downwind areas.
ACPD
7, 7987–8015, 2007
SDS numerical forecast system in
Asia and its performance C. H. Zhou et al. Title Page Abstract Introduction Conclusions References Tables Figures ◭ ◮ ◭ ◮ Back Close
Full Screen / Esc
Printer-friendly Version Interactive Discussion
3.2 Surface station comparisons
During the spring 2006, the SDS monitoring network was operating and measuring the PM10 concentrations in a number of stations (Wang et al., 20071). Five of them, representing the source regions at Tazhong, Ejilaqi and Zhurihe, and the downwind areas at Beijing and Dalian, were chosen to evaluate the forecasting performance of 5
CUACE/Dust system.
Five SDS episodes: DS5, DS16, DS26, DS27 and DS29 (Table 1 and Fig. 6a) were observed in Tazhong of the Takilimakan Deserts during spring 2006. For the severe SDS episode of DS5 on 12 March, all three forecasts (FT1, FT2 and FT3) have pre-dicted this episode. Comparing to the observed daily mean PM10 of 5011 µg m−3 for
10
this case, the forecasted total dust concentrations by three consecutive predictions had a mean daily average value of 4571 µg m−3, 3538 µg m−3 and 1023 µg m−3,
re-spectively, under-estimating the concentrations even though the model has a dust size spectrum of 40 µm. In another severe SDS episode DS16, all three FTs have fore-casted the SDS episode and the concentration peaks too. FT1 forefore-casted a total dust 15
concentration of 7363 µg m−3 which is rather comparable to the observed PM10
con-centration of 6467 µg m−3.
For the total five dust episodes, the forecasted surface dust concentrations are in a general good agreement with the trends of PM10 observations. The 24 hrs average (FT1) is closer to the observed PM10 concentrations with minor under-prediction while 20
the under-estimates for FT2 and FT3 were much higher. For local small dust events in Tazhong, the model also shows good result as to the concentration trend like day 16, day 26–29 and day 51–55. FT1 shows a little better performance than FT2 and FT3 in these days but the difference of these three mean values is not so significant as that in the SDS episodes.
25
Ejilaqi in the Badain Juran deserts recorded thirteen dust episodes during spring 2006 as shown in Fig. 6b. The time series forecasted by FT1, FT2 and FT3 agree very well with those of PM10 observations in terms of both the time of each dust storm
ACPD
7, 7987–8015, 2007
SDS numerical forecast system in
Asia and its performance C. H. Zhou et al. Title Page Abstract Introduction Conclusions References Tables Figures ◭ ◮ ◭ ◮ Back Close
Full Screen / Esc
Printer-friendly Version Interactive Discussion
and concentrations except for DS19 with a gap of about 100 µg m−3 by FT1. These
illustrate that CUACE/Dust performed much better in dust concentration magnitude at Ejilaji than that at Takilimakan Deserts.
There were also thirteen dust episodes occurred at Zhurihe, a station in the west of Onqin Daga sandy areas (Fig. 6c) in the east of Inner Mongolia, in spring 2006. 5
Like the case of Ejilaqi, forecasting results matched reasonably well with the PM10 observations at this station. FT1 shows under-predictions in six cases of DS 4, DS 7, DS 9, DS 17, DS 28 and DS 29 and does much better than FT2 and FT3 in the first four cases but worse in the last two. As the surface concentration of Zhurihe is controlled by both local emissions and transports from the upstream arid areas in Mongolia, the 10
under-estimates might indicate some weakness in CUACE/Dust system in accurately predicting local emissions in this source areas or long-range transports from Mongolia. Nine SDS events to Beijing were recorded in spring of 2006 (Fig. 6d). Predicted dust concentrations were smaller than those of PM10 observation in six SDS cases, i.e. DS 4, DS 7, DS 9, DS 13, DS 19 and DS 28. The mean values for FT1, FT2 15
and FT3 were 56, 44, 34 µg m3 respectively while the spring mean value for PM10 was 172 µg m−3. Most part of the surface dust particles in Beijing were transported
from the source areas north or northwest to Beijing through Inner Mongolia during dust events. Zhao et al. (2003) indicated that most coarse mineral particles deposit in the source regions, and the dust particles to Beijing are largely corresponding to a 1– 20
3 µm diameter range. The gap between surface SDS concentration and PM10 should be smaller than that at Tazhong, Zhurihe and Ejilaqi stations located in and near to the source areas. Besides the long-range transport, the larger gap may be explained by the location of Beijing where the PM10 observation contains much local non-dust particle pollutants with an annual average of about 142 µg m−3 (Beijing-EPA, 2006). Another
25
reason accounts for the gap is the local dust emission because most SDS events to Beijing are accompanying with heavy winds for dust emission when most land surface is still barren in spring time.
Six SDS events intruded Dalian in 2006 spring time, i.e. DS 4, DS 9, DS 13, DS 8000
ACPD
7, 7987–8015, 2007
SDS numerical forecast system in
Asia and its performance C. H. Zhou et al. Title Page Abstract Introduction Conclusions References Tables Figures ◭ ◮ ◭ ◮ Back Close
Full Screen / Esc
Printer-friendly Version Interactive Discussion
20, DS 22 and DS 28. Similar to the case of Beijing, the time series of FT1, FT2 and FT3 are reasonably coherent to those of the PM10 observation while all the 6 cases are under predicted with DS 28 missed. The biggest gap is about 419 µg m3 in DS 4 without considering the average PM10 concentration of about 100–150 µg m3in a day of no dust event by local aerosol contributions ( Air pollution Annual report from EPA). 5
FT1 did much better than that of the FT2 and FT3 during the former 4 dust events with much less under-estimates. FT2 shows relatively apparent signs of concentration peak in the former 5 dust events while its daily mean concentration is below 70 µg m3 except for one exceeding 100 µg m3 in DS20. FT3 with a daily average concentration of less than 30 µg m−3 presents much weaker signs of concentration peaks in all of
10
these cases.
3.3 TS of spring 2006
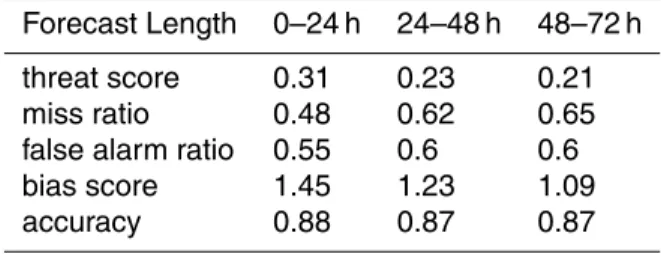
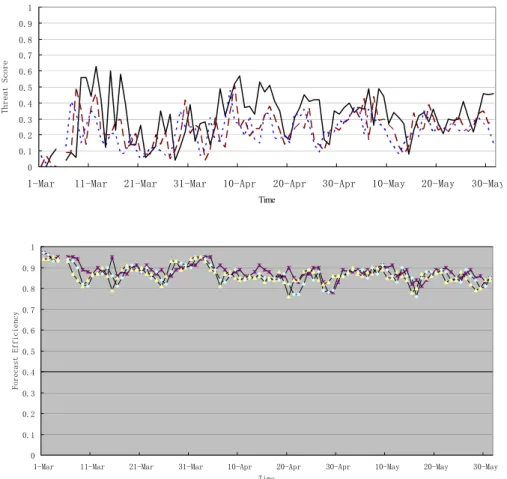
To fully evaluate the overall performance of the CUACE/Dust forecasting results for spring 2006, a TS scoring system was developed (Wang et al., 20071) to compute the threat score (TS), miss ratio (MR), false alarm ratio (FAR), and bias score (BS) 15
and accuracy (AC) for the whole model domain or part of the domain from available observations. The average TS value which is sensitive to hits and penalizes both misses and false alarms from 1 March to 31 May in 2006 is 0.31 for FT1 and decreases to 0.23 for FT2 and and 0.21 for FT3 forecasts, respectively (Table 2). CUACE/Dust performed better for dust episodes than for other days (Fig. 7). Likewise, BS also 20
decreases from 1.45 to 1.09 which means the model false alarm is small and decreases with the forecast length (BS>1 means false alarm dominant, and BS>1.5 means heavy false alarm dominant), while MS and FAR goes up correspondently as the forecast length increases. The accuracy is almost the same for these three forecast lengths and varies little in the entire spring (Fig. 7) which demonstrates that the model performance 25
ACPD
7, 7987–8015, 2007
SDS numerical forecast system in
Asia and its performance C. H. Zhou et al. Title Page Abstract Introduction Conclusions References Tables Figures ◭ ◮ ◭ ◮ Back Close
Full Screen / Esc
Printer-friendly Version Interactive Discussion
4 Conclusions
CUACE/Dust, an operational SDS forecasting system with a 3Dvar data assimilation system, is utilized for the 2006 spring SDS forecasts in East Asia. Its robust forecast ability has been demonstrated for predicting a heavy SDS episode in 8–12 March by comparing with the surface concentrations and synoptic SDS records. CUACE/Dust 5
successfully captured the production and evolution of this episode in East Asia. Com-parisons with the surface lidar measurements indicated that the model also reasonably simulated the vertical structure of SDS during this episode.
For other SDS episodes in spring 2006, time series of model predictions for DM40 were evaluated against PM10 observations at 5 representative stations. It is shown 10
that the model was able to catch almost all the dust events occurred even with local dusty days although with some under-estimates in Takalimakan and Onqin Daga sandy areas. The forecasting system’s entire behaviour has verified by a TS scoring system as well and the spring average threat score is 0.31, 0.23 and 0.21 with the average bias score is 1.45, 1.23 and 1.09 for 24 h, 48 h and 72 h forecast. The TS score for episode 15
8–12 March is 0.55, 0.34 and 0.29 for 24 h, 48 h and 72 h forecast respectively.
For more accurate forecast, more work should be done to upgrade the soil-related parameters, micro-physics and circulation with regards to the dust emission and the dust driver, meteorological fields forecast. There is also some work that should be done as to the SDS observation, especially to the vertical observation which are rare 20
but vital to model initializations and verifications.
Acknowledgements. The authors wish to thank for the financial supports from the MOST
(2004DIB3J115) and the National Basic Research Program (973) (2006CB403703 and 2006CB403701) of China for this project.
ACPD
7, 7987–8015, 2007
SDS numerical forecast system in
Asia and its performance C. H. Zhou et al. Title Page Abstract Introduction Conclusions References Tables Figures ◭ ◮ ◭ ◮ Back Close
Full Screen / Esc
Printer-friendly Version Interactive Discussion
References
Alfaro, S. C., Gaudichet, A., Gomes, L., and Maill ´e, M.: Modeling the size distribution of a soil aerosol produced by sandblasting, J. Geophys. Res., 102, 11 239–11 249, 1997.
Alfaro, S. C. and Gomes, L.: Modeling mineral aerosol production by wind erosion: Emission intensities and aerosol size distribution in source areas, J. Geophys. Res, 106, 18 075–
5
18 084, 2001.
Beijing-EPA. Annual report of Environment in Beijing. (in Chinese), 2006.
Gong, S. L., Barrie, L. A., Blanchet, J.-P., Salzen, K. v., Lohmann, U., Lesins, G., Spacek, L., Zhang, L. M., Girard, E., Lin, H., Leaitch, R., Leighton, H., Chylek, P., and Huang, P.: Canadian Aerosol Module: A size-segregated simulation of atmospheric aerosol processes
10
for climate and air quality models 1. Module development, J. Geophys. Res. 108, 4007, doi:10.1029/2001JD002002, 2003a.
Gong, S. L., Zhang, X. Y., Zhao, T. L., McKendry, I. G., Jaffe, D. A., and Lu, N. M.: Charac-terization Of Soil Dust Distributions In China And Its Transport During ACE-ASIA 2. Model Simulation and Validation, J. Geophys. Res., 108, 4262, doi:10.1029/2002JD002633, 2003b.
15
Gong, S. L., Zhang, X. Y., Zhao, T. L., Zhang, X. B., Barrie, L. A., McKendry, I. G., and Zhao, C. S.: A simulated climatology of Asian dust aerosol and its trans-Pacific transport. Part II: Interannual variability and climate connections, J. Climate, 19, 104–122, 2006.
Hong, S.-Y. and Pan, H.-l.: Nonlocal Boundary Layer Vertical Diffusion in a Medium-Range Forecast Model, Monthly Wea. Rev., 124, 2322–2339, 1996.
20
Hu, X. Q., Lu, N. M., Niu, T., and Zhang, P.: Operational Retrieval of Asian Dust Storm from FY-2C Geostationary Meteorological Satellite and its Application to real time Forecast in Asia, Atmos. Chem. Phys. Discuss., accepted, 2007.
IPCC: Climate Change 2001: The Scientific Basis, Contribution of working Group I to the Third Assessment Report of the Intergovernmental Panel on Climate Change. Cambridge
Univer-25
sity Press, 2001.
Marticorena, B. and Bergametti, G.: Modeling the atmospheric dust cycle. Part 1: Design of a soil-derived dust emission scheme, J. Geophys. Res., 100, 16 415–16 430, 1995.
Niu, T., Gong, S. L., Zhu, G. F., Liu, H. L., Hu, X. Q., Zhou, C. H., Wang, Y. Q., and Zhang, X. Y.: Data Assimilation of Dust Aerosol Observations for CUACE/Dust Forecasting System,
30
Atmos. Chem. Phys. Discuss., in press, 2007.
ACPD
7, 7987–8015, 2007
SDS numerical forecast system in
Asia and its performance C. H. Zhou et al. Title Page Abstract Introduction Conclusions References Tables Figures ◭ ◮ ◭ ◮ Back Close
Full Screen / Esc
Printer-friendly Version Interactive Discussion
V. E.: A long Saharan dust event over the western Mediterranean: Lidar, Sun pho-tometer observations, and regional dust modeling, J. Geophys. Res., 111, D15214, doi:10.1029/2005JD006579, 2006.
Shao, Y.: A model for mineral dust emission, J. Geophys. Res., 106, 20 239–20 254, 2001. Shao, Y.: Simplification of a dust emission scheme and comparison with data. J. Geophy. Res.,
5
109(D17), doi:10.1029/2003JD004372, 2004.
Smolarkiewicz, P. K.: Multidimensional positive definite advection transport algorithm: An overview. International journal for numerical methods in fliuds, 50, 1123–1144, 2006. Sugimoto, N., Matsui, I., Liu, Z., Atsushi Shimizu, Tamamushi, I., and Asai, K.: Observation of
Aerosols and Clouds Using a Two-Wavelength Polarization Lidar during the Nauru99
Exper-10
iment. Sea and Sky 76, 93-98, 2000.
Tegen, I. and Fung, I.: Modeling of mineral dust in the atmosphere: Sources, transport, and optical thickness, J. Geophys. Res., 99, 22 897–22 914, 1994.
Uno, I., Amano., H., Emori, S., Kinoshita, N., Matsu., I., and Sugimoto, N.: Trans-Pacific yellow sand transport observed in April 1998: Numerical simulation, J. Geophys. Res., 106, 18 331–
15
18 344, 2001.
Uno, I., Wang, Z., Chiba, M., Chun, Y. S., Gong, S. L., Hara, Y., Jung, E., Lee, S.-S., Liu, M., Mikami, M., Music, S., Nickovic, S., Satake, S., Shao, Y., Song, Z., Sugimoto, N., Tanaka, T., and Westphal, D. L.: Dust model intercomparison (DMIP) study over Asia: Overview, J. Geophys. Res., 111, D12213, doi:10.1029/2005JD006575, 2006.
20
Yang, Y. Q., Hou, Q., Zhou, C. H., Liu, H. L., Wang, Y. Q., and Niu, T.: A Study on Sand/dust Storms over Northeast Asia and Associated Large-Scale Circulations in Spring 2006, Atmos. Chem. Phys. Discuss., accepted, 2007.
Zhang, X. Y., An, Z. S., and Cao, J. J.: Dust emission from Chinese desert sources linked to variations in atmospheric circulation, J. Geophys. Res., 102, 28 041–28 047, 1997.
25
Zhang, X. Y., Gong, S. L., Shen, Z. X., Mei, F. M., Xi, X. X., Liu, L. C., Zhou, Z. J., Wang, D., Wang, Y. Q., and Y. Cheng. Characterization Of Soil Dust Distributions In China And Its Transport During ACE-ASIA 1. Net Work Measurements, J. Geophys. Res., 108, 4261, doi:10.1029/2002JD002632, 2003.
Zhao, T. L., Gong, S. L., Zhang, X. Y., Abdel-Mawgoud, A., and Shao, Y. P.: An assessment of
30
dust emission schemes in modeling east Asian dust storms, J. Geophys. Res., 111, D05S90, doi:10.1029/2004JD005746, 2006.
Zhao, T. L., Gong, S. L., Zhang, X. Y., and McKendry, I. G.: Modelled size-segregated wet and
ACPD
7, 7987–8015, 2007
SDS numerical forecast system in
Asia and its performance C. H. Zhou et al. Title Page Abstract Introduction Conclusions References Tables Figures ◭ ◮ ◭ ◮ Back Close
Full Screen / Esc
Printer-friendly Version Interactive Discussion
dry deposition budgets of soil dust aerosol during ACE-Asia, 2001: Implications for Trans-Pacific Transport, J. Geophys. Res., 108, 8665, doi:10.1029/2002JD003363, 2003.
Zhou, Z. J.: Blowing-sand and sandstorm in China in recent 45 years, Quaternary Res. (Chi-nese), 21, 9–17 (in Chi(Chi-nese), 2001.
ACPD
7, 7987–8015, 2007
SDS numerical forecast system in
Asia and its performance C. H. Zhou et al. Title Page Abstract Introduction Conclusions References Tables Figures ◭ ◮ ◭ ◮ Back Close
Full Screen / Esc
Printer-friendly Version Interactive Discussion
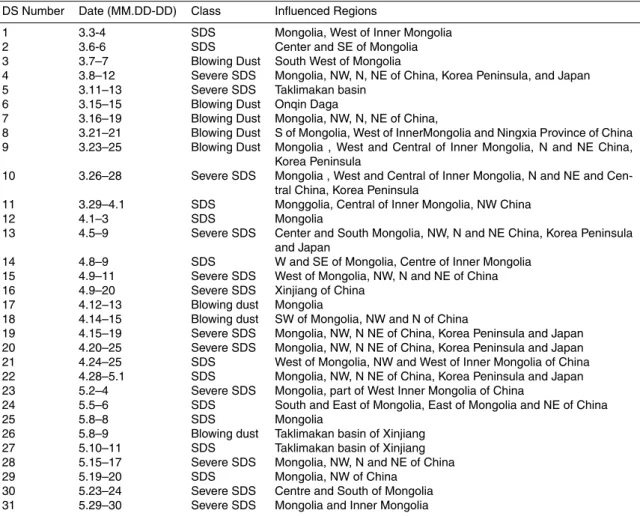
Table 1.Dust Events in 2006 from March to May.
DS Number Date (MM.DD-DD) Class Influenced Regions
1 3.3-4 SDS Mongolia, West of Inner Mongolia
2 3.6-6 SDS Center and SE of Mongolia
3 3.7–7 Blowing Dust South West of Mongolia
4 3.8–12 Severe SDS Mongolia, NW, N, NE of China, Korea Peninsula, and Japan
5 3.11–13 Severe SDS Taklimakan basin
6 3.15–15 Blowing Dust Onqin Daga
7 3.16–19 Blowing Dust Mongolia, NW, N, NE of China,
8 3.21–21 Blowing Dust S of Mongolia, West of InnerMongolia and Ningxia Province of China
9 3.23–25 Blowing Dust Mongolia , West and Central of Inner Mongolia, N and NE China,
Korea Peninsula
10 3.26–28 Severe SDS Mongolia , West and Central of Inner Mongolia, N and NE and
Cen-tral China, Korea Peninsula
11 3.29–4.1 SDS Monggolia, Central of Inner Mongolia, NW China
12 4.1–3 SDS Mongolia
13 4.5–9 Severe SDS Center and South Mongolia, NW, N and NE China, Korea Peninsula
and Japan
14 4.8–9 SDS W and SE of Mongolia, Centre of Inner Mongolia
15 4.9–11 Severe SDS West of Mongolia, NW, N and NE of China
16 4.9–20 Severe SDS Xinjiang of China
17 4.12–13 Blowing dust Mongolia
18 4.14–15 Blowing dust SW of Mongolia, NW and N of China
19 4.15–19 Severe SDS Mongolia, NW, N NE of China, Korea Peninsula and Japan
20 4.20–25 Severe SDS Mongolia, NW, N NE of China, Korea Peninsula and Japan
21 4.24–25 SDS West of Mongolia, NW and West of Inner Mongolia of China
22 4.28–5.1 SDS Mongolia, NW, N NE of China, Korea Peninsula and Japan
23 5.2–4 Severe SDS Mongolia, part of West Inner Mongolia of China
24 5.5–6 SDS South and East of Mongolia, East of Mongolia and NE of China
25 5.8–8 SDS Mongolia
26 5.8–9 Blowing dust Taklimakan basin of Xinjiang
27 5.10–11 SDS Taklimakan basin of Xinjiang
28 5.15–17 Severe SDS Mongolia, NW, N and NE of China
29 5.19–20 SDS Mongolia, NW of China
30 5.23–24 Severe SDS Centre and South of Mongolia
31 5.29–30 Severe SDS Mongolia and Inner Mongolia
ACPD
7, 7987–8015, 2007
SDS numerical forecast system in
Asia and its performance C. H. Zhou et al. Title Page Abstract Introduction Conclusions References Tables Figures ◭ ◮ ◭ ◮ Back Close
Full Screen / Esc
Printer-friendly Version Interactive Discussion
Table 2.Mean TS Scoring for CUACE/Dust in 2006 Spring Time. Forecast Length 0–24 h 24–48 h 48–72 h threat score 0.31 0.23 0.21 miss ratio 0.48 0.62 0.65 false alarm ratio 0.55 0.6 0.6 bias score 1.45 1.23 1.09 accuracy 0.88 0.87 0.87
ACPD
7, 7987–8015, 2007
SDS numerical forecast system in
Asia and its performance C. H. Zhou et al. Title Page Abstract Introduction Conclusions References Tables Figures ◭ ◮ ◭ ◮ Back Close
Full Screen / Esc
Printer-friendly Version Interactive Discussion
a
b
c
Fig. 1. Surface snap SDS concentrations and wind field at 14 h on 8 March at forecast length of (a) 54, (b) 30 and (c) 6 h from the initial forecast time of 8 h on 6, 7 and 8 March, respectively (Beijing standard time used). The scattered pink signals S, $, § and & represent observation records of suspended dust, blowing dust, SDS and severe SDS respectively from weather stations at the same time with the concentration plot.
ACPD
7, 7987–8015, 2007
SDS numerical forecast system in
Asia and its performance C. H. Zhou et al. Title Page Abstract Introduction Conclusions References Tables Figures ◭ ◮ ◭ ◮ Back Close
Full Screen / Esc
Printer-friendly Version Interactive Discussion
a
b
c
Fig. 2.Surface snap SDS concentrations and wind field at 14 h on 9 March at a forecast length of (a) 54, (b) 30 and (c) 6 h from the initial forecast time of 8 h on 6, 7 and 8 March, respectively (Beijing standard time used).
ACPD
7, 7987–8015, 2007
SDS numerical forecast system in
Asia and its performance C. H. Zhou et al. Title Page Abstract Introduction Conclusions References Tables Figures ◭ ◮ ◭ ◮ Back Close
Full Screen / Esc
Printer-friendly Version Interactive Discussion
a
b
c
Fig. 3.Surface snap SDS concentrations and wind field at 20 h on 9 March at a forecast length of (a) 60 (b) 36 and (c) 12 h from the initial forecast time of 8 h on 7, 8 and 9 March, respectively (Beijing standard time used used).
ACPD
7, 7987–8015, 2007
SDS numerical forecast system in
Asia and its performance C. H. Zhou et al. Title Page Abstract Introduction Conclusions References Tables Figures ◭ ◮ ◭ ◮ Back Close
Full Screen / Esc
Printer-friendly Version Interactive Discussion
a d
b e
c f
Fig. 4. Surface snap SDS concentrations and wind field at (a) 20 h on 9 March, (b) 14 hr on March 10, (c) 20 h on 10 March, (d) 14 h on 11 March, (e) 20 h on 11 March, and (f) 2 h on 12 March (local time used) from the initial forecast time of 8 h on 9 March (Beijing standard time used).
ACPD
7, 7987–8015, 2007
SDS numerical forecast system in
Asia and its performance C. H. Zhou et al. Title Page Abstract Introduction Conclusions References Tables Figures ◭ ◮ ◭ ◮ Back Close
Full Screen / Esc
Printer-friendly Version Interactive Discussion a b c d
Fig. 5. Time series of lidar depolarization ratio (left) and predicted vertical concentration plot from 9 March 00:00 Z to 11 March 12:00 Z (right) for (a) Shapotou, (b) Huhhot, (c) Beijing and
(d)Tskuba respectively.
ACPD
7, 7987–8015, 2007
SDS numerical forecast system in
Asia and its performance C. H. Zhou et al. Title Page Abstract Introduction Conclusions References Tables Figures ◭ ◮ ◭ ◮ Back Close
Full Screen / Esc
Printer-friendly Version Interactive Discussion a 0 1 0 0 0 2 0 0 0 3 0 0 0 4 0 0 0 5 0 0 0 6 0 0 0 7 0 0 0 8 0 0 0 9 0 0 0 1 0 0 0 0 135791 11 31 51 71 92 12 32 52 72 93 13 33 53 73 94 14 34 54 74 95 15 35 55 75 96 16 36 56 76 97 17 37 57 77 98 18 38 58 78 9 d a y ug/ m3 DS 16 DS 5 DS 26 DS 27 DS 29 b 0 500 1000 1500 2000 2500 3000 3500 4000 1357911131517192123252729313335373941434547495153555759616365676971737577798183858789 day ug/m3 DS 4 DS 6 DS 8 DS 9 DS 11 DS 13 DS 14 DS 19 DS 20 DS 22 DS 28 DS 30 DS 31 c 0 500 1000 1500 2000 2500 3000 3500 1357911131517192123252729313335373941434547495153555759616365676971737577798183858789 day ug/m3 DS 4 DS 7 DS 9 DS 10 DS 13 DS 17 DS 18 DS 19 DS 20 DS 23 DS 28 DS 29 DS 31
Fig. 6. Comparisons of the surface 24-h mean SDS concentration by 0–24 h (FT1), 24–48 h (FT2) and 48–72 h (FT3) forecasts and the surface PM10 observation for the entire spring from 3 March to 31 May for (a) Tazhong, a station in central part of Takilimakan Deserts in Xinjiang province in China, (b) for Ejilaqi, a station in the north of Badain Juran deserts, (c) for Zhurihe, a station in the west of Onqin Daga sandy areas, (d) for Beijing, a station away from SDS source area, and (e) for Dalian, a station away from SDS source areas and in the west coast of the Bohai sea, respectively. DS xx, such as DS 4, means dust event number defined in Table 1.
ACPD
7, 7987–8015, 2007
SDS numerical forecast system in
Asia and its performance C. H. Zhou et al. Title Page Abstract Introduction Conclusions References Tables Figures ◭ ◮ ◭ ◮ Back Close
Full Screen / Esc
Printer-friendly Version Interactive Discussion d 0 4 0 0 8 0 0 1 3 5 7 9 1 11 31 51 71 92 12 32 52 72 93 13 33 53 73 94 14 34 54 74 95 15 35 55 75 96 16 36 56 76 97 17 37 57 77 98 18 38 58 78 9 d a y ug/ m3 DS 4 DS 7 DS 9 DS 13 DS 15 DS 19 DS 20 DS 22 DS 28 e 0 100 200 300 400 500 600 700 1 3 5 7 911131517192123252729313335373941434547495153555759616365676971737577798183858789 day ug/m3
0-24 hr average 24-48 hr average 48-72 hr average PM10 Observation
D S 4 DS 13 DS 20 DS 22 DS 9 DS 28 Fig. 6.Continued. 8014
ACPD
7, 7987–8015, 2007
SDS numerical forecast system in
Asia and its performance C. H. Zhou et al. Title Page Abstract Introduction Conclusions References Tables Figures ◭ ◮ ◭ ◮ Back Close
Full Screen / Esc
Printer-friendly Version Interactive Discussion 0 0.1 0.2 0.3 0.4 0.5 0.6 0.7 0.8 0.9 1 1- Ma r 11 -M ar 21 -M ar 31 -M ar 10 -A pr 2 0- Ap r 3 0- Ap r 1 0- Ma y 2 0- Ma y 3 0- Ma y Time Th reat Sc ore 0-24 24-48 48-72 0 0.1 0.2 0.3 0.4 0.5 0.6 0.7 0.8 0.9 1
1-Mar 11-Mar 21-Mar 31-Mar 10-Apr 20-Apr 30-Apr 10-May 20-May 30-May Time
Forecast Efficiency
Fig. 7. Threat Scores (upper) and accuracy (lower) of 0–24 h, 24–48 h and 48–72 h forecasts for CUACE/Dust in 2006 spring.