HAL Id: hal-02388426
https://hal.archives-ouvertes.fr/hal-02388426
Submitted on 13 Dec 2019HAL is a multi-disciplinary open access
archive for the deposit and dissemination of sci-entific research documents, whether they are pub-lished or not. The documents may come from teaching and research institutions in France or abroad, or from public or private research centers.
L’archive ouverte pluridisciplinaire HAL, est destinée au dépôt et à la diffusion de documents scientifiques de niveau recherche, publiés ou non, émanant des établissements d’enseignement et de recherche français ou étrangers, des laboratoires publics ou privés.
A 3D population-based brain atlas of the mouse lemur
primate with examples of applications in aging studies
and comparative anatomy
Nachiket Nadkarni, Salma Bougacha, Clément Garin, Marc Dhenain,
Jean-Luc Picq
To cite this version:
Nachiket Nadkarni, Salma Bougacha, Clément Garin, Marc Dhenain, Jean-Luc Picq. A 3D population-based brain atlas of the mouse lemur primate with examples of applications in aging studies and com-parative anatomy. NeuroImage, Elsevier, 2019, 185, pp.85-95. �10.1016/j.neuroimage.2018.10.010�. �hal-02388426�
A 3D population-based brain atlas of the mouse lemur primate with examples
of applications in aging studies and comparative anatomy
Nachiket A. Nadkarni1,2, Salma Bougacha1,2,3,4, Clément Garin1,2, Marc Dhenain1,2,*, Jean-Luc Picq1,2,5
1
Centre National de la Recherche Scientifique (CNRS), Université Paris-Sud, Université Paris-Saclay, UMR 9199, Neurodegenerative Diseases Laboratory, 18 Route du Panorama, F-92265 Fontenay-aux-Roses, France
2
Commissariat à l’Énergie Atomique et aux Énergies Alternatives (CEA), Direction de la Recherche Fondamentale (DRF), Institut François Jacob, MIRCen, 18 Route du Panorama, F-92265 Fontenay-aux-Roses, France
3
Inserm, Inserm UMR-S U1237, Normandie Univ, UNICAEN, GIP Cyceron, Caen, France 4
Normandie University, UNICAEN, EPHE, INSERM, U1077, CHU de Caen, Neuropsychologie et Imagerie de la Mémoire Humaine, 14000 Caen, France
5
Laboratoire de Psychopathologie et de Neuropsychologie, EA 2027, Université Paris 8, 2 Rue de la Liberté, 93000 St Denis, France.
* Corresponding author: Marc.Dhenain@cea.fr
Abstract
The gray mouse lemur (Microcebus murinus) is a small prosimian of growing interest for studies of primate biology and evolution, and notably as a model organism of brain aging. As brain atlases are essential tools for brain investigation, the objective of the current work was to create the first 3D digital atlas of the mouse lemur brain. For this, a template image was constructed from in vivo magnetic resonance imaging (MRI) data of 34 animals. This template was then manually segmented into 40 cortical, 74 subcortical and 6 cerebro-spinal fluid (CSF) regions. Additionally, we generated probability maps of gray matter, white matter and CSF. The template, manual segmentation and probability maps, as well as imaging tools used to create and manipulate the template, can all be freely downloaded. The atlas was first used to automatically assess regional age-associated cerebral atrophy in a cohort of mouse lemurs previously studied by voxel based morphometry (VBM). Results based on the atlas were in good agreement with the VBM ones, showing age-associated atrophy in the same brain regions such as the insular, parietal or occipital cortices as well as the thalamus or hypothalamus. The atlas was also used as a tool for comparative neuroanatomy. To begin with, we compared measurements of brain regions in our MRI data with histology-based measures from a reference article largely used in previous comparative neuroanatomy studies. We found large discrepancies between our MRI-based data and those of the reference histology-based article. Next, regional brain volumes were compared amongst the mouse lemur and several other mammalian species where high quality volumetric MRI brain atlases were available, including rodents (mouse, rat) and primates (marmoset, macaque, and human). Unlike those based on histological atlases, measures from MRI atlases indicated similar cortical to cerebral volume indices in all primates, including in mouse lemurs, and lower values in mice. On the other hand, white matter to cerebral volume index increased from rodents to small primates (mouse lemurs and marmosets) to macaque, reaching their highest values in humans.
Keywords
Graphical abstract
Highlights
• The mouse lemur primate is an original model for neuroscience studies and comparative anatomy.
• We present an anatomical brain template, constructed from in vivo MRI scans of 34 mouse lemurs.
• We created the first high resolution 3D atlas of the mouse lemur brain by delineating 120 regions encompassing each voxel of the template.
• The template, code developed to create and manipulate the template as well as segmentation maps are freely available.
• The atlas was used to characterize age-related atrophy and to compare the mouse lemur brain with brains from other mammals.
1. Introduction
The gray mouse lemur (Microcebus murinus) is one of the smallest non-human primates (NHPs). Its small size (typical length 12cm, 60-120g weight) and rapid maturity (puberty at 6-8 months) bring rodent-like practicality to primate experimentation. As a result, the mouse lemur is used as an NHP model organism for primate and human biology (Ezran et al., 2017). It has a life span of approximately 12 years, which is short for a primate, and displays age-associated cerebral atrophy that is correlated with cognitive alterations (Picq et al., 2012) as well as various neuropathological lesions (Kraska et al., 2011). As a consequence, it is used as a model of aging and age-related diseases in the brain (Languille et al., 2012). In particular it has been used to evaluate how cerebral aging is modulated by various biological factors or diseases, such as chronic caloric restriction (Pifferi et al., 2018) or diabetes (Djelti et al., 2016).
Mouse lemurs can also be used to shed light on primate brain evolution (Montgomery et al., 2010). Surprisingly, most studies of this (Barton and Harvey, 2000; Finlay and Darlington, 1995) rely on the analysis of the same set of volumetric measurements made on a large variety of mammalian species by a single research group using perfused brains processed by histology (Stephan et al., 1981). Because of the tediousness of the evaluation of brain region volumes by histology, the experiments were not reproduced by other research groups, leaving scientists with a single lone source of data to provide reference measures.
Given the importance of the mouse lemur for biomedical research and as a key species for studying primate brain evolution, it is critical to have a 3D digital brain atlas and associated template (standard image reflecting the population’s brain anatomy) for this species. However, today, reference atlases available to study mouse lemurs are based on histological sections (Le Gros Clark, 1931; Bons et al., 1998). Such atlases suffer from distortions caused by histological processing and do not cover the whole brain. Also, they are very unsuited to use with non-invasive imaging data from live individuals. A first MRI-based description of the mouse lemur brain was developed in the 1990s, but it is mainly a partial annotation of MR images of one post mortem brain sample (Ghosh et al., 1994). More recently, a population image based on 30 mouse lemur brains including probabilistic gray matter (GM), white matter (WM) and cerebro-spinal fluid (CSF) maps was developed, but it did not include annotated labels (Sawiak et al., 2014). Here we present the first 3D digital brain atlas and associated template of the mouse lemur. We used MR acquisitions from 34 young to middle-aged adult mouse lemurs to create the template: scans were iteratively mutually registered and meaned through linear then increasingly refined non-linear stages, a standard process that does not favor any one individual, but rather produces an unbiased average of the population used to create it (Guimond et al., 1998; Guimond et al., 2000). The template was then segmented manually into 120
structures based on a previous histological atlas (Bons et al., 1998) and other previous characterizations of mouse lemur brain anatomy (Le Gros Clark, 1931; Zilles et al., 1979). The template was also used to create probability maps of mouse lemur GM, WM and CSF. The template, atlas and probability maps are available for download in NIfTI-1 format at . The code developed to create and manipulate the
https://www.nitrc.org/projects/mouselemuratlas
template has been refined into general procedures for registering small mammal brain MR images, available within a python module sammba-mri (SmAll-maMMals BrAin MRI;
https://sammba-).
mri.github.io
Two applications of the atlas are presented in this article. The first is an evaluation of age-related regional cerebral atrophy in a mouse lemur cohort that was previously studied by voxel based morphometry (VBM) (Sawiak et al., 2014). We show that atlas-based registration detects age-related atrophy in regions very similar to those identified by VBM. The second application is a comparative anatomy study. Initially, we highlight that reference published histological reports of brain region volumes are very different to those found with our atlas. More interestingly, using morphometric analysis and comparison of measures of the ratios between various brain regions, we show that, despite its rodent-like size, the mouse lemur’s cortex/cerebrum index does not differ from those of other primates, and that major differences amongst primates concern more the WM/cerebrum indices.
2. Materials and Methods
2.1. Animals
This study was carried out in accordance with the recommendations of the European Communities Council directive (2010/63/EU). The protocol was approved by the local ethics committees CEtEA-CEA DSV IdF (authorizations 201506051 736524 VI (APAFIS#778)). 34 mouse lemurs (22 males and 12 females) were used for template creation. Age range was 15-58 months, mean ± standard deviation 36.8 ± 9.2 months, so all were young to middle-aged adults at scan time (Languille et al., 2012). All mouse lemurs were born in a laboratory breeding colony (Brunoy, France, authorization n°E91-114-1), and maintained at steady ambient temperature (24–26°C) and relative humidity (55%). Full demographic information is provided in Table 1 in (Nadkarni et al, 2018).
2.2. MR acquisition
One T2-weighted in vivo MRI scan was recorded for each animal. After an overnight fast, animals were immobilized for MRI by isoflurane anesthesia (4% induction, 1-1.5% maintenance). Breathing rate was monitored to ensure animal stability until the end of the experiment. Body temperature was maintained by an air-heating system. Images were acquired using a 7 Tesla (T) Agilent system
using a four channel phased-array surface coil (Rapid Biomedical, Rimpar, Germany) actively decoupled from the transmitting birdcage probe (Rapid Biomedical, Rimpar, Germany). The sequence was a 2D T2-weighted fast spin echo with a resolution of 230x230x230 µm: TR/TE = 10000/17.4 msec, RARE factor = 4, field of view (FOV) = 29.44 × 29.44 mm with a matrix (Mtx) = 128 × 128, 128 slices, number of averages (NA) = 6, acquisition duration 32 mins.
2.3. Template creation and validation
Raw k-space slice data from the 34 mouse lemurs were zero-filled to 256 × 256 and reconstructed to 3D NIfTI-1 format using custom python code. Images were then up-sampled in the through-slice direction as well to 256 slices, thus giving a final matrix of 2563, 115 µm isotropic resolution.
The template generation pipeline is diagrammed in Fig. 1, and has been developed into the function anats_to_common available within the sammba-mri python module (https://sammba-mri.github.io/generated/sammba.registration.anats_to_common.html#sammba.registration.anats_t o_common). All steps used tools from freely available AFNI software (https://afni.nimh.nih.gov/ (Cox, 1996)), except for brain extraction, which was done with RATS (Oguz et al., 2014; Yin et al., 2010). Head images were bias corrected (Fig. 1b), brain extracted (Fig. 1c), and individual brain extracted image centers were shifted to the brain center of mass (Fig. 1d). Brains were then all rigid body aligned to a digitized version of a previous histological atlas (Bons et al., 1998) (Fig. 1e) and the transform was then applied to the original heads. The aligned heads were meaned to produce a first brain template (Fig. 1f). The previous rigid body registration step was performed a second time to align the 34 centered brains to the first template leading to a template 2 (Fig. 1g). Then, the 34 centered brains were affine aligned to template 2 leading to a template 3 (Fig. 1h). Finally, four cycles of non-linear registration were executed, the first to affine template 3, the rest to templates of heads from the previous non-linear cycle, including initialization using the concatenated transforms of the previous cycles, and an adjustment after each cycle to correct for systematic biases in the non-linear transforms (Fig. 1i) leading to the final template. Note that non-linear registration used the AFNI tool 3dQwarp, which repeatedly composes incremental warps defined by Hermite cubic basis functions, first over the entire volume, then over steadily shrinking and overlapping patches, with the resulting final warp being a grid representation of a diffeomorphism between source and target images. In the non-linear cycles above, final patch size was relatively large in the first cycle and was reduced substantially with each subsequent cycle. The intermediate and final templates were all means in intensity space of transformed images.
The contrast to noise ratio (CNR) was measured in the template and in raw images by evaluating the difference between the mean intensity of GM (in the caudate nucleus, 1920 voxels, 1.45 mm3) minus
mean intensity of WM (splenium of the corpus callosum, 500 voxels, 0.38 mm3) divided by the standard deviation of the intensities in the tympanic bulla (1280 voxels, 0.96mm3).
Figure 1. Template generation pipeline. T2-weighted MRI scans of the brain were collected from 34 mouse lemurs. (a) Head images were bias corrected (AFNI-3dUnifize), (b) brain extracted (RATS), and (c) each individual head (and brain extracted images) center was shifted to the brain center of mass (AFNI-3dCM). (d) Brains were then all rigid body aligned to a digitized version of a previous histological template (Bons et al., 1998) (AFNI-3dAllineate) and the 6 degrees of freedom (DOF) transforms were then applied to the centered heads. (e) The aligned heads were averaged to produce a first template and similarly for the aligned brains. (f) The rigid body registration was performed a second time to align the 34 centered heads to the first created template leading to a template 2. (g) Then, the 34 centered brains were affine aligned to brain template 2 and the 12 DOF
transforms were applied to the centered heads leading to template 3. (h) Finally, four cycles of non-linear registration were carried out, the first to affine template 3, then subsequently to match templates of heads from the previous cycle (AFNI-3dQwarp), including initialization by the concatenation of previous transforms, and an adjustment after each cycle to correct for systematic biases in the non-linear transforms (AFNI-3dNwarpAdjust). These steps used a weight, created by using a mask of brain template 3 dilated by 5 voxels (AFNI-3dmask_tool).
Finally, adopting procedures of template validation from previous studies, landmark distance measures were used to validate the mouse lemur template (Black et al., 2001a; Black et al., 2001b; Ella and Keller, 2015; Hikishima et al., 2011; McLaren et al., 2009; Quallo et al., 2010). Landmarks were identified at the level of the middle of the anterior (AC) and posterior (PC) commissures in the template, raw images and images normalized to the mouse lemur template (Anatomist freeware; http://brainvisa.info/index_f.html). The 3D Euclidean distances (AC-PC) between each of these landmarks and the equivalent landmarks in the mouse lemur template were calculated.
2.4. Segmentation of the MRI-based atlas
The template image was up-sampled to 91 µm isotropic resolution, then segmented manually by a single person (JLP) using ITK-SNAP software (http://www.itksnap.org; (Yushkevich et al., 2006)). Brain structures, except cortical areas, were defined according to the histological atlas of Bons (Bons et al., 1998) on the basis of the contrast in the anatomical images. Each structure was segmented slice by slice along either the coronal, axial or sagittal orientations depending on which orientation offered the best contrast for the structure. The boundaries of each structure were then checked, corrected using all three orientations and continuously updated until, after several iterations in each direction, the three-dimensional representation of the labelled structure was found to be smooth and non-jagged. Due to insufficient contrast within the cortex of the template image, the boundaries of cortical areas were approximated from the histological atlas of Le Gros Clark (Le Gros Clark, 1931), and even then only on coronal slices of the template because this histological atlas only contains some coronal sections and a rough lateral view of the mouse lemur cortex parcellation. After the delineation of the cortical areas on the coronal orientation was completed, the boundaries were carefully adjusted using the axial and sagittal orientations until achieving internal coherence among the three views. The study of the cytoarchitectonic structure of the mouse lemur cortex by Zilles et al. (Zilles et al., 1979) was used to make three small changes to the Le Gros Clark-based cortical parcellation: 1) the more rostral parts of the temporal pole were occupied by the prepyriform and periamygdalar areas instead of area 28 (entorhinal cortex), 2) areas 26 and 29 were merged to form the retrosplenial area, 3) area 22 was identified as the whole auditory cortex corresponding to areas 41, 42 and 22 of Brodmann (Brodmann, 1999 (original in 1909)). In total, 120 regions were drawn. They included 40 cortical, 74 subcortical and 6 CSF regions. Each structure was outlined bilaterally.
The names of the structures were based on the NeuroName ontology (http://www.braininfo.org; (Bowden et al., 2012)). Labels of all brain regions are provided in Table 2 in (Nadkarni et al, 2018).
2.5. Tissue probability maps
Tissue probability maps were created using SPM8 (Wellcome Trust Institute of Neurology, University College London, UK, www.fil.ion.ucl.ac.uk/spm) with the SPMMouse toolbox (http://spmmouse.org) for animal brain morphometry as previously described (Sawiak et al., 2014; Sawiak et al., 2013). Briefly, MR images from the 34 animals involved in the study were registered to a previously published SPM template of the mouse lemur brain (Sawiak et al., 2014). Affine registration adjusted the images to control for different head positions and scanner geometry as well as overall brain size. Then unified segmentation iteratively warped the data whilst correcting for signal inhomogeneity due to the receiver coil. The images of the rigidly-aligned brains of each animal were then segmented using a k-means algorithm (MacKay, 2003) with 4 segments: background, GM, WM, and CSF. These maps were then averaged across individuals separately for each tissue type to produce mean GM, WM and CSF tissue probability maps. These maps were manually edited, particularly around the edges of the brain where partial volume effects lead to mislabeling of CSF as GM or WM voxels. The templates were also masked using masks derived from the segmented atlas, to conserve only brain and CSF structures.
2.6. Evaluations and applications
2.6.1. Quality of registration to other images
Using sammba-mri (anats_to_template,
https://sammba-mri.github.io/generated/sammba.registration.anats_to_template.html#sammba.registration.anats_ to_template), our MRI atlas was non-linearly registered to different MR images, including in vivo MRI recorded at different field strengths (4.7 and 11.7 T), and ex vivo high-resolution gadolinium-stained MRI. These images were collected from mouse lemurs unrelated to the atlas. Images at 4.7 T were recorded according to previously published protocols on a Bruker Biospec 47/30 system by using a surface coil (diameter = 30 mm) actively decoupled from the transmitting birdcage probe (Bruker GmbH) and a three-dimensional inversion-recovery fast spin-echo sequence of 234x234x234 µm nominal resolution (TR/TE = 2500/6 msec, TEw = 45 msec, TI = 200 msec, RARE factor = 16, Mtx = 128 x 128 x 128, NA = 1). MR images were zero-filled to reach an apparent resolution of 117x117x117 µm. Images at 11.7 T were recorded on a Bruker Biospec 117/16 system (Bruker, Ettlingen, Germany) using a two-dimensional multi-slice multi-echo sequence of 200x200x200 µm nominal resolution (TR/TE = 5000/5 msec, TEw = 17.5 msec, 6 echos, Mtx = 160 x 160, 75 slices, NA = 1). For each field, we present images from young non-atrophied animals (1.9 and 2.4 years at 4.7 and 11.7 T, respectively) and old atrophied animals (10.9 and 10.4 years at 4.7 and 11.7 T,
respectively). Ex vivo gadolinium-stained MRI were recorded on a 7 T clinical magnet (Siemens, Syngo MR VB15) using a 2D gradient echo T2*-weighted sequence with a spatial resolution of 31 x 31 x 120 µm (TR/TE = 200/20.8 msec, flip angle = 80°, Mtx = 768 x 648, 144 slices, NA = 1). Animal brains came from an in-house mouse lemur brain collection. The brains were extracted and formalin-fixed for at least 6 months after the death of the animals. They were then stained by a one-week soaking in a solution of Gadolinium (Dotarem, Guerbet, France) in PBS at 2.5 mmol/l. This protocol enhances the signal- and contrast-to-noise ratios on MR images of fixed brains (Bertrand et al., 2013).
2.6.2. Evaluation of cerebral atrophy
The MRI brain atlas was then used to measure the volumes of individuals’ brain structures and evaluate age-related cerebral atrophy in a cohort of 30 mouse lemurs that had previously been evaluated by voxel-based morphometry (Sawiak et al., 2014). Animals from this cohort had ages ranging from 1.9 to 11.3 years old (7 "young" animals (2.2 ± 0.2 years), 11 "middle-aged" (4.8 ± 1.0 years) and 12 "old" (8.3 ± 1.7 years) animals). Compared to those used for atlas creation, images for these animals were recorded by MRI at a different field strength (4.7 T) with a 3D inversion-recovery fast spin-echo sequence using the same parameters as described in the previous section though without zero-filling (Dhenain et al., 2003; Kraska et al., 2011).
A study template representative of the 30 animals was created by registering individuals’ images using the same procedure described earlier for template creation. The study template was then non-linearly registered to the earlier-created mouse lemur template. The mouse lemur atlas was then transformed to each individual’s original image by applying the concatenated inverted study-template-to-mouse-lemur-template and animal-to-study template transforms. CSF accumulations and infiltrations were identified by simple thresholding and used to correct the animal-specific atlases, which were then used to measure the volumes of different brain structures. These volumes were analyzed by linear regression in R (function lm, https://www.R-project.org) using the following model:
Vij = β0 + β1j agei + β2j IVi +
ε
ijwhere the dependent variable Vij is the estimated volume (in mm3) of region j for animal i, the independent variables being agei the age (in years) and IVi the intracranial volume (total volume of the individually-transformed mouse lemur atlas, which marks brain plus surrounding CSF, so total intracranial volume, in mm3) of animal i, and
ε
ij is the error term.2.6.3. Comparative anatomy
Cerebral anatomy in the mouse lemur was compared to that of other mammals using available downloadable 3D digital MRI-based brain atlases of the mouse (Dorr et al., 2008), rat (Papp et al.,
2014), marmoset (Woodward et al., 2018), macaque (Reveley et al., 2017), and compared to human data from MRI-based morphometric analysis (Filipek et al., 1994). The volumes of the hippocampal formation, striatum (caudate nucleus + putamen), cortex and cerebral WM (see list of structures in Table 1) were measured and expressed as a proportion of total cerebrum (cortical GM + central GM + cerebral WM, see Suppl. Table 2).
3. Results
3.1. Mouse lemur template and probability maps
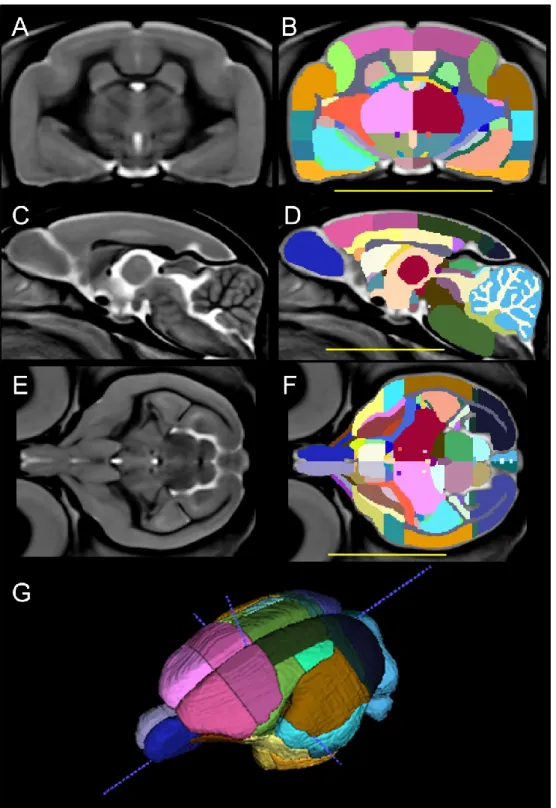
An MRI template of mouse lemur brains was generated from 34 animals aged 15-60 months old scanned at 7 T using a T2-weighted sequence with a final isotropic resolution of 115 µm (Fig. 2A, C, E, Fig 3A). The orientation of the template roughly corresponded to that of the reference Bons atlas (Bons et al., 1998). The image grid mid-plane coincided with the anatomical midsagittal plane, and the image grid horizontal plane passed through the centers of the AC and PC, corresponding to a standard anatomical coordinate system similar to Talairach space (Talairach and Tournoux, 1988). This template was used to create tissue probability maps for GM, WM and CSF (See Fig. 2 in Nadkarni et al, 2018). The template and tissue probability maps are available from https://www.nitrc.org/projects/mouselemuratlas. Contrast to noise in the template reached 58 between GM and WM. The quality of the template was improved as compared to individual images that had a GM/WM CNR of 13.2±2.6 (See Fig. 2 in Nadkarni et al, 2018). The Euclidian AC-PC distance was 4740 µm in the template and in each of the individual images registered to the template. It was 4678±163 µm in the original images, which represents a 1.3% difference between raw and template images.
Figure 2. Labeling of the mouse lemur atlas. Brain structure delineations are shown in coronal, sagittal and axial views (B, D, F) together with corresponding template images (A, C, E). Panel G displays a three-dimensional representation of the atlas from a superior lateral view. Scale bars equal 1 cm. For clarity, the label marking surrounding CSF is not displayed.
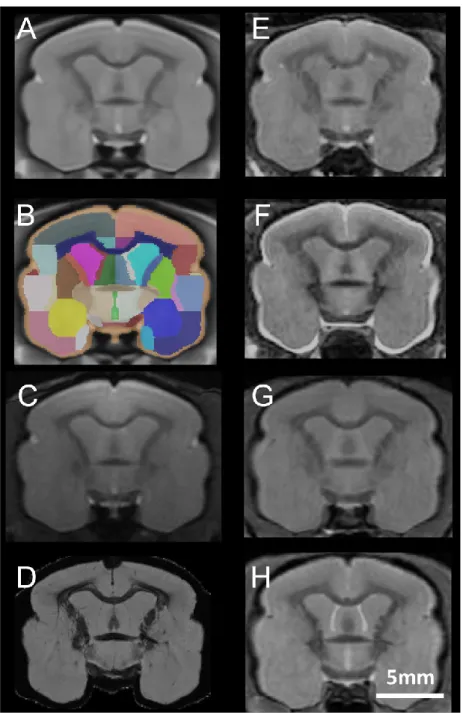
The usability of an atlas for imaging studies relies on the accuracy of registration to its template. Here, we tested the performance of our MRI-based atlas on non-linear registration with imaging data obtained from in vivo T2-weighted MRI at different field strengths (4.7 T (Fig. 3E, F) and 11.7 T
(Fig. 3G, H)), as well as with ex vivo MRI recorded at 7 T (Fig 3D). Visual inspection of the registered images suggested good accuracy of registration to the template (Fig. 3A).
Figure 3. Registration of various in vivo and ex vivo MR images to the mouse lemur template. A-B. Coronal section of the mouse lemur MRI template (level of the anterior commissure, A) and associated section in the atlas (B). C displays an MR image from one of the 34 animals used to create this template. D displays 7 T gradient echo T2*-weighted, gadolinium stained images from an ex vivo brain registered on the template. E-F highlight 4.7 T fast-spin echo T2-weighted MR images from 1.9 year-old (E) and 10.9 year-old (F) animals, registered on the template. G-H display 11.7 T-T2-weighted multi-slice multi-echo MR images from 2.3 year-old (G) and 10.4 year-old (H) animals, registered on the template. Scale bar: 5 mm.
3.2. Mouse lemur atlas
The template was manually labelled (https://www.nitrc.org/projects/mouselemuratlas). A two-dimensional representation of the atlas in three orientations is shown in Fig. 2B, D, F and 3B; a three-dimensional representation from the superior lateral view is shown in Fig. 2G. 74 subcortical structures could be identified (See Table 2 in Nadkarni et al, 2018). 40 cortical structures were outlined by interpreting borders defined in the Le Gros Clark atlas (Le Gros Clark, 1931) with some adjustments on the basis of updates in more recent atlases (Zilles et al., 1979). The volumes of each structure and their variation across the 34 animals used for template creation, including measures of cerebral asymmetry and sex difference, are shown in Table 1.
Region Structure All animals
(n=34) Male (n=22) Females (n=12)
Left Right Left Right Left Right
Cortical gray cerebral cortex 1-3 18.9±1.8 18.8±1.9 19.2±1.8 19.0±1.9 18.4±1.5 18.4±2.1 cerebral cortex 4 26±2.7 27.0±3 26.1±2.8 27.0±3.4 25.7±2.5 26.9±2.1 cerebral cortex 5 23.8±3.6 24.9±2.9 24.5±3.5 25.3±2.9 22.3±3.7 23.9±2.8 cerebral cortex 6 34.5±3 35.9±3 34.7±3.2 34.2±2.6 36.0±3.1 35.5±2.8 cerebral cortex 7 5.8±1.1 5.7±1 6.1±1.1 5.9±1.1 5.2±1.1 5.3±0.8 cerebral cortex 8 7.9±0.9 7.8±0.9 8.0±0.9 7.8±0.9 7.8±1 7.7±1 cerebral cortex 13-16 10.9±1.2 9.9±1.1 11.0±1.2 10.1±1.2 10.9±1.1 9.7±0.8 cerebral cortex 17 46.2±5 47.1±5.1 46.6±5.3 47.7±5 45.5±4.6 46.0±5.5 cerebral cortex 18 17.9±2.8 18.6±3.2 18.2±2.9 18.6±3.3 17.3±2.3 18.6±3.2 cerebral cortex 20 2.6±0.6 2.6±0.5 2.5±0.4 2.5±0.4 2.9±0.9 2.9±0.5 cerebral cortex 21 28.8±3.4 28.1±2.9 28.5±2.8 27.9±2.6 29.5±4.5 28.5±3.5 cerebral cortex 22 (40-42) 32.8±3.7 34.5±3.6 33.1±3.5 34.5±3.9 32.2±4.3 34.5±3.2 cerebral cortex 23 7.8±1.1 7.7±0.9 7.7±0.7 7.6±0.9 8.0±1.7 7.8±1.1 cerebral cortex 24 6.9±0.9 6.4±0.9 6.9±1 6.4±0.9 6.8±0.7 6.5±0.7 cerebral cortex 25 0.8±0.3 0.8±0.2 0.8±0.3 0.8±0.2 0.7±0.2 0.8±0.2 cerebral cortex 26-29 8.7±1.2 8.9±1.2 8.8±1.3 9.1±1.3 8.4±0.8 8.6±0.9 cerebral cortex 27 2.1±0.5 2.0±0.4 2.1±0.4 2.0±0.4 2.2±0.6 1.9±0.4 cerebral cortex 28 19.1±2.1 18.5±1.8 19.4±2 18.8±1.7 18.4±2.1 17.8±2 cerebral cortex 30 2.5±0.5 2.4±0.4 2.5±0.5 2.4±0.4 2.5±0.6 2.3±0.5 cerebral cortex prepyriform and periamygdalar 6.3±0.7 5.7±0.6 6.3±0.5 5.8±0.6 6.2±0.9 5.5±0.9 Central gray Amygdala 12.6±1.1 13.5±1.2 12.7±1.1 13.6±1.2 12.5±1.1 13.2±1.1 basal forebrain 3.6±0.6 3.7±0.6 3.6±0.5 3.7±0.6 3.5±0.6 3.6±0.6
basal forebrain nucleus 0.3±0.1 0.3±0.1 0.3±0.1 0.3±0.1 0.2±0.1 0.3±0.2
caudate nucleus 18.1±1.8 18.3±1.8 18.4±1.5 18.6±1.5 17.5±2.1 17.6±2.3
claustrum 5.0±0.5 4.4±0.6 5.0±0.5 4.5±0.6 4.8±0.5 4.2±0.5
globus pallidus 8.9±1.1 8.4±2.2 9.3±0.9 8.8±0.9 8.2±1.2 7.5±1.1
habenula 0.5±0.2 0.5±0.1 0.5±0.2 0.5±0.1 0.5±0.2 0.5±0.1
hypothalamus 12.4±0.7 12.7±0.9 12.4±0.6 12.7±0.8 12.2±0.9 12.6±1.2 mammillary body 0.4±0.1 0.4±0.1 0.4±0.1 0.4±0.05 0.4±0.1 0.4±0.03 nucleus accumbens 4.0±0.7 3.9±0.6 3.9±07 3.8±0.6 4.1±0.6 4.0±0.7 putamen 18.0±2.7 18.3±2.3 18.1±2.6 18.5±2.2 17.7±3.0 18.0±2.6 thalamus 45.4±3.5 44.1±3.3 46.0±3. 44.6±3.4 44.1±3.1 43.0±3.1 septum 6.3±0.6 6.2±0.6 6.3±0.6 6.2±0.6 6.3±0.6 6.2±0.6 subthalamic nucleus 0.1±0.03 0.1±0.03 0.1±0.3 0.1±0.4 0.1±0.3 0.1±0.4 Cerebral white Anterior commissure 4.0±1.1 4.3±0.9 3.4±1.3 corpus callosum 139.4±25 148.5±17.3 120.4±28.5 fasciculus retroflexus 0.6±0.2 0.5±0.1 0.6±0.1 0.6±0.1 0.5±0.2 0.5±0.1 fornix 4.6±0.5 4.8±0.5 4.7±0.5 4.9±0.5 4.5±0.5 4.7±0.6 internal capsule 12.7±2.5 12.6±2.4 13.6±1.5 13.2±1.6 11.0±3.2 11.2±3.1 mamillo-thalamic tract 0.4±0.2 0.4±0.1 0.4±0.1 0.5±0.1 0.3±0.2 0.4±0.1 optic chiasm 2.1±0.3 2.1±0.3 2.2±0.3 optic tract 4.2±0.6 4.3±0.5 4.3±0.5 4.4±0.6 3.9±0.5 4.1±0.6
stria medullaris of the
thalamus 0.9±0.1 1.1±0.2 1.0±0.1 1.1±0.2 0.9±0.2 1.0±0.1 stria terminalis 1.8±0.2 1.7±0.2 1.8±0.2 1.8±0.2 1.7±0.2 1.7±0.2 Olfactory olfactory bulb 28.2±2.5 28.3±2.8 28.6±2.3 29±2.7 27.3±2.7 26.9±2.6 olfactory tract 2.6±0.4 2.7±0.3 2.7±0.4 2.7±0.3 2.5±0.4 2.6±0.3 olfactory tubercle 2.9±0.4 3.1±0.4 2.9±0.4 3.0±0.4 2.8±0.4 3.1±0.3
Cerebellum arbor vitae of cerebellum 33.8±5.1 34.1±5.4 34.8±4.5 35.1±4.5 31.6±5.8 32.0±6.7 cerebellum 68.1±6.3 70.3±6.5 68.1±7.1 70.4±7.2 68.0±4.7 70.2±5.1 CSF and ventricles CSF (peri-brain) 327.6±16.4 330.8±13.9 320.8±19.7 lateral ventricle 12±1.3 11.8±1.1 12.1±1.4 11.6±1.1 11.8±1.1 12.0±1.0 third ventricle 9.4±1.7 9.5±1.6 9.2±2.0 cerebral aqueduct 2.3±0.4 2.3±0.4 2.3±0.5 fourth ventricle 2.9±0.6 2.9±0.6 3.0±0.7 Brain stem
central gray of the
midbrain 8.4±1.0 8.6±1.1 8.0±0.8 cerebral peduncle 3.0±0.6 3.2±0.6 3.1±0.4 3.3±0.7 2.6±0.5 3.0±0.7 substantia nigra 1.5±0.3 1.7±0.2 1.5±0.2 1.7±0.2 1.3±0.3 1.6±0.2 superior colliculus 8.3±1.1 8.8±1 8.4±1.0 9.0±1.0 7.9±1.4 8.4±0.9 inferior colliculus 11.6±1.2 11.4±1.1 11.8±1.1 11.5±1.0 11.3±1.4 11.1±1.3 posterior commissure 0.4±0.1 0.4±0.1 0.3±0.1
commissure of the inferior
colliculus 0.5±0.1 0.5±0.1 0.4±0.1
medulla 26.7±2.8 27.7±1.7 24.7±3.5
midbrain 24.0±2.3 24.6±2.3 24.1±2.3 24.9±2.3 23.9±2.2 23.8±2.2
pons 47.5±4 49.5±3.9 48.0±3.8 49.9±3.9 46.5±4.5 48.7±4.2
Table 1. List of brain structures and volumes (mm3, mean ± standard deviation) determined by transformation of atlas labels back to individual mouse lemurs. Animals’ age range was 15-58 months. Sex, age and identifier of individual animals is given in Suppl. Table 1.
3.3. Application to evaluating regional atrophy from atlas-based defined regions
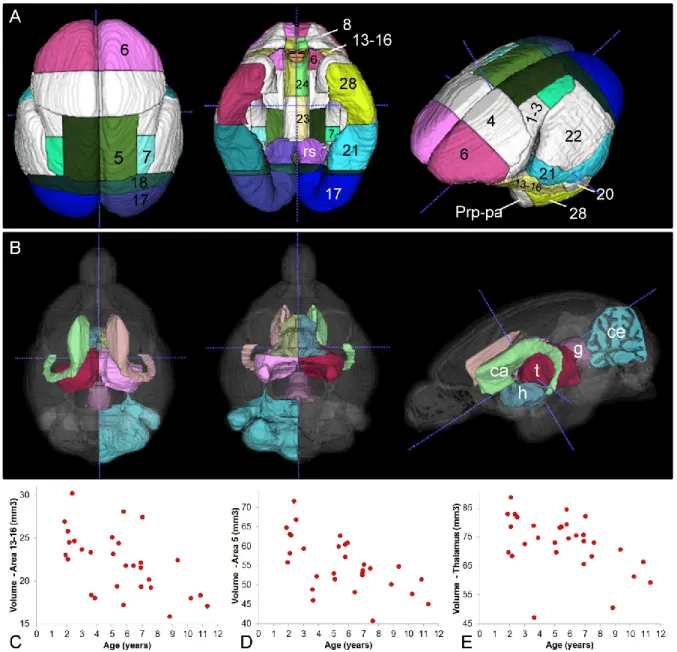
We assessed atrophied brain regions in a cohort of 30 mouse lemurs aged from 1.9 to 11.3 years old that had previously been evaluated with other methods such as voxel-based analysis (Sawiak et al., 2014). Regions presenting with a significant atrophy are presented in Fig. 4 and Table 2. Nearly all of the changes were symmetric with both sides of the brain affected. Most cortical regions displayed some atrophy with age, with the most prominent including the insular (areas 13-16, Fig. 4C), frontal (area 6), parietal (areas 5 (Fig. 4D) and 7), occipital (areas 17, 18), inferior temporal (areas 21, 28) and cingulate cortices (areas 23, 24, 25) (Table 2). With the exception of the visual cortex, the primary motor and sensory cortices were spared. Subcortical regions such as the thalamus (Fig. 4E), hypothalamus, caudate nucleus, and central gray of the midbrain were also particularly affected by aging. Interestingly, with some minor exceptions, the regions that were reported atrophied here are the same as those declared atrophied in a previous article focusing on this cohort (Table 2, (Sawiak et al., 2014)). These data confirm that in mouse lemurs 1) the cortex as a whole is more vulnerable to age-related atrophy than subcortical regions, 2) the magnitude of age-related cortical shrinkage varies greatly among cortical regions, 3) atrophy of association cortices is prominent whereas motor and primary sensory (except the visual area) cortices are relatively spared, 4) multimodal association cortices such as areas 13-16 and the cingulate cortex -which are viewed as equivalent of prefrontal regions subserving executive functions (Le Gros Clark, 1931)- are also especially vulnerable to aging.
Figure 4. Age-related evolution of cerebral atrophy in various brain regions. (A). Dorsal (left), ventral (middle) and lateral (right) views of the cortex showing regions presenting with a significant age-related atrophy (colored labels) and spared cortical areas (white). (B) Dorsal (left), ventral (middle) and lateral (right) views of atrophied subcortical brain structures. (C-E) Age-related evolution of the volume of area 13-16 (insular cortex, C), area 5 (D) and thalamus (E). Statistical modeling was performed as described in Section 2.6.2, with numerical results given in Table 2. Annotations: ca = caudate nucleus, ce = cerebellum, g = central gray of the midbrain, h = hypothalamus, Prp-pa = prepyriform and periamygdalar area, t = thalamus.
name of slope p-value Structures detected as atrophied by VBM analysis in (Sawiak et al., 2014)
structure Insular cortex (13-16) -1.01 0.000039 + Frontal cortex Area 6 -1.36 0.0019 + Parietal cortex Area 5 -2.22 0.00000027 + Area 7 -0.70 0.000000016 + Occipital cortex Area 17 -3.55 0.00000370 + Area 18 -0.69 0.011 + Retrosplenial cortex -0.63 0.000013 + Cingulate cortex Area 23 left -0.24 0.0086 + Area 24 -0.27 0.00058 + Area 25 -0.10 0.00014 + Temporal cortex Area 21 -1.20 0.0030 + Area 28 -0.75 0.015 - Area 20 NA NS + Area 22 NA NS + Total cortex -14.46 0.00000030 NA Thalamus -2.50 0.000072 + Hypothalamus -0.90 0.00000001 + Caudate -0.75 0.0016 +
Central gray of the midbrain -0.48 0.00000052 +
Putamen -0.30 0.057 +
Septum right -0.20 0.020 +
Cerebellum right -1.53 0.035 -
Table 2. Brain structures presenting with age-related atrophy. Analysis was carried out as detailed
in Section 2.6.2. Slope is the co-efficient estimated for the parameter age (β1j effectively in mm3 per
year) and p-value is its associated p-value (p-value for the hypothesis test Ho: β1j = 0 versus H1: β1j ≠0,
reflecting the significance of the regression coefficient associated to the age). NS: p > 0.05. 30 animals were used for this study Animals’ age range was 1.9 to 11.3 years old.
3.4. Application to comparative neuroanatomy
Most studies on brain evolution rely on the analysis of the same set of volumetric measurements made on a large variety of mammalian species by a single research group using histology-based measures (Stephan et al., 1981). Our 3D MRI-based brain atlas offered the opportunity to compare the volumes of brain regions assessed in this histology-based reference article to in vivo MRI-based data. This revealed large discrepancies between the two methods (Suppl. Table 1). For example, the size of the hippocampus is overestimated by about 38% with histology-based measures whereas the
size of the pallidum is under-estimated by about 38%. For the whole cortex, it is difficult to compare cortical prominence between the two methods since the histology-based dataset has the limitation of including the underlying WM and corpus callosum within the volume of the neocortex.
In addition to measures of volumes within a single species, digital atlases offer new opportunities to compare cerebral volumes across different species (Suppl. Table 2). As a proof of principle, we found that, in our population of adult mouse lemurs, the cortex contributes 54% of cerebral volume (Fig. 5). This value is close to that given by Filipek and al. for the human brain (Filipek et al., 1994). By using freely downloadable 3D MRI-based brain atlases of the mouse (Dorr et al., 2008), rat (Papp et al., 2014), marmoset (Woodward et al., 2018), and macaque (Reveley et al., 2017), it can be determined that the cortex is around 56±3% of cerebral volume in the four primate species as in the rat but only 51% in the mouse (Fig. 5, Suppl. Table 2).
Figure 5. Volume fractions of
hippocampus, cortex, WM and
striatum plotted against total
cerebrum volume in mouse, rat, mouse
lemur, marmoset, macaque and
human.
Fig. 5 also shows that overall, the mouse lemur brain is very close to that of the marmoset in terms of relative volumes of brain components and that primate brains differ from those of rodents in the relatively smaller volumes of the hippocampus and striatum, and relatively larger volumes of WM. These trends are especially marked in the human brain, in particular the large volume of WM. In addition to measures of brain volumes, another advantage of 3D digital brain atlases is that they allow an easy visualization of the 3D shape of each brain structure. As an illustration, Fig. 6A shows that the shape of the striatum is very different between rodents and primates. Also, within the primate group, it is very similar between the mouse lemur and the marmoset. In particular it can be noted that the putamen is flat and bent in these two primate species whereas it is rounded and
domed in the macaque as well as in human. Likewise, it can be seen in Fig. 6B that the hippocampus is much thinner with a dorsal part that is much less developed in the macaque than in the mouse lemur, the shape being intermediate in the marmoset.
Figure 6. 3D shape comparison of the striatum and hippocampal formation in rodent and primate species. A: 3D visualizations of the striatum in mouse, rat, mouse lemur, marmoset and macaque as seen from a left anterior-superior view (green: caudate in primates, striatum in rodents, brown: putamen). B: 3D visualizations of the C-shaped hippocampal formation in mouse, rat, mouse lemur, marmoset and macaque as seen from a right anterior-superior view.
4. Discussion
Mouse lemurs are generating more and more interest as models of neurodegenerative disease and references for comparative anatomy. The use of these animals in biological research depends on the development of tools for high throughput and automatic analysis as well as for standardization. We presented here one such tool: the first 3D digital brain atlas of the mouse lemur primate, consisting of an MRI template and labels for the whole brain. We also presented two potential applications of this atlas to assess age-related cerebral atrophy and for comparative neuroanatomy.
Compared to previous traditional 2D histology-based atlases of the mouse lemur brain, our MRI-based atlas has three main advantages: 1) a high resolution MRI template is provided for accurate registration to different imaging modalities and we showed that it can be used to register images recorded in various conditions (MRI recorded on 3 different scanners, from 4.7 to 11.7 T, in vivo and
ex vivo), 2) brain regions are directly delineated onto 3D MR images, 3) all the voxels from the brain
were labeled, including WM areas, subcortical nuclei and cortical regions.
In other species, including primates, several atlases have been based on ex vivo samples. Here, we developed an atlas based on in vivo images that do not suffer from the deformation of post mortem tissue processing. We also averaged data from several animals to reduce bias linked to individual differences.
4.1. Accuracy of cerebral label attribution
After the seminal work of Brodmann (Brodmann, 1999 (original in 1909)), cytoarchitectural and other histology-based labeling techniques were the standard methods used for brain parcellation. This strategy was used to annotate cortical region atlases (Le Gros Clark, 1931; Zilles et al., 1979) and non-cortical structures (Bons et al., 1998) in mouse lemurs. For our atlas, delineation of WM and subcortical structures was relatively accurate because of the strong contrast in the brain template. Delineation of cortical regions, however, was mainly based on the transfer of structures found in histological atlases (Le Gros Clark, 1931; Zilles et al., 1979). New techniques of brain parcellation such as registration of MRI to 3D histological sections or measures of anatomical or functional connectivity (Glasser et al., 2016) will allow future refinements of atlas labels.
4.2. Application of the mouse lemur atlas to automatically annotate brain regions
Previous studies of cerebral atrophy in mouse lemurs were based on time-consuming manual segmentations (Kraska et al., 2011) or on VBM that can highlight atrophied structures, but that does not provide individual measures of the volume of atrophied structures (Sawiak et al., 2014). Here we showed that using atlas-based registration, individual scans can be annotated automatically, eliminating the time consuming step of manual tissue segmentation, and enabling rapid and objective quantification of individual subjects’ brain region volumes. Using this method, a reanalysis of past data processed by VBM (Sawiak et al., 2014) produced similar results. The interest of this method is that, unlike VBM measures of atrophy, it provided individual measures of the volumes of each brain region and allowed a quantitative assessment of the atrophy. Caution should, however, be recommended after automatic annotation of brain regions, and in particular for small regions or for regions close to CSF, and it is always recommended to perform a visual assessment of the quality of the annotation.
4.3. Application of the mouse lemur atlas for comparative neuroanatomy
Comparative anatomy should be performed on reliable measures of brain structures to provide reliable interpretations. One of the obstacles when evaluating many different rare animals is to have access to anatomical data that are often difficult to record. For this reason, many studies (Barton and Harvey, 2000; Finlay and Darlington, 1995) have used measures from a histological study published in the 1980s (Stephan et al., 1981). The study was based on perfused brains, extracted out of the skull, embedded in paraffin and sectioned serially. The borders of brain structures were delineated from the stained histological sections. Calculations were performed to take into account distances between the sections and corrections applied for shrinkage resulting from fixation and embedding. Although it has been acknowledged that the different components of the brain may have sustained different degrees of shrinkage, these differences were considered negligible and not
accounted for. We found substantial differences between the measures we made and the data reported in this reference article. One likely explanation is the post mortem artefacts associated with brain sampling and shrinkage resulting from fixation and embedding during histological preparation. An additional explanation may be differences in delineation of brain structures. It is impossible to evaluate how delineation was done in the reference article as technologies at the time did not allow digitization of large datasets. Delineation of an MRI template is expected to be less accurate than that of histological sections, but one of the advantages of MRI-based digital atlases is that the whole set of data is publicly available and can thus be corrected by other researchers.
Published datasets suggest that the ratio of the cortical to cerebral volume is highly different between humans (92%) and mouse lemurs (61%) (Stephan et al., 1981). Also, they report intermediate values for the marmoset, macaque and chimpanzee (76%, 85%, and 89%, respectively). These reference data support the theory of the corticalization of the human brain. Unexpectedly, our own analyses based on MRI-based atlases show similar cortical indices (56±3%) in four primates (mouse lemurs, marmosets, macaques and humans) while lower values were found in mice. Our results are not consistent with a corticalization theory of brain evolution. This is a good demonstration of the interest in revisiting previous comparative anatomy studies but using MRI-based atlases. Also, contrary to some previous assertions (see (Passingham, 1981) for example), we showed that mouse lemurs do not differ from other primates in the proportion of their cortex and must not be considered, in this respect, as "lower primates". Major differences between primates were found for the WM/cerebrum indices. These are bigger in macaques and humans, suggesting that WM increase, a marker for reinforced intracerebral connectivity, is a critical event for primate brain evolution, as already proposed by several authors (Schenker et al., 2005; Schoenemann et al., 2005). Hippocampus/cerebrum indices also decreased for the different primates. Our atlas of the mouse lemur is thus a key tool for future collaborative studies of primate brain evolution.
5. Conclusion
We constructed the first 3D digital atlas of the mouse lemur brain. It consists of a template constructed from in vivo MRI of 34 animals and labelled maps including all brain regions. It is freely distributed at https://www.nitrc.org/projects/mouselemuratlas and also includes GM, WM and CSF probability maps. The imaging tools used to create and manipulate the template are also available (https://sammba-mri.github.io). The labelled atlas itself has room for improvement. For example, future cortex parcellation could be based on the registration of our atlas to histological data. Newer brain imaging modalities such as structural or functional connectivity could also be included in future versions to improve understanding of primate brains. This atlas is an important tool for current and future automatic evaluation of pathologies in mouse lemur brains and for comparative anatomy.
6. Acknowledgements
We thank the France-Alzheimer Association, Plan Alzheimer Foundation and the French Public Investment Bank’s “ROMANE” program for funding this study.
7. References
Barton, R.A., Harvey, P.H., 2000. Mosaic evolution of brain structure in mammals. Nature 405, 1055-1058.
Bertrand, A., Pasquier, A., Petiet, A., Wiggins, C., Kraska, A., Joseph-Mathurin, N., Aujard, F., Mestre-Francés, N., Dhenain, M., 2013. Micro-MRI study of cerebral aging: Detection of hippocampal subfield reorganization, microhemorrhages, and amyloid plaques in mouse lemur primates. PlosOne 8, e56593. doi:56510.51371/journal.pone.0056593.
Black, K.J., Koller, J.M., Snyder, A.Z., Perlmutter, J.S., 2001a. Template images for nonhuman primate neuroimaging: 2. Macaque. Neuroimage 14, 744-748.
Black, K.J., Snyder, A.Z., Koller, J.M., Gado, M.H., Perlmutter, J.S., 2001b. Template images for nonhuman primate neuroimaging: 1. Baboon. Neuroimage 14, 736-743.
Bons, N., Sihol, S., Barbier, V., Mestre-Frances, N., Albe-Fessard, D., 1998. A stereotaxic atlas of the grey lesser mouse lemur brain (Microcebus murinus). Brain Res. Bull. 46, 1-173.
Bowden, D.M., Song, E., Kosheleva, J., Dubach, M.F., 2012. NeuroNames: an ontology for the BrainInfo portal to neuroscience on the web. Neuroinformatics 10, 97-114.
Brodmann, K., 1999 (original in 1909). Brodmann's 'Localisation in the cerebral cortex' {Vergleichende Lokalisationslehre der Grosshirnrinde in ihren Orinzipien dargestellt auf Grund des Zellenbaus}, Garey, Laurence J. ed. Imperial College Press, London.
Cox, R.W., 1996. AFNI: software for analysis and visualization of functional magnetic resonance neuroimages. Comput. Biomed. Res. 29, 162-173.
Dhenain, M., Chenu, E., Hisley, C.K., Aujard, F., Volk, A., 2003. Regional atrophy in the brain of lissencephalic mouse lemur primates: measurement by automatic histogram-based segmentation of MR images. Magn. Reson. Med. 50, 984-992.
Djelti, F., Dhenain, M., Terrien, J., Picq, J.L., Hardy, I., Champeval, D., Perret, M., Schenker, E., Epelbaum, J., Aujard, F., 2016. Impaired fasting blood glucose is associated to cognitive impairment and cerebral atrophy in middle-aged non-human primates. Aging (Albany NY) 9, 173-186.
Dorr, A.E., Lerch, J.P., Spring, S., Kabani, N., Henkelman, R.M., 2008. High resolution three-dimensional brain atlas using an average magnetic resonance image of 40 adult C57Bl/6J mice. Neuroimage 42, 60-69.
Ella, A., Keller, M., 2015. Construction of an MRI 3D high resolution sheep brain template. Magn. Reson. Imaging 33, 1329-1337.
Ezran, C., Karanewsky, C.J., Pendleton, J.L., Sholtz, A., Krasnow, M.R., Willick, J., Razafindrakoto, A., Zohdy, S., Albertelli, M.A., Krasnow, M.A., 2017. The mouse lemur, a genetic model organism for primate biology, behavior, and health. Genetics 206, 651-664.
Filipek, P.A., Richelme, C., Kennedy, D.N., Caviness, V.S., Jr., 1994. The young adult human brain: an MRI-based morphometric analysis. Cereb. Cortex 4, 344-360.
Finlay, B.L., Darlington, R.B., 1995. Linked regularities in the development and evolution of mammalian brains. Science 268, 1578-1584.
Ghosh, P., O'Dell, M., Narasimhan, P.T., Fraser, S.E., Jacobs, R.E., 1994. Mouse lemur microscopic MRI brain atlas. Neuroimage 1, 345-349.
Glasser, M.F., Coalson, T.S., Robinson, E.C., Hacker, C.D., Harwell, J., Yacoub, E., Ugurbil, K., Andersson, J., Beckmann, C.F., Jenkinson, M., Smith, S.M., Van Essen, D.C., 2016. A multi-modal parcellation of human cerebral cortex. Nature 536, 171-178.
Guimond, A., Meunier, J., Thirion, J.-P., 1998. Automatic computation of average brain models. Medical image computing and computer-assisted interventation. In: Wells W.M., C.A., Delp S. (eds) (Ed.), Medical Image Computing and Computer-Assisted Intervention — MICCAI 98. Springer, Berlin, Heidelberg, pp. 631-640.
Guimond, A., Meunier, J., Thirion, J.-P., 2000. Average brain models: a convergence study. Comput. Vis. Image. Underst. 77, 192-210.
Hikishima, K., Quallo, M.M., Komaki, Y., Yamada, M., Kawai, K., Momoshima, S., Okano, H.J., Sasaki, E., Tamaoki, N., Lemon, R.N., Iriki, A., Okano, H., 2011. Population-averaged standard template brain atlas for the common marmoset (Callithrix jacchus). Neuroimage 54, 2741-2749.
Kraska, A., Dorieux, O., Picq, J.-L., Petit, F., Bourrin, E., Chenu, E., Volk, A., Perret, M., Hantraye, P., Mestre-Frances, N., Aujard, F., Dhenain, M., 2011. Age associated cerebral atrophy in mouse lemur Primates. Neurobiol. Aging 32, 894–906.
Languille, S., Blanc, S., Blin, O., Canale, C.I., Dal-Pan, A., Devau, G., Dhenain, M., Dorieux, O., Epelbaum, J., Gomez, D., Hardy, I., Henry, P.Y., Irving, E.A., Marchal, J., Mestre-Frances, N., Perret, M., Picq, J.L., Pifferi, F., Rahman, A., Schenker, E.I., Terrien, J., Thery, M., Verdier, J.M., Aujard, F., 2012. The grey mouse lemur: A non-human primate model for ageing studies. Ageing Res. Rev. 11, 150-162.
Le Gros Clark, W.E., 1931. The brain of Microcebus murinus. Proc. Zool. Soc. London 101, 463-486. MacKay, D.J.C., 2003. Information theory, inference and learning algorithms. Cambridge University Press, Cambridge.
McLaren, D.G., Kosmatka, K.J., Oakes, T.R., Kroenke, C.D., Kohama, S.G., Matochik, J.A., Ingram, D.K., Johnson, S.C., 2009. A population-average MRI-based atlas collection of the rhesus macaque. Neuroimage 45, 52-59.
Montgomery, S.H., Capellini, I., Barton, R.A., Mundy, N.I., 2010. Reconstructing the ups and downs of primate brain evolution: implications for adaptive hypotheses and Homo floresiensis. BMC biology 8, 9.
Nadkarni, N. A., Bougacha, S., Garin C., Dhenain M., Picq J.L., 2018. Digital templates and brain atlas of the mouse lemur primate. Data Brief. Data in Brief 21 1178–1185.
Oguz, I., Zhang, H., Rumple, A., Sonka, M., 2014. RATS: Rapid Automatic Tissue Segmentation in rodent brain MRI. J Neurosci Methods 221, 175-182.
Papp, E.A., Leergaard, T.B., Calabrese, E., Johnson, G.A., Bjaalie, J.G., 2014. Waxholm Space atlas of the Sprague Dawley rat brain. Neuroimage 97, 374-386.
Passingham, R.E., 1981. Primate specialization in brain and intelligence. Symposia of the Zoological Society of London 46, 361-388.
Picq, J.L., Aujard, F., Volk, A., Dhenain, M., 2012. Age-related cerebral atrophy in nonhuman primates predicts cognitive impairments. Neurobiol. Aging 33, 1096–1109.
Pifferi, F., Terrien, J., Marchal, J., Dal-Pan, A., Djelti, F., Hardy, I., Chahory, S., Cordonnier, N., Desquilbet, L., Hurion, M., Zahariev, A., Chery, I., Zizzari, P., Perret, M., Epelbaum, J., Blanc, S., Picq, J.-L., Dhenain, M., Aujard, F., 2018. Caloric restriction increases lifespan but affects brain integrity in grey mouse lemur primates. Comm. Biol. 1, 30.
Quallo, M.M., Price, C.J., Ueno, K., Asamizuya, T., Cheng, K., Lemon, R.N., Iriki, A., 2010. Creating a population-averaged standard brain template for Japanese macaques (M. fuscata). Neuroimage 52, 1328-1333.
Reveley, C., Gruslys, A., Ye, F.Q., Glen, D., Samaha, J., B, E.R., Saad, Z., A, K.S., Leopold, D.A., Saleem, K.S., 2017. Three-Dimensional Digital Template Atlas of the Macaque Brain. Cereb. Cortex 27, 4463-4477.
Sawiak, S.J., Picq, J.L., Dhenain, M., 2014. Voxel-based morphometry analyses of in vivo MRI in the aging mouse lemur primate. Front. Aging Neurosci. 6, 82.
Sawiak, S.J., Wood, N.I., Williams, G.B., Morton, A.J., Carpenter, T.A., 2013. Voxel-based morphometry with templates and validation in a mouse model of Huntington's disease. Magn. Reson. Imaging 31, 1522-1531.
Schenker, N.M., Desgouttes, A.M., Semendeferi, K., 2005. Neural connectivity and cortical substrates of cognition in hominoids. J. Hum. Evol. 49, 547-569.
Schoenemann, P.T., Sheehan, M.J., Glotzer, L.D., 2005. Prefrontal white matter volume is disproportionately larger in humans than in other primates. Nat. Neurosci. 8, 242-252.
Stephan, H., Frahm, H., Baron, G., 1981. New and revised data on volumes of brain structures in insectivores and primates. Folia Primatol. (Basel) 35, 1-29.
Talairach, J., Tournoux, P., 1988. Co-planar stereotaxic atlas of the human brain.
Woodward, A., Hashikawa, T., Maeda, M., Kaneko, T., Hikishima, K., Iriki, A., Okano, H., Yamaguchi, Y., 2018. The Brain/MINDS 3D digital marmoset brain atlas. Scientific data 5, 180009.
Yin, Y., Zhang, X., Williams, R., Wu, X., Anderson, D.D., Sonka, M., 2010. LOGISMOS--layered optimal graph image segmentation of multiple objects and surfaces: cartilage segmentation in the knee joint. IEEE Trans. Med. Imaging 29, 2023-2037.
Yushkevich, P.A., Piven, J., Hazlett, H.C., Smith, R.G., Ho, S., Gee, J.C., Gerig, G., 2006. User-guided 3D active contour segmentation of anatomical structures: significantly improved efficiency and reliability. Neuroimage 31, 1116-1128.
Zilles, K., Rehkamper, G., Schleicher, A., 1979. A quantitative approach to cytoarchitectonics. V. The areal pattern of the cortex of Microcebus murinus (E. Geoffroy 1828), (Lemuridae, primates). Anat. Embryol. 157, 269-289.
Supplementary Table 1. Comparison of the volumes (mm3) of various cerebral structures according to our 3D atlas and that of the reference histological evaluation (Stephan et al., 1981).
Current 3D atlas Reference histological-based evaluation
Difference between histology-based measures and 3D atlas
Total brain 1668 1680 +0.7% Telencephalon 1180 1129 -4% Diencephalon 120 134 +12% Striatum 72.7 85.7 +18% Pallidum 17.3 10.7 -38% Amygdala 26.1 36.4 +39% Cerebellum 206.3 234.0 +13% Septum 12.5 15.3 +21% Hippocampus 72.7 100.0 +38% Thalamus 89.5 78.3 -12% Hypothalamus 25.1 29.8 +19% Olfactory bulb 56.5 43.0 -23%
Supplementary Table 2. Total brain volume and volume fractions of hippocampus, cortex, WM and striatum against total cerebrum volume in mouse, rat, mouse lemur, marmoset, macaque and human. brain volume (mm3) hippocampus/ cerebrum cortex/ cerebrum WM/ cerebrum striatum/ cerebrum Mouse 426 0.095 0.51 0.09 0.072 Rat 2314 0.100 0.55 0.10 0.083 Mouse lemur 1668 0.063 0.54 0.17 0.063 Marmoset 7678 0.055 0.57 0.18 0.046 Macaque 74324 0.018 0.59 0.30 0.045 Human 1380000 0.008 0.58 0.37 0.017