HAL Id: tel-03094735
https://tel.archives-ouvertes.fr/tel-03094735
Submitted on 4 Jan 2021HAL is a multi-disciplinary open access
archive for the deposit and dissemination of sci-entific research documents, whether they are pub-lished or not. The documents may come from teaching and research institutions in France or abroad, or from public or private research centers.
L’archive ouverte pluridisciplinaire HAL, est destinée au dépôt et à la diffusion de documents scientifiques de niveau recherche, publiés ou non, émanant des établissements d’enseignement et de recherche français ou étrangers, des laboratoires publics ou privés.
Improved models for predicting irradiation damage with
uncertainty estimates from nuclear reactions
Shengli Chen
To cite this version:
Shengli Chen. Improved models for predicting irradiation damage with uncertainty estimates from nuclear reactions. Nuclear Experiment [nucl-ex]. Université Grenoble Alpes [2020-..], 2020. English. �NNT : 2020GRALI048�. �tel-03094735�
THÈSE
Pour obtenir le grade de
DOCTEUR DE L’UNIVERSITE GRENOBLE ALPES
Spécialité : Mécanique des fluides, Energétique, ProcédésArrêté ministériel : 25 mai 2016
Présentée par
Shengli CHEN
Thèse dirigée par Patrick BLAISE, CEA/DES/DSE, et
codirigée par David BERNARD, CEA/DES/IRESNE/DER/SPRC/LEPh
préparée au sein du CEA/DES/IRESNE/DER/SPRC/LEPh dans l'École Doctorale I-MEP2 : Ingénierie – Matériaux,
Mécanique, Environnemenlt, Energétique, Procédés, Production
Improved models for predicting
irradiation damage with uncertainty
estimates
from nuclear reactions
Thèse soutenue publiquement le 25 septembre 2020, devant le jury composé de :
M. Pablo RUBIOLO
Professeur, PHELMA – Grenoble INP, Président
M. Ulrich FISCHER
Chercheur, IRN – Karlsruhe Institute of Technology (KIT), Rapporteur
M. Joël ROSATO
Maître de conférences, Université Aix-Marseille, Rapporteur
M. Jose Manuel PERLADO MARTIN
Professeur, Universidad Politecnica de Madrid, Examinateur
M. Ian FARNAN
Professeur, Cambridge University, Examinateur
Mme. Emilie FERRIE
Maître de conférences, Université Grenoble Alpes, Examinatrice
M. Patrick BLAISE
Directeur de recherche, CEA, Directeur de thèse, Invité
M. David BERNARD
i
Acknowledgements
It is a great opportunity to perform my PhD studies in CEA Cadarache with world-leading experts. I really enjoyed the relatively free work environment and all supports provided by CEA and our laboratory.
First of all, I would like to express my deepest gratitude to my main supervisor Dr. David Bernard for all his support and help. Especially, for his free-style advice and supervision that allow to explore various directions within the PhD framework. Thanks a lot for all the patience, time, guidance, and advice in the past three years. In most of the time, David is more like a kind colleague and friend to work with, so that I can finish this thesis with much less stress. Thanks also for his help during the telecommuting owing to Covid-19.
I would like to extend my sincere thanks to my PhD director Dr. Patrick Blaise. Thanks a lot for the enthusiastic supervision and helps as well as the organization of academic seminar with other divisions (even if it is strongly perturbed by Covid-19). Thanks a lot for the time and ideas with which you contributed to this thesis. Patrick also spent much time on reviewing this thesis.
Special thanks to my jury members, for their (remote) presence and suggestions on this thesis. It is my pleasure to defense my PhD before them, experts on different domains. Especially, I acknowledge my two thesis reviewers, Dr. Fischer and Dr. Rosato, they took much time to review the thesis and give their significant comments.
I gratefully acknowledge my colleagues of LEPh for all kinds of helps. Particularly, Dr. Gilles Noguère, my former supervisor when I was intern, for his significant advice and guidance on nuclear data. I am also grateful to Dr. Pierre Tamagno for his kind support, especially for the technical help on the use and development of the CONRAD code. Special thanks to Dr. Yannick Pénéliau for following my PhD studies during these three years and for all his helps and discussion.
Thanks to my colleagues, Dr. Jean Tommasi, Dr. Olivier Sérot, Dr. Laurent Buiron, Dr. Léonie Tamagno, Dr. Olivier Litaize, Dr. Maria Diakaki, Dr. Pascal Archier, and Mr. Elias Vandermeersch for helpful discussions and their contributions to this thesis. Thanks also to Dr. Pierre Leconte for tolerating my discussion with David for around hundred times.
ii
I would like to recognize many helps received from our laboratory head, Dr. Véronique Bellanger-Villard. I also acknowledge Mrs. Claire Boucher and Mrs. Alexandra Herrenschmidt for their help on administrative formalities during my PhD studies. Certainly, thanks to Mrs. Agustina Alessio and Mrs. Rafaela Bueno-Clementi from doctoral school I-MEP2 for their nice supports during these three years.
Thanks to current and former PhD students and Postdoc of LEPh for the lunch time, jokes, and sometimes complaining in the past three years. It is also a good opportunity for me to supervise and work with my two interns, Mr. Dingbang Cai and Mr. Hao Li.
I am grateful to Cadarache Chinese PhD team (Hui, Fang, Jianwei, Ling, Shuqi, Weifeng, Chunhui, Congjin, Xiaoshu, Yuying, Jingtian, Linkai, etc.) for the afterwork time and delicious Chinese food. Thanks to all my friends, my former teachers and supervisors who directly or indirectly helped my former studies and my PhD works.
Last but not least, many thanks to my family and my girlfriend for their understanding and support, especially in the difficult period of Covid-19. Family is where life begins and love never ends.
iii
Abstract
Because the irradiation damage is a major challenge of nuclear materials, it is of upmost importance to accurately calculate it with reliable uncertainty estimates. The main objective of this thesis is to develop and improve the methodologies for computing the neutron irradiation-induced displacement damages as well as their uncertainties. After a brief review on nuclear reaction models and primary radiation damage models, we propose a complete methodology for calculating damage cross sections from different nuclear reactions and the subsequent calculation of Displacement per Atom (DPA) rates.
The recoil energies from neutron-induced reactions are summarized with an estimation of the relativistic effect and the target thermal vibration. Particularly, a new method for computing the recoil energy from charged particle emission reactions is proposed by considering both the quantum tunneling and the Coulomb barrier. Some methods are developed to improve and verify numerical calculations. Damage cross section calculations from neutron radiative capture reaction and N-body reactions are also thoroughly analyzed and discussed. In addition to the neutron irradiation-induced displacement damage, the electron, positron, photon-induced DPA cross sections, as well asthe beta decay and Fission Products (FPs)-induced damage are also investigated. Orders of magnitude of their relative contributions are given.
For the neutron irradiation-induced DPA rate calculation, attention should be paid when using infinite dilution cross sections. E.g., in the ASTRID inner core, the self-shielding correction on ECCO 33-group damage cross sections leads to a 10% reduction of DPA rate, whereas the multigroup correction is still not automatically treated for DPA rate calculation in neutronic codes nor for computing Primary Knock-on Atom (PKA) spectrum. Based on the presently proposed method for computing the FPs-induced DPA by atomistic simulations, the peak value of the FPs-induced DPA rate can be 4 to 5 times larger than the neutron-induced one in the cladding of the ASTRID inner core, even though the penetration of FPs in the Fe-14Cr cladding is less than 10 µm. Therefore, the question of whether the FPs-induced damage should be considered for determining fuel assembly lifetime in fast reactors needs to be discussed.
In the reactor vessel of a simplified pressurized water reactor, the covariance matrices of 235U prompt fission neutron spectrum from ENDF/B-VII.1 and JENDL-4.0
respectively lead to 11% and 7% relative uncertainty of DPA rate. Neglecting the correlations of the neutron flux and PKA spectrum results in an underestimation by a factor of 21. The total uncertainties of damage energy rate are respectively 12% and 9%, whereas an underestimation by a factor of 3 is found if the correlations of damage cross section and neutron flux are not considered.
iv
Maitrise des biais et incertitudes des sections efficaces
et de la modélisation de la cinématique associées aux
réactions nucléaires conduisant aux dommages dans
les matériaux sous irradiation
Resumé
Étant donné que les dommages causés par l'irradiation constituent un défi majeur pour les matériaux nucléaires, il est nécessaire de calculer précisément ces dommages conjointement avec l’estimation de ses incertitudes. L'objectif principal de cette thèse est de développer et d'améliorer les méthodologies pour calculer les dommages induits par l'irradiation neutronique ainsi que de proposer une méthodologie pour l’estimation de l'incertitude. Après une brève revue des modèles de réactions nucléaires et des modèles de dommages d’irradiation primaires, on propose des méthodes complètes pour calculer la section efficace des dommages à partir de différentes réactions nucléaires pour calculer du taux de Déplacement par Atome (DPA).
Une interpolation améliorée est proposée pour produire la valeur de crête de la distribution d'énergie-angulaire à partir de données tabulées. Les énergies de recul des réactions induites par les neutrons sont résumées avec une estimation de l'effet relativiste et de la vibration thermique de la cible. En particulier, une nouvelle méthode de calcul de l'énergie de recul des réactions d'émission de particules chargées est proposée en considérant l’effet tunnel et la barrière Coulombienne. Certaines méthodes sont développées pour améliorer et vérifier les calculs numériques. Les calculs de la section de dommage provenant de la réaction de la capture et des réactions d’émission de N-corps sont également analysés et discutés en profondeur. En plus des dommages induits par l'irradiation neutronique, les sections DPA induites par les électrons, les positons et les photons et les dommages induits par la désintégration bêta sont également étudiées.
Pour le calcul du taux de DPA induit par l'irradiation neutronique, il convient de faire attention lors de l'utilisation de sections à dilution infinie. Par exemple, dans le cœur interne d’ASTRID, la correction d'autoprotection sur la section DPA de ECCO 33-groupe conduit à une réduction de 10% du taux de DPA, tandis que cette correction multi-groupe n'est pas toujours automatiquement traitée pour le calcul de DPA dans les codes neutroniques ni pour le calcul du spectre Primary Knock-on Atom (PKA). En plus des dommages par les neutrons, une méthode générale est proposée pour calculer les dommages de déplacement induits par les Produits de Fission (PFs) avec des
v
simulations de collisions atomistiques. Elle montre que la valeur de crête du taux de DPA induit par les PFs peut être 4 à 5 fois supérieure à celle induite par les neutrons dans la gaine du cœur interne d’ASTRID, même si la pénétration des PFs dans la gaine Fe-14Cr est inférieure à 10 µm. Par conséquent, la question si les dommages induits par les PFs doivent être pris en compte pour déterminer la durée de vie des assemblages combustibles dans les réacteurs rapides doit être discutée.
Dans la cuve d'un réacteur à eau pressurisée, les matrices de covariance du spectre de neutrons prompts de fission de 235U venant de ENDF/B-VII.1 et JENDL-4.0
conduisent respectivement à une incertitude de 11% et 7% du taux de DPA. Négliger les corrélations du flux de neutrons et du spectre PKA entraîne une large sous-estimation d’un facteur de 21. Les incertitudes totales du taux de dommages sont respectivement de 12% et 9%, tandis que les nulles valeurs des corrélations de la section efficace de dommage et du flux de neutron conduisent à une réduction de l'incertitude par un facteur de 3.
vi
Table of contents
Acknowledgements ... i Abstract . ... iii Resumé . ... iv Table of contents ... vi List of figures ... xList of tables ... xviii
Glossary ... xx
1 Introduction ... 1
1.1 Nuclear power ... 1
1.2 Irradiation damage of materials ... 2
1.3 Objectives of this thesis ... 5
1.4 Overview of this thesis... 6
2 Nuclear reaction models and nuclear data ... 7
2.1 R-matrix theory ... 7
2.2 Optical model ... 9
2.3 Statistical model ... 12
2.4 Blatt-Biedenharn formula and angular distribution ... 14
2.4.1 Elastic scattering of a spinless particle ... 15
2.4.2 General two-body reaction ... 16
2.4.3 Conventions of angular distribution... 17
2.5 Energy-angular distribution ... 19
2.5.1 Kalbach-Mann systematics ... 19
2.5.2 Interpolation of energy-angular distribution [62] ... 20
3 Primary radiation damage models ... 25
3.1 Threshold atomic displacement energy ... 25
3.2 Kinchin-Pease formula... 27
3.3 Lindhard’s theory of damage energy ... 29
3.4 Norgett-Robinson-Torrens formula ... 30
vii
3.5 Athermal Recombination-Corrected formula ... 31
3.6 A simple proposition [89]... 33
3.7 BCA and MD simulations ... 37
3.7.1 Brief introduction of BCA and MD simulations ... 37
3.7.2 Recent discussion on SRIM-like BCA codes [104] ... 39
3.8 Measurements of number of atomic displacements ... 43
4 Calculation of damage cross sections ... 46
4.1 Thermal vibration of the target atom [113] ... 46
4.1.1 Two-body elastic collision kinematics ... 46
4.1.2 Numerical results ... 48
4.2 Relativistic effect on the calculation of recoil energy [114] ... 49
4.2.1 Relativistic kinematics ... 49
4.2.2 Numerical results ... 51
4.2.3 Summary of relativistic corrections ... 57
4.3 Calculation of recoil energy in different frames ... 59
4.3.1 Discrete reactions [62] ... 59
4.3.2 Continuum reactions [62] ... 60
4.3.2.1 Recoil energy vs emission angle and secondary energy in the Lab frame ... 60
4.3.2.2 Recoil energy vs emission angle and secondary energy in the CM frame ... 61
4.3.3 Charged particle emission reactions [71] ... 61
4.3.4 Radiative capture reaction [34] ... 63
4.4 Neutron-induced damage cross sections ... 64
4.4.1 Two-body reactions [62] ... 65
4.4.2 Radiative capture reactions ... 68
4.4.3 N-body reactions ... 70
4.5 Photon-induced damage cross sections [120] ... 74
4.5.1 Electron and positron-induced damage cross section ... 74 4.5.2 From electron and positron to photon-induced damage cross sections 75
viii
4.5.2.1 Compton Scattering ... 75
4.5.2.2 Photoelectric Effect ... 76
4.5.2.3 Pair Production... 77
4.5.2.4 Monte Carlo simulations ... 78
4.5.3 Electron, positron, and photon-induced DPA cross sections for iron .. 80
4.6 Beta decay-induced damage cross sections [79] ... 81
4.6.1 Beta decay ... 81
4.6.2 Electron-induced displacement damage ... 83
4.6.3 Atomic displacement induced by residual atom ... 84
4.7 Discussion on damage cross sections of polyatomic materials ... 87
5 Calculation of DPA rates ... 90
5.1 DPA rate calculation using damage cross sections ... 90
5.2 Self-shielding correction on DPA rate calculation [113] ... 91
5.3 DPA rate calculation by generating PKA spectra ... 96
5.4 Fission products-induced DPA in fuel cladding [145] ... 99
5.4.1 Methodology ... 99
5.4.1.1 Description of the model ... 99
5.4.1.2 Estimate of fission products-induced atomic displacements in the cladding ... 102
5.4.2 Numerical results ... 106
5.4.2.1 Ranges of fission products in fuel and cladding ... 106
5.4.2.2 Atomic displacements induced by fission products ... 107
5.4.2.3 Comparison with neutron-induced damage in cladding ... 110
5.4.3 Summary of fission product-induced radiation damage ... 112
6 Methods for uncertainty propagation ... 114
6.1 Covariance between model parameters ... 114
6.2 Uncertainty propagation... 116
6.2.1 Analytical method ... 116
6.2.1.1 Remark on sensitivities to DPA model parameters ... 117 6.2.1.2 Uncertainty propagation from nuclear model parameters to keff 119
ix
6.2.2 Total Monte Carlo technique ... 122
7 Uncertainty assessment of damage rate in a PWR vessel ... 126
7.1 Uncertainty from prompt fission neutron spectrum ... 126
7.1.1 Analytical method via damage cross sections ... 130
7.1.2 Stochastic method via PKA spectrum ... 131
7.2 Uncertainty from nuclear model parameters ... 135
7.3 Uncertainty from DPA model ... 139
7.3.1 Uncertainty of damage energy rate ‹σD, ϕ› ... 140
7.3.2 Uncertainty of DPA rate ‹σDPA, ϕ› ... 141
7.4 Total uncertainty of DPA rate ... 143
7.5 Discussion on additional biases induced by model defects ... 145
8 Conclusions and prospects ... 148
8.1 Conclusions ... 148
8.2 Prospects ... 150
Appendix ... 152
A1 Differential cross section of hard-spheres elastic scattering ... 152
A2 Complementary data for explaining the positive correlations of neutron flux used in Section 7 [167] ... 153
A3 Algorithm to make a covariance matrix be positive-definite ... 154
A4 Complementary correlation matrices ... 154
A5 List of publications... 156
References ... 158
x
List of figures
Figure 1-1. Sources of world electricity production in 2017 [1]. ... 1 Figure 1-2. Total primary energy supply by fuel in 2017 [2]... 1 Figure 1-3. Stress-strain curves at 330 °C for the SA 304L alloy after different neutron
irradiation doses (in DPA) (taken from Ref. [22, 23]). ... 3 Figure 1-4. Qualitative plot of the dependence of swelling, resistivity, and hardening on
irradiation damage (taken from Ref. [24]). ... 4 Figure 1-5. Schematic of safety margins (taken from Ref. [26]). ... 5 Figure 2-1. Total cross section of 56Fe (JEFF-3.1.1). ... 7
Figure 2-2. Neutron elastic scattering cross section of 56Fe with perturbed parameters
(calculated by CONRAD) [34]. ... 9 Figure 2-3. Total cross section of 56Fe from ECIS calculation with optimized parameters
[42]. ... 11 Figure 2-4. Elastic (upper) and inelastic (lower) neutron scattering cross sections of
56Fe from TALYS calculation with optimized parameters [42]. ... 14
Figure 2-5. Legendre coefficients for neutron elastic scattering cross section of 56Fe
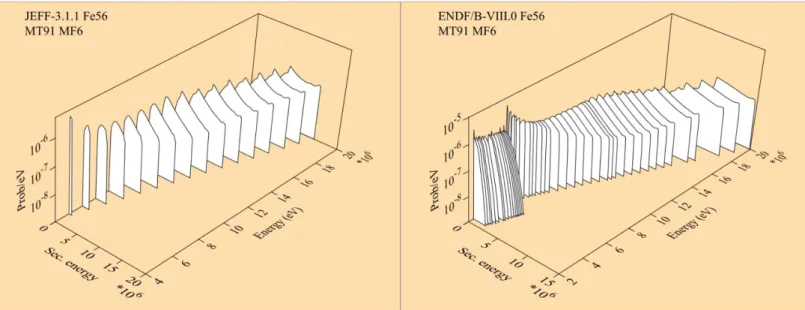
using resonance parameters from JEFF-3.1.1 and the zoom close to the resonance at 52.1397 keV (calculated by CONRAD). ... 18 Figure 2-6. Angle-integrated energy distributions of continuum neutron inelastic
scattering on 56Fe in JEFF-3.1.1 (left, E
thr = 4.618 MeV) and ENDF/B-VIII.0
(right, Ethr = 2.376 MeV). ... 21
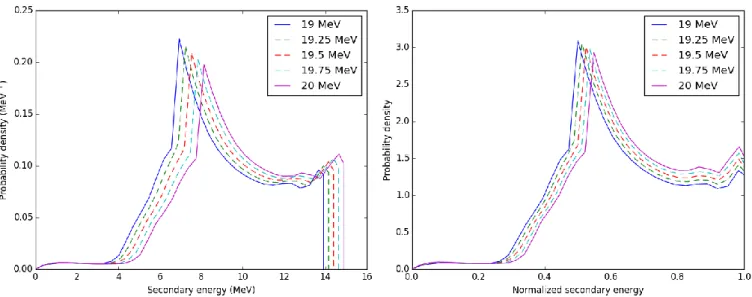
Figure 2-7. Scheme of the interpolation of energy-angular distributions. Red lines represent the data given in ENDF, the green points are interpolated data. 21 Figure 2-8. UBI of angle-integrated energy distributions of incident energy between 19
and 20 MeV neutron continuum inelastic scattering with 56Fe. The right
figure uses the normalized secondary energy to intuitively show the peak values. ... 22 Figure 2-9. Same results as Figure 2-8 but with the PUBI method. ... 24 Figure 3-1. Direction-dependent threshold displacement energy for bcc iron [66]. The
data are projected in the triangle of which the vertices are (1,0,0), (1,1,0), and (1,1,1). ... 25 Figure 3-2. Experimental data of the average number of displacements with respect to
PKA energy in Cu [67]... 26 Figure 3-3. Probability of stable atomic displacement versus recoil energy [24]. The
xi
Figure 3-4. Schematic of two-body atomic collision between PKA and an atom in lattice. ... 27 Figure 3-5. Ratios of experimental data, ARC-DPA, and CB-DPA to the NRT formula
for Fe, Ni, and Cu versus damage energy Ea. The experimental data
extracted from NEA report [82]. The experimental uncertainties are deduced from Tables 5 and 16 in Ref. [95] through the Resistivity of Frenkel pairs per unit concentration. The dashed pink lines indicate Ea=2Ed/0.8. ... 35
Figure 3-6. Ratios of Averback’s experimental data [80], ARC-DPA, and CB-DPA to NRT for Cu and Ag versus damage energy computed with the DPA-weighted average PKA energy. The uncertainties are from the uncertainties of sample thickness and electronic resistivity. ... 36 Figure 3-7. Ratios MD simulations-based number of atomic displacements to the NRT
formula for Au, W, and Pt along with the corresponding ARC-DPA fittings [97]. ... 37 Figure 3-8. Evolution of the number of Frenkel pairs formed during displacement
cascades using MD simulations [101]. ... 38 Figure 3-9. Difference between the ion-induced and PKA-induced number of atomic
displacements. (a) Schematic of the displacement of a PKA with energy E. Once this PKA is displaced by consuming Ed energy, it is a free ion with (E
- Ed) kinetic energy. (b) Number of atomic displacements induced by an
incident ion and a PKA at energy from Ed up to 2Ed. ... 39
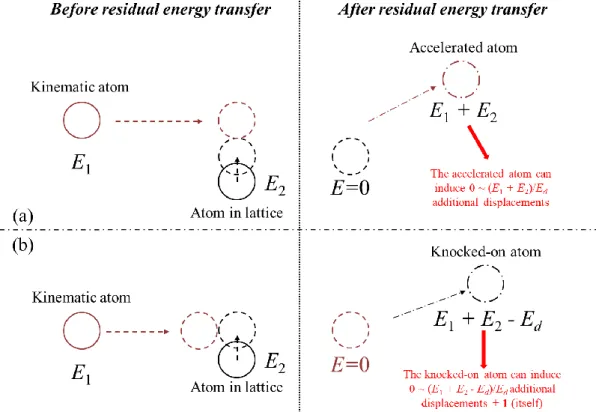
Figure 3-10. Schematic of energy transfer via elastic atomic collision. ... 40 Figure 3-11. Schematic of the maximum residual energy transfers from an atom in
lattice to a kinematic atom (upper) and from a kinematic atom to an atom in lattice (lower). ... 41 Figure 3-12. Qualitative description of energy dependence of κα... 42
Figure 4-1. Schematic of the collision in the Lab frame... 47 Figure 4-2. Average PKA energy of 56Fe for 100 eV, 500 eV, 1 keV, and 5 keV incident
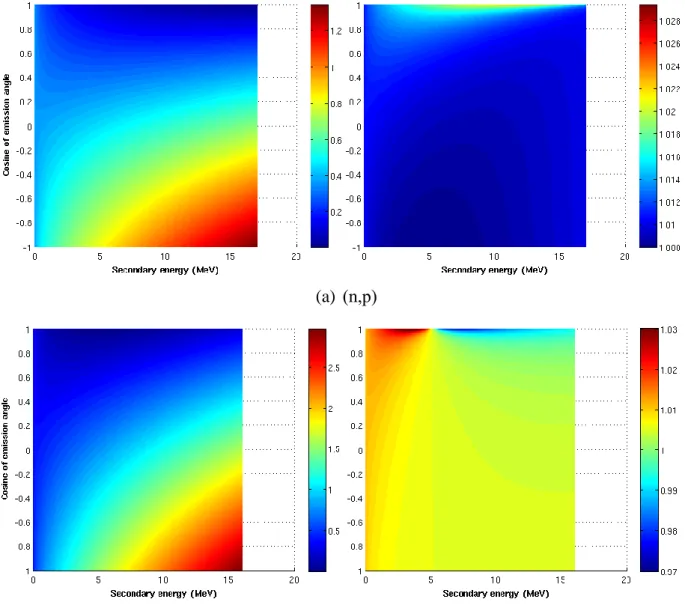
neutrons with different target temperatures. ... 48 Figure 4-3. Schematic of the collision in a laboratory framework. ... 50 Figure 4-4. Recoil energy within special relativity (left, in MeV) for 20 MeV neutron-induced proton emission reaction (a) and 𝛼 emission reaction (b) of 56Fe and
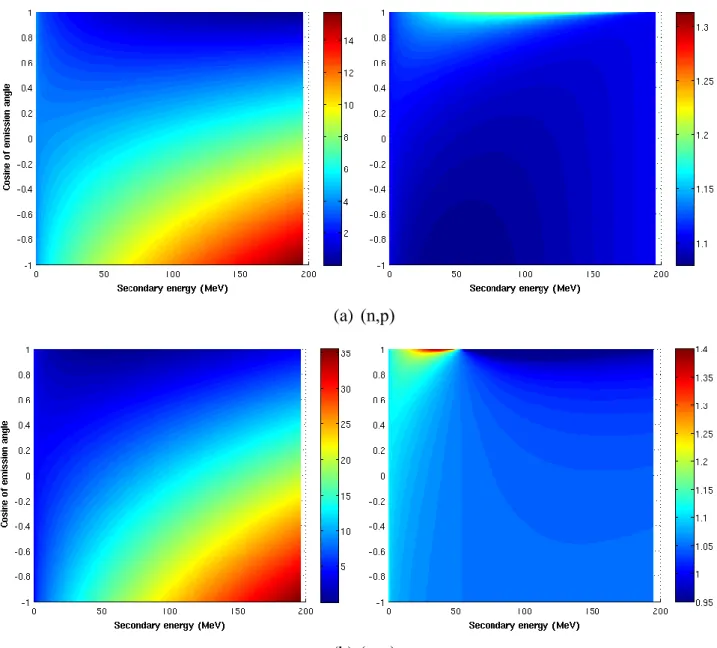
the ratio of relativistic to classic mechanical results for all nuclei (right). 52 Figure 4-5. Recoil energy within special relativity (left, in MeV) for a 200 MeV
neutron-induced proton emission reaction (a), and 𝛼 emission reaction (b) of 56Fe and the ratio of relativistic to classic mechanical results for all nuclei
xii
(right). ... 53 Figure 46. Recoil energy within special relativity (left, in MeV) and 200 MeV 𝛼 -induced 56Fe (𝛼 ,n) reaction the ratio of relativistic to classic mechanical
results for all nuclei (right). ... 54 Figure 4-7. Recoil energies within special relativity and classical mechanics versus
secondary energy for the 200 MeV neutron-induced (n,𝛼) reaction with 56Fe
at 𝜇 = 1. ... 54 Figure 4-8. Recoil energy within special relativity versus secondary energy obtained
with Eq. (4-17) (𝜇 = −1, 0, 1 ) and Eq. (4-20) (blue lines) for 20 MeV neutron (n,pi) reactions of 56Fe. ... 56
Figure 4-9. Recoil energy versus µ for relativistic kinematics and the corresponding relativistic corrections for 20 MeV and 200 MeV neutron-induced discrete p and α emissions of 56Fe. ... 57
Figure 4-10. Schematics of the collision in the Lab (upper) and the CM (lower) frames. ... 59 Figure 4-11. Rest energy of the system: before reaction, in compound nucleus form,
and after the collision. Sx (in green) illustrates the separation energies of
particle x, Q is the sum of Sx, VC is the Coulomb barrier energy. ... 62
Figure 4-12. Maximum PKA energies for 1 MeV (a), 14.1 MeV (b), and 20 MeV (c) neutron-induced reactions for 56Fe, 58Ni, and 59Ni. The green lines are
maximum PKA energies of neutron elastic scattering. ... 63 Figure 4-13. Neutron elastic scattering DPA cross sections of 56Fe performed with
different points Gauss-Legendre quadrature (upper) and the corresponding ratios to the 200-point Gauss-Legendre quadrature calculation (lower).... 66 Figure 4-14. Generalized damage energy of 56Fe versus 𝜇 for 5 keV neutron elastic
scattering. The two critical points are determined by Lindhard damage energy equal to Ed and 2.5Ed. ... 66
Figure 4-15. Neutron elastic scattering DPA cross sections of 56Fe performed with 20
and 200 points Gauss-Legendre Quadrature based Piecewise Integration (GLQPI). ... 67 Figure 4-16. Damage cross sections of 56Fe (n,2n), (n,nα), and (n,np) reactions
calculated by NJOY-2016 with double-differential cross sections of different particles from TENDL-2017 and the ratios to the calculations based on complete double-differential cross sections. ... 72 Figure 4-17. Product of damage energy and recoil energy distribution (i.e. f(E,ER)Ea(ER))
xiii
with linear-linear and histogram interpolations of energy distribution. Original interpolation mode in TENDL-2017 is histogram. The damage cross section is the integration of the curves from 0 to the maximum recoil energy. The damage cross section is the integration of the curves from 0 to the maximum recoil energy. ... 73 Figure 4-18. Comparison of damage cross sections of 56Fe (n,2n), (n,nα), and (n,np)
reactions calculated by NJOY-2016 and the present work with different double-differential cross sections from TENDL-2017. ... 74 Figure 4-19. Total displaced atoms per incident electron or positron. The lower figure
shows the ratio of atomic displacement number induced by positron to that induced by electron. ... 76 Figure 4-20. Electron production of 15 MeV incident gamma in 56Fe ... 78
Figure 4-21. Positron production of 15 MeV incident gamma in 56Fe. ... 79
Figure 4-22. Photon-induced DPA cross sections for iron based on McKinley-Feshbach analytical approximation (blue, noted as Ana) and Tripoli-4 simulations (green, noted as T4). ... 79 Figure 4-23. Electron, positron, and photon-induced NRT-DPA cross sections for iron
based on the Mott cross sections. ... 80 Figure 4-24. General energy level schema of a beta decay. ... 82 Figure 4-25. Intensity of 56Mn beta emission (from ENSDF [139]) and the
corresponding energy distribution of the emitted electrons. ... 82 Figure 4-26. Electron-induced DPA cross sections for iron. ... 83 Figure 4-27. Total number of displaced atoms per incident electron. ... 84 Figure 4-28. Schematic of kinematics of a beta decay. 𝑅, 𝑒, and 𝜐 represent the residual
atom, the emitted electron, and the antineutrino, respectively. ... 85 Figure 4-29. Recoil energy spectrum from 56Mn beta decay. ... 86
Figure 5-1. Total, elastic, inelastic, disappearance, and other n+NatFe reaction-induced
damage cross sections at room temperature. ... 91 Figure 5-2. Flowchart of DPA calculations without (green) and with (red) self-shielding
corrections. The dashed scheme is only for the verification of ECCO 33-group calculations by using multi-33-group cross sections and flux computed with transport code with finer energy structure (ECCO 1968-group in our studies). ... 92 Figure 5-3. Normalized neutron spectra for NJOY-iwt8, 1968-group lattice calculation
(blue) and 33-group full core calculation (red) flux in ASTRID inner core, and the relative elastic scattering cross section of 56Fe. ... 93
xiv
Figure 5-4. Layout of ASTRID core (3-fold rotational symmetry). ... 94 Figure 5-5. Correction coefficients of different (n+56Fe) cross sections for ECCO
33-group full core calculations. ... 94 Figure 5-6. Self-shielding effects with 33-group energy structure. DPA stands for the
relative DPA rate without self-shielding treatment of cross sections. 𝐷𝑃𝐴 refers to the self-shielding corrected DPA rate. 𝐷𝑃𝐴 − 𝐷𝑃𝐴 represents the reduction of DPA due to self-shielding, normalized by its integration over the whole energy range. ... 95 Figure 5-7. DPA rates (in DPA/year) in the fuel cladding in ASTRID inner core
computed with ECCO 33-group full core calculations. DPA rate induced by reactions other than MT448 is 0.0098 DPA/year. ... 96 Figure 5-8. Neutron flux spectrum at the inner surface of a French 900 MWe PWR RPV
[62]. ... 98 Figure 5-9. PKA spectra of 100% 56Fe material using neutron flux shown in Figure 5-8.
SPECTRA-PKA calculations based on TENDL-2015. ... 98 Figure 5-10. Schematic of FPs transport near the periphery of the fuel pellet. The dotted
curve in the fuel pellet illustrates the outermost position where FPs can reach the inner surface of cladding, whereas the dotted curve in the fuel cladding points out the deepest position where FPs can propagate. ... 100 Figure 5-11. JEFF-3.3 fission yields on atomic mass and the FIFRELIN average
kinematic energy of FPs (upper) and the JEFF-3.3 charge yields (lower). The red squares, blue triangles, and green circles in the lower figure represent the total charge yields, the charge yields for A = 95 and 139, respectively. ... 101 Figure 5-12. SRIM-2013 full cascade simulation of perpendicularly injected 70 MeV
139Xe into 5 μm (left) and 1 μm (right) UO
2 and subsequent Fe-14Cr. Green,
cyan, purple, blue, and pink points respectively stand for the displaced U, O, Fe, Cr, and W atoms. ... 103 Figure 5-13. Schematic of a FP produced in the depth of 𝑑FP in the fuel and emitted
with an angle 𝜃 towards the fuel cladding. ... 104 Figure 5-14. Possible angular directions that a FP produced at a distance 𝑑FP to the
surface of the fuel pellet can leave the fuel. The sphere determines the boundary of the migration of a FP. The plan (cylindric surface of which the radius is much large than Rf) is the surface of the fuel pellet. ... 105
Figure 5-15. 3D ion distribution of 100 MeV 95Sr into UO
2 (SRIM-2013 quick
xv
Figure 5-16. Distribution of vacancies in Fe-14Cr with SRIM full cascade simulations for 70 MeV 139Xe (upper) and 100 MeV 95Sr (lower) from different deep
UO2 fuel with 𝜃 = 0. ... 108
Figure 5-17. Distribution of vacancies in Fe-14Cr induced by 100 MeV 95Sr from the
surface of Fe-14Cr (upper) and 3 μm deep UO2 (lower) with different
incident angles and corresponding maximum and minimum averages. .. 109 Figure 5-18. Integrated vacancies 𝑅𝜕𝑣/𝜕𝑥 in Fe-14Cr induced by 70 MeV 139Xe and
100 MeV 95Sr and the corresponding maximum and minimum estimates.
... 111 Figure 6-1. Correlation between different orders of Legendre polynomials coefficients
for 56Fe neutron elastic scattering (calculated by CONRAD) [34]. ... 117
Figure 6-2. Sensitivity of (n+56Fe) damage cross section to resonance parameters and
DPA model parameters [34]. ... 119 Figure 6-3. ¼ view of the PERLE experiment (left) and the homogenized benchmark
(right). ... 120 Figure 6-4. ¼ view of the fast benchmark. ... 120 Figure 6-5. 2000 samples LHS of the five OMP parameters for n+56Fe reaction given
in Table 6-1: pi (i = 2,3,4,5) vs. p1. ... 123
Figure 6-6. 2000 samples LHS of the first four correlated OMP parameters for n+56Fe
reaction given in Table 6-1. ... 124 Figure 7-1. ¼ view of a simplified PWR model for performing neutronic calculations
[167]. The red part (i.e. vols. 1-4) is the reactor core; a steel envelope (i.e. vol. 10) divides the hot water (i.e. vols. 5-9) and cold water (i.e. vol. 11); the neutron flux in the RPV (i.e. vols. 12-14) is based on the score in vol. 13; the RPV is surrounded by a layer of air (i.e. vol. 15, treated as void in stochastic simulation) and the primary concrete (i.e. vol. 16). ... 127 Figure 7-2. Normalized neutron flux and the corresponding uncertainty (in gray) from
ENDF/B-VII.1 calculations [167] along with the accumulated DPA rate in the RPV. ... 128 Figure 7-3. Accumulated DPA rate at the RPV inner surface of a 900 MWe PWR. The
normalized DPA rates are computed with the JEFF-3.1.1, JEFF-3.3, and ENDF/B-VIII.0-based damage cross sections. ... 128 Figure 7-4. Relative uncertainties of neutron flux calculated with PFNS of ENDF/B-VII.1 and JENDL-4.0 [167]. ... 129 Figure 7-5. Correlation matrices of neutron flux calculated with PFNS of ENDF/B-VII.1 (left) and JENDL-4.0 (right) [167]. ... 129
xvi
Figure 7-6. PKA spectra of 56Fe material using neutron flux shown in Figure 7-3.
SPECTRA-PKA calculations based on TENDL-2015. ... 131 Figure 7-7. Accumulated DPA rate versus PKA energy for NRT and ARC models. . 132 Figure 7-8. PKA spectra calculated with (left) and without (right) considering the
correlation matrix of neutron flux spectrum. 5000 LHS TMC calculations. ... 133 Figure 7-9. Relative uncertainties of PKA spectra shown in Figure 7-8. ... 133 Figure 7-10. Correlation matrices of PKA spectra calculated with (left) and without
(right) considering the correlation matrix of neutron flux spectrum. 5000 LHS TMC calculations. ... 134 Figure 7-11. 21-group correlation matrix of n+56Fe damage cross section in [0.1, 20]
MeV from nuclear reaction model parameters. ... 136 Figure 7-12. Relative uncertainty of n+56Fe damage cross section in [0.1, 20] MeV from
nuclear model parameters and DPA models parameters. The histogram plots are performed on the 21-group structure as used for neutron flux. The uncertainties propagated from nuclear model parameters are quasi-identical for the NRT and ARC models so that only the former is shown. The uncertainties propagated from DPA models are used in the following section. ... 137 Figure 7-13. Schemas for propagating DPA model parameters uncertainties to DPA rate:
via damage energy cross section 𝜎𝐷 (left) vs directly via DPA cross section 𝜎𝐷𝑃𝐴 (right). Vector p contains all parameters including Ed, ∆p is the
associated uncertainty vector. ... 140 Figure 7-14. 21-group correlation matrix of n+56Fe NRT-damage cross section in [0.1,
20] MeV from DPA model parameters. ... 141 Figure 7-15. Relative uncertainty of n+56Fe DPA cross section in [0.1, 20] MeV
propagated from DPA models parameters with different relative uncertainties of the TDE. Solid and dotted curves represent the ARC and NRT models, respectively. ... 142 Figure 8-1. Comparison of different damage cross sections based on JEFF-3.3 n+56Fe.
... 150 Figure A-1. Schematic for hard-spheres elastic scattering in the CM frame. ... 152 Figure A-2. Correlation matrices of 235U PFNS from different evaluations:
ENDF/B-VII.1 (left) and JENDL-4.0 (right). ... 153 Figure A-3. Neutron flux in the RPV propagated from 235U PFNS (calculations are
xvii
neutron (i.e. energy in the 235U PFNS), the ordinate is the energy for neutron
propagated to the RPV... 153 Figure A-4. Correlation matrix of n+56Fe damage cross section in [0.1, 20] MeV from
nuclear reaction model parameters. The two clusters in the continuum region correspond to the two humps of uncertainty shown in Figure 7-12. ... 154 Figure A-5. 21-group correlation matrix of n+56Fe damage cross section in [0.1, 20]
MeV from ARC-DPA model parameters. ... 155 Figure A-6. 21-group correlation matrix of n+56Fe DPA cross section in [0.1, 20] MeV
propagated from DPA model parameters by assuming Ed = 41±2 eV: NRT
xviii
List of tables
Table 1-1. Chemical composition of the SA 304L alloy [23]. ... 3
Table 2-1. Resonance parameters of n+56Fe of the resonance centered at 46.0535 keV in JEFF-3.1.1 [28]. ... 9
Table 2-2. Parameters in the Kalbach-Mann systematics [60]. ... 20
Table 3-1. Physical constants [71]. ... 29
Table 3-2. cARC from Konobeyev’s systematics and MD simulations [84]. ... 32
Table 3-3. Parameters for DPA calculation. ... 36
Table 3-4. Resistivity per Frenkel pair (in µΩm) for monatomic materials [88, 95]. .. 44
Table 4-1. Average recoil energy (in eV) of 56Fe for 100 eV, 500 eV, 1 keV, 5 keV, and 10 keV incident neutron elastic scattering with different temperatures. .... 49
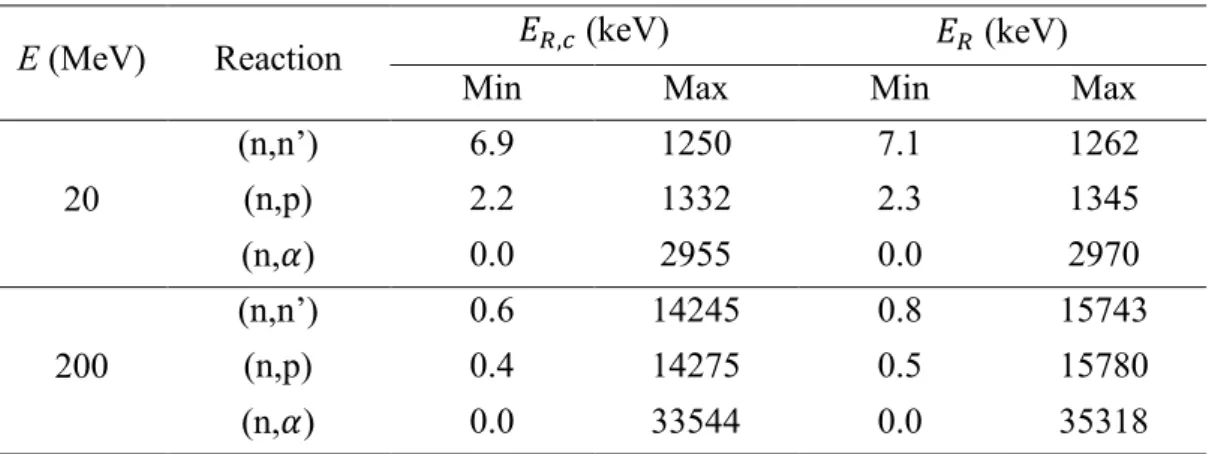
Table 4-2. Recoil energy ranges of 20 MeV and 200 MeV incident neutron with 56Fe target within classic mechanical (ER,c) and relativistic (ER) assumptions. . 55
Table 4-3. Maximum ratio of relativistic quantities to the classical ones. ... 58
Table 4-4. NFP of 56Fe induced by an electron from 56Mn beta decay. ... 84
Table 4-5. NFP of 56Fe induced by the residual nucleus from 56Mn beta decay. ... 87
Table 5-1. Chemical compositions (in wt%) of Fe-14Cr ODS alloy [21]. ... 102
Table 5-2. Threshold atomic displacement energy Ed. ... 102
Table 5-3. SRIM-2013 simulation of 95Sr and 139Xe maximum depths into UO 2 fuel and Fe-14Cr cladding. ... 107
Table 5-4. Average FPs-induced damage rates (DPA/year)a in different intervals. ... 112
Table 6-1. OMP parameters and the corresponding uncertainty (1σ) and correlation matrix for n+56Fe reaction [42]*. ... 116
Table 6-2. Sensitivity of keff to the OMP parameters (pcm/%) for the two benchmarks. ... 121
Table 6-3. Uncertainty (in pcm) concerning keff from the OMP parameters and the correlation between AD and XS deduced from keff. ... 122
Table 6-4. 2000 samples LHS of the OMP parameters given in Table 6-1... 124
Table 7-1. Relative uncertainty of total NRT-DPA rate (and ARC-DPA rate in the last row) propagated from different covariance matrices of 235U PFNS with and without considering the correlation matrix of neutron flux (i.e. Figure 7-5)a. ... 130 Table 7-2. Relative uncertainty of DPA rate from ENDF/B-VII.1 PFNS calculation with
xix
7-5(a)) and the correlation matrices of PKA spectra (i.e. Figure 7-10). .. 135 Table 7-3. Relative uncertainty of total DPA rate from nuclear model parameters with
and without considering the correlations of damage cross section. ... 138 Table 7-4. Relative uncertainty of total damage rate from DPA model parameters with
and without considering the correlations of damage cross section. ... 141 Table 7-5. Relative uncertainty of total DPA rate from DPA model parameters with and
without considering the correlations of damage or DPA cross section. ... 143 Table 7-6. Relative total uncertainty of NRT-DPA rate via 𝜎𝐷 with and without
considering the correlations in the calculations. ... 144 Table 7-7. Relative total uncertainty of ARC-DPA rate with and without considering the
xx
Glossary
AD Angular Distribution
ADC Atomic Displacement Cascade
ARC Athermal Recombination-Corrected (DPA model)
ASTRID Advanced Sodium Technological Reactor for Industrial Demonstration ATF Accident Tolerant Fuel
BCA Binary Collision Approximation CB Chen-Bernard (DPA model) CM Center of Mass
CONRAD COde for Nuclear Reaction Analysis and Data assimilation CS Compton Scattering
CTM Constant Temperature Model DOM Dispersive Optical Model DPA Displacement per Atom DXS Damage Cross Sections
ECIS A nuclear reaction code for optical model calculation ENDF Evaluated Nuclear Data File
ENDF/B AmericanEvaluated Nuclear Data library ENSDF Evaluated Nuclear Structure Data File EPDL Evaluated Photon Data Library
FC Full Cascade simulation (option in SRIM-like code) FCCI Fuel-Cladding Chemical Interaction
FP Frenkel Pair(s)
FPs Fission Products (only in Section 5.4) FR Fast neutron Reactor
GDR Giant Dipole Resonance GLQ Gauss-Legendre Quadrature
GLQPI Gauss-Legendre Quadrature-based Piecewise Integration
JEFF (OECD/NEA) Joint Evaluated Fission and Fusion nuclear data library JENDL Japanese Evaluated Nuclear Data Library
JHR Jules Horowitz Reactor
KFS Konobeyev-Fischer-Simakov (efficiency function) Lab Laboratory
LHS Latin Hypercube Sampling LWRs Light Water Reactors MD Molecular Dynamics
xxi
mNRT modified Norgett-Robinson-Torrens (DPA model) NEA Nuclear Energy Agency
NJOY A nuclear data processing code
NRT Norgett-Robinson-Torrens (DPA model) ODS Oxide Dispersion-Strengthened (alloy) OM Optical Model
OMP Optical Model Potential PE Photoelectric Effect
PENDF Pointwise Evaluated Nuclear Data File PFNS Prompt Fission Neutron Spectra PKA Primary Knock-on Atom
PP Pair Production
PUBI Peak value-based Unit-Base Interpolation PWR Pressurized Water Reactor
RIPL Reference Input Parameter Library RPV Reactor Pressure Vessel
QC Quick Calculation (option in SRIM-like code) RML R-Matrix Limited (format)
RRR Resolved Resonance Region SA Solution Annealed
SFR Sodium-cooled Fast neutron Reactor SM Statistical Model
SRIM A stochastic binary collision approximation code TALYS A nuclear reaction code
TDE Threshold Displacement Energy
TENDL TALYS-based Evaluated Nuclear Data Library TMC Total Monte Carlo
UBI Unit-Base Interpolation
URR Unresolved Resonance Region XS Cross Section
1
1 Introduction
1.1 Nuclear power
Because it is reliable, stable, and environmentally sustainable, nuclear power is one of the most important forms of decarbonized energy for reducing CO2 emissions. Figure
1-1 shows the percentages of different sources of world electricity production in 2017 (25, 721 TWh) [1]. Currently, nuclear power accounts for approximately 10% of the total world electricity production. Figure 1-2 presents the percentages of different forms of primary energy supply by fuel in 2017 (162,483 TWh) [2]. Nuclear power consists of about 5% of the total primary energy supply. Nuclear energy is thus one of the most important energy resources for reducing global pollution and global warming without restraining the industrial development.
Figure 1-1. Sources of world electricity production in 2017 [1].
2
Nuclear power is a good choice for the moment. However, current nuclear energy is not so economically competitive owing to the huge cost of building a nuclear power plant. One of the main reasons of the expensive building cost is due to the construction of extensive safety systems other than the three safety barriers (i.e. the fuel cladding, the envelope of the primary system (i.e. Reactor Pressure Vessel (RPV) and primary tubes), and the primary concrete containment). Since the strict requirements of safety systems are necessary for nuclear power plants, one strategy to improve the economic competitiveness of nuclear power is to produce more energy as possible for each reactor, such as the prolongation of the operating lifetime of nuclear reactors and the extension of fuel cycle length (thus reduction of the total time for refueling).
For current Gen II and Gen III commercial Light Water Reactors (LWRs), the recent development of Accident Tolerant Fuel (ATF) after the 2011 Fukushima Daiichi nuclear accident provides opportunities to improve the economic competition. For example, the use of high uranium density fuel can prolong the fuel cycle length [3–8]. The enhanced fuel cladding materials [5, 9–15] improve the mechanical strength of fuel rod, this may also allow prolonging the fuel cycle length with respect to the materials challenge. In addition, owing to their larger thermal neutron absorption cross sections than that of the current zircaloy [16], the enhanced ATF claddings may also reduce the neutron irradiation damage of RPV, so that the operating lifetime of LWRs could be prolonged (needs quantitative analyses).
For Gen IV Sodium-cooled Fast neutron Reactors (SFRs), the irradiation damage of the reactor vessel is not so important because the neutron irradiation of the vessel is much reduced by the shielding of fertile layer, reflector, and a large volume of sodium (and in-vessel neutron shielding in ASTRID [17]) between the inner core and the vessel. However, the lifetime of a fuel assembly (or the cycle length) mainly depends on the total irradiation damage of the fuel cladding. The critical measurement of irradiation damage of the cladding is the accumulated number of Displacement per Atom (DPA) [18, 19], which is a conventional quantity for quantifying the primary radiation damage [20]. The advanced Oxide Dispersion Strengthened (ODS) alloys [21] allow a long fuel lifetime for SFRs.
1.2 Irradiation damage of materials
The irradiation damage is one of the most important challenges for both LWRs and Fast neutron Reactors (FRs). The designed operating lifetime of an LWR and its possible prolongation is mainly based on the irradiation damage of the RPV. The neutron irradiation damage of cladding is also the main characteristic to determine the lifetime of the fuel assembly in SFRs. Here, we briefly explain why the irradiation damage is important for nuclear materials and the objectives of this thesis.
3
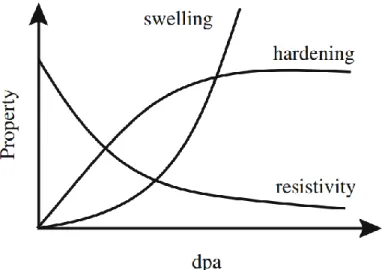
Figure 1-3 shows the typical stress-strain curves for the Solution Annealed (SA) 304L alloy irradiated in OSIRIS experimental reactor (CEA/Saclay) [22]. The chemical composition of the SA 304L steel is given in Table 1-1 [22]. It shows that the neutron irradiation damage obviously changes the characteristics of materials. In addition to the change of the stress-strain curve (including the yield stress and the rupture point) shown in Figure 1-3, radiation damage also leads to the swelling and hardening of materials [23]. A qualitative description of the irradiation dose-dependence of the swelling, hardening, and resistivity is illustrated in Figure 1-4 [23]. Due to the change of properties for irradiated materials, it is of great importance to accurately quantify the irradiation damage of materials for ensuring the operation and satisfying the safety criteria of nuclear reactors.
Figure 1-3. Stress-strain curves at 330 °C for the SA 304L alloy after different neutron irradiation doses (in DPA) (taken from Ref. [22, 24]).
Table 1-1. Chemical composition of the SA 304L alloy [22].
Element C S P Si Mn Ni Cr Cu Co N wt% 0.022 0.007 0.032 0.36 1.79 9.86 18.16 0.25 0.064 0.061
Current experimental investigations on the irradiation effect of materials are mostly based on the ion or electron irradiation experiments. Because neutron and charged particles have different features, the emulation of neutron irradiation damage with charged particle-induced damage needs to be studied. DPA is a common quantity that intends to unify the irradiation damage induced by different particles, including neutron, light or heavy ions, electron, and photon.
4
Figure 1-4. Qualitative plot of the dependence of swelling, resistivity, and hardening on irradiation damage (taken from Ref. [23]).
Nevertheless, even though the DPA is conventionally used to quantify the irradiation damage, the methods for calculating the number of DPA varies in different studies, or in a systematic study with different irradiation sources, such as proton and neutron shown in Ref. [25]. Consequently, a more detailed and rigor standard should be proposed to calculate the number of DPA from different irradiation sources, especially for polyatomic materials. A simple proposal is given in Section 4.7.
Nowadays, the so-called DPA can refer to the number of survived Frenkel pairs per atom, the total number of atomic displacements (excluding replacements) per atom, and the equivalent fast neutron dose (neutron energy > 0.1, > 0.5, or > 1 MeV depending on different researches). The second one is currently the standard for industrial applications and nuclear regulation. The first one is somewhat more realistic because it exactly counts the final point defects in irradiated materials. The last one is much further from the concept of DPA but it is still widely used. The main reason is that the current experimental measurement of neutron irradiation damage in reactors is only the measurement of neutron fluence (time-accumulated neutron flux) above a threshold energy (depending on dosimeter), e.g. 0.5 MeV or 1 MeV.
Because of the aforementioned problems for calculating the DPA, detailed methods are required for more accurate calculation of DPA. On the other hand, as previously explained that safety is one of the most important characteristics for nuclear reactor. Figure 1-5 illustrates the example of different margins for nuclear fuel. Similarly, an unique value of DPA without uncertainty is not enough for design, operation, and nuclear regulation. Therefore, in addition to the calculation of DPA, the present work also includes the uncertainty estimates of DPA by propagating the uncertainties of different domains, including nuclear data, DPA models, and neutronic calculations.
5
Figure 1-5. Schematic of safety margins (taken from Ref. [26]).
1.3 Objectives of this thesis
This thesis focuses on the proposition and investigation of methodologies for accurate calculation of DPA and the corresponding uncertainty for irradiated materials. The objectives include revisiting the models and methods for computing DPA from nuclear reactions. Then, the improvement of models and computation methodologies is proposed and studied. Our studies cover neutron-induced recoil energy, the subsequent damage cross section, damage rate calculation, and uncertainty quantification of DPA rate. In addition to neutron irradiation, other irradiation sources, such as electron, positron, photon, beta decay, and fission products for fuel cladding, are also considered. We intend to provide a complete schema and state potential problems for DPA calculation.
Some numerical results shown in this thesis are only examples of applications for specific cases, these results are not necessarily general for all cases. However, the methodologies presented in this thesis are applicable for any specific study. Using the same methodologies, one could obtain similar conclusions for most cases.
6
1.4 Overview of this thesis
The main structure of this thesis is ordered from micro to macro: Section 2 Nuclear reaction models and nuclear data (nuclear level), Section 3 Primary radiation damage models (atomic level), Section 4 Calculation of damage cross sections (from nuclear level to atomic level), Section 5 Calculation of DPA rates (applicable quantity for industrial needs), Section 6 Methods for uncertainty propagation (uncertainty estimates), Section 7 Uncertainty assessment of damage rate in a PWR vessel (a simplified example for industrial application), and Conclusions and prospects.
I would like to indicate that Sections 2, 3, and 6 are mainly the reviews of the current methods with some examples calculated in the present work for helping the understanding. The new contributions to the methodologies presented in these sections are: Section 2.5.2 on the interpolation of energy-angular distributions given in an Evaluated Nuclear Data File (ENDF), Section 3.6 describing a simple function for calculating the athermal recombination-corrected DPA, and Section 3.7.2 proposing the concept of residual energy transfer for analytically calculating the number of atomic displacements within binary collision approximation.
Section 4 presents the methodologies for computing the irradiation damage cross section for different reaction types. The methods (except basic knowledge such as two-body kinematics and the method already proposed in Ref. [27]) are originally proposed and/or verified in the present work. Works summarized in Section 5 are the originally proposed in this Ph.D thesis, certainly excluding some commonly known methods, such as the calculation of reaction rate. Section 7 shows the examples for uncertainty estimates in the RPV of a simplified Pressurized Water Reactor (PWR) mock-up using the methods presented in the above sections. Section 8 includes the main conclusion of this Ph.D thesis and the potential prospects for completing this work.
Owing to the numerous theories and definitions presented in this thesis, some symbols are redefined in different sections, especially in Sections 2 and 3. It is also possible that some quantities are expressed by different symbols according to different conventions in different disciplines. For readers, we keep in mind different theories (and the reasonings in several cases if necessary) and do not memorize the significance of each symbol.
7
2 Nuclear reaction models and nuclear data
Because most of the atomic displacements in nuclear reactors are initialized by nuclear reactions, this section briefly summarizes the nuclear reaction models used to compute damage cross sections. Figure 2-1 illustrates the total cross section of 56Fe in
JEFF-3.1.1 [28]. In the Resolved Resonance Region (RRR), the theoretical model is the R-matrix theory, which is presented in Section 2.1. In the high-energy region, owing to the lack of experimental resolution of resonance and the contribution of direct and/or pre-equilibrium reactions, the R-matrix is no longer pertinent. This region is called the continuum region, where the optical model for total cross section, potential elastic scattering cross section (c.f. Section 2.2) and the statistical model for nuclear reactions cross sections (c.f. Section 2.3) are applicable.
Figure 2-1. Total cross section of 56Fe (JEFF-3.1.1).
In addition to nuclear cross sections, angular distribution and energy-angular distribution are necessary for computing radiation damage. Section 2.4 briefly shows the theory for calculating angular distribution. The calculation and conventional form of energy-angular distribution are presented in Section 2.5. Because of numerous parameters and symbols in nuclear models, some symbols may be redefined in some subsections. The redefinition of such symbols and their physical significance does not change the understanding of nuclear models in the corresponding subsections.
2.1 R-matrix theory
In the compound nucleus model (the time scale of compound nucleus reactions is of the order of 10−18 s - 10−15 s), the cross section from entrance channel c to exit
8 𝜎𝑐𝑐′(𝐸) = 𝜋 𝑘𝛼2𝑔𝑐|𝑒 2𝑖𝑤𝐶𝛿 𝑐𝑐′ − 𝑈𝑐𝑐′| 2 𝛿𝐽𝐽′ (2-1)
where 𝛼 represents the two particles making up the channel (𝑐 = (𝛼, 𝑙, 𝑠, 𝐽 )), 𝑘𝛼 = 𝐾𝛼/ℏ where 𝐾𝛼 is the momentum (𝐾𝛼2 =
2𝑚𝑀2
(𝑚+𝑀)2𝐸) in the Center-of-Mass (CM) system,
𝑤𝐶 is the Coulomb phase shift (zero for non-Coulomb channels), 𝑔𝑐 is the statistical spin factor:
𝑔𝑐 = 2𝐽+1
(2𝑖+1)(2𝐼+1) (2-2)
where i and I are the spins of the incident particle and the target, respectively. U is the scattering matrix, which can be expressed by:
𝑈𝑐𝑐′ = Ω𝑐𝑊𝑐𝑐′Ω𝑐′ (2-3)
where Ω𝑐 = 𝑒𝑖(𝑤𝐶−𝜑𝑐) with 𝜑
𝑐 being the potential scattering phase shift deduced from
the Schrödinger equation. W is a matrix which can be calculated by:
𝑊 = 𝑃1/2(𝟏 − 𝑅𝐿)−1(𝟏 − 𝑅𝐿∗)𝑃−1/2 (2-4)
where 1 represents the identity matrix and
𝐿 = (𝑆 − 𝐵) + 𝑖𝑃 (2-5)
where P and S are respectively the penetration factor and the shift factor deduced from the Schrödinger equation, B is the wave function boundary condition at the channel limit (i.e. channel radius) ac. The elements of R-matrix are expressed as [29]:
𝑅𝑐𝑐′(𝐸) = ∑
𝛾𝜆𝑐𝛾𝜆𝑐′ 𝐸𝜆−𝐸
𝜆 (2-6)
where λ labels the discrete compound nucleus states, 𝐸𝜆 is the energy eigenvalue of state λ, 𝛾𝜆𝑐 is the “reduced width amplitude” for state λ and channel c calculated by the width Γ𝜆𝑐 and the penetration factor 𝑃𝑐:
Γ𝜆𝑐 = 2𝑃𝑐𝛾𝜆𝑐2 (2-7)
Because the elements of the R-matrix describe the “internal” interaction in a nucleus, it is difficult (impossible for the time-being) to determine the elements Rcc’.
Therefore, some simplified calculable R-matrix models are developed for the evaluation process. In current nuclear data libraries, the single-level/multilevel Breit-Wigner formula [31] and the Reich-Moore model [32] are widely used. It is noted that the inelastic scattering channels are not included in the current Reich-Moore format in ENDF. The calculation of inelastic scattering in the resonance region requires additional parameters stored in the recently proposed R-matrix Limited (RML) format. The resonance parameters are given in file 2 (conventionally called MF2) in ENDF-6 format.
9
parameters, Figure 2-2 illustrates the example of neutron elastic scattering cross section of 56Fe around 46 keV with perturbed parameters with the CONRAD code [33]. The
parameters from JEFF-3.1.1 are given in Table 2-1 [28]. The eigenvalue 𝐸𝜆 determines the energy peak of the resonance. The widths Γ𝛾 and Γ𝑛 implicitly influence both the width and the peak value of the resonance.
Table 2-1. Resonance parameters of n+56Fe of the resonance centered at 46.0535 keV in JEFF-3.1.1 [28].
Parameter Model 𝐸𝜆 (keV) Γ𝛾 (meV) Γ𝑛 (meV) 𝐽𝜋
Value Reich-Moore 46.0535 265.125 5140 3/2−
Figure 2-2. Neutron elastic scattering cross section of 56Fe with perturbed parameters (calculated by CONRAD) [34].
2.2 Optical model
The R-matrix theory is the phenomenological model in the RRR and Unresolved Resonance Region (URR) when averaging over multiple compound states, but it is not applicable in the continuum region due to the lack of experimental resolution of resonance and because reactions are direct or pre-equilibrium. In the high-energy region, the Optical Model (OM) is usually used to calculate the total and shape elastic scattering cross sections. In the OM, one solves the Schrödinger equation by giving a potential, of which a usually used form is [35]:
𝒰(𝑟, 𝐸) = −𝒱𝑉(𝑟, 𝐸) − 𝑖𝒲𝑉(𝑟, 𝐸) − 𝑖𝒲𝑆(𝑟, 𝐸) +
10
where E is the energy of the incident particle, r is the distance between the incident particle and the target nucleus. The subscript V, S, SO, and C respectively represent the Volume, Surface, Spin-Orbit, and Coulomb terms. 𝒱𝑖 and 𝒲𝑖 are the real and imaginary components of the potential for the term 𝑖 = 𝑉, 𝑆, 𝑆𝑂, 𝐶. 𝒍 and 𝝈 are the orbital angular momentum vector and Pauli matrices vector, respectively.
In general, the position-dependence and the energy-dependence are separated into two individual functions:
𝒳𝑖(𝑟, 𝐸) = 𝑋𝑖(𝐸)𝑓𝑖(𝑟) (2-9)
where 𝒳 = 𝒱, 𝒲 and 𝑖 = 𝑉, 𝑆, 𝑆𝑂, 𝑋𝑖 is the position-independent potential. The most
widely used position-dependent functions are 𝑓𝑉(𝑟) = 𝑓(𝑟, 𝑅𝑉, 𝑎𝑉) if 𝑖 = 𝑉 and 𝑓𝑖(𝑟) = 𝑔(𝑟, 𝑅𝑖, 𝑎𝑖) if 𝑖 = 𝑆, 𝑆𝑂 where f is a Woods-Saxon form [36] and g is
proportional to the differential of f:
𝑓(𝑟, 𝑅𝑖, 𝑎𝑖) = 1
1+exp [(𝑟−𝑅𝑖)/𝑎𝑖] (2-10)
𝑔(𝑟, 𝑅𝑖, 𝑎𝑖) = −4𝑎𝑖 𝑑
𝑑𝑟𝑓(𝑟, 𝑅𝑖, 𝑎𝑖) (2-11)
Morillon and Romain proposed a potential based on the Dispersive Optical Model (DOM) for neutrons with incident energies from 1 keV to 200 MeV as [37]:
𝒰(𝑟, 𝐸) = [𝑉𝑉(𝐸) + 𝑖𝑊𝑉(𝐸)]𝑓(𝑟, 𝑅, 𝑎) + [𝑉𝑆(𝐸) + 𝑖𝑊𝑆(𝐸)]𝑔(𝑟, 𝑅, 𝑎) +[𝑉𝑆𝑂(𝐸) + 𝑖𝑊𝑆𝑂(𝐸)]1 𝑟( ℎ 𝑚𝜋𝑐) 2 𝑔(𝑟, 𝑅, 𝑎)𝒍 ∙ 𝝈 (2-12)
In the DOM, the causality (a scattered wave cannot be emitted before the arrival of the incident wave) implies that the real part and imaginary part are connected by a dispersion term [38]: ∆𝑉(𝐸) =𝑃 𝜋∫ 𝑊(𝐸′) 𝐸′−𝐸 𝑑𝐸 ′ +∞ −∞ (2-13)
where P is the Cauchy principal value of the integral.
In the Morillon-Romain potential, the shape functions f and g are the same for different interactions, whereas different parameters are used for different parts in general OM potentials such as Koning-Delaroche [35]. Morillon and Romain obtained the systematics for the radius R and the diffuseness a for most spherical nuclei as [37]: 𝑅 = (1.295 − 2.7 × 10⁻⁴𝐴)𝐴1/3 (fm) (2-14)
𝑎 = 0.566 + 5 × 10⁻⁹𝐴3 (fm) (2-15) where A is the mass number of the nucleus. It is noted that the best-fitted radius R is different from the systematics for light nuclei, such as 𝑅 = 1.268𝐴1/3 fm for 56Fe [37].
Compared with the Koning-Delaroche OM Potential [35] (OMP), that of Morillon-Romain has less geometrical parameters and a better description of cross sections.
11
However, the angular distribution of elastic scattering calculated with the DOM agrees generally less with the experimental data than that of Koning-Delaroche, including for
56Fe [37].
For a deformed nucleus, the prior value for the radius R in the Woods-Saxon form is given by [39]:
𝑅 = (1.295 − 2.7 × 10⁻⁴𝐴)𝐴1/3[1 + 𝛽2𝑌20(Ω) + 𝛽4𝑌40(Ω)] (fm) (2-16)
where 𝛽2 and 𝛽4 are quadrupole and hexadecapole deformation parameters, respectively. 𝑌20(Ω) and 𝑌40(Ω) are the corresponding spherical harmonics as a function of the body-fixed system Ω. In principle, if it is necessary, one can consider 𝑌60(Ω), 𝑌80(Ω), etc. and the corresponding deformation parameters.
All optimized prior parameters in the OMPs can be found in the Reference Input Parameter Library (RIPL) [40]. With a given OMP, ECIS [41] performs the optical calculations by solving the Schrödinger equation and the subsequent calculations using the wave functions. ECIS calculations provide cross sections and angular distributions for the shape elastic scattering (i.e. direct reaction) that is directly used in damage cross section calculations. Moreover, the optical calculation gives the neutron transmission coefficients that are mandatory for calculating other partial reactions.
Figure 2-3. Total cross section of 56Fe from ECIS calculation with optimized parameters [42].
Figure 2-3 shows the example of the total cross section on 56Fe from ECIS
calculation with optimized parameters in comparison with experimental data from EXFOR [43]. The OM calculations with optimized parameters are validated against experimental data in the high-energy region, where the cross section varies smoothly with neutron energy. However, the fluctuations below 5 MeV cannot be calculated with the OM. Moreover, it is hard to produce such fluctuations with the R-matrix formalism
12
because the forms generally do not correspond to resonances or interferences. The extension of the resonance parameters up to 2 MeV for 56Fe is ongoing in our laboratory
[44, 45], whereas the R-matrix is only limited below 850 keV in the current JEFF evaluations. Nevertheless, the model defects for predicting the fluctuation of cross section above the limit of R-matrix but below the OM region should be further investigated in future.
2.3 Statistical model
For the calculation of nuclear reactions cross sections, the Statistical Model (SM) is widely used. In the SM, the neutron cross sections are given by the Hauser-Feshbach formula [46]:
𝜎𝑐𝑐′ = 𝜋𝜆̃𝑐2𝑔𝑐𝑇𝑐𝑇𝑐′
∑ 𝑇𝑖 𝑖𝑊𝑐𝑐′ (2-17)
where Ti represents the average transmission coefficient of the reaction channel i, and
𝜆̃𝑐 = 𝜆𝑐/2𝜋 is the reduced De Broglie wavelength of the incident particle. Wcc’ is the
width fluctuation correction factor between the entrance channel c and the exit channel
c’ (see also Refs. [47–49] for more details). Numerical comparisons between different
approaches of Wcc’ can be found in Ref. [49].
In the Hauser-Feshbach formula, the neutron transmission coefficient Tn is
calculated by using the OM in ECIS [41]. The transmission coefficients for other channels can be directly calculated by TALYS with a specific model. For example, the gamma-ray transmission coefficient Tγ for multipolarity ℓ of type X (where X = M or E
represent the magnetic or electric transition) can be calculated by:
𝑇𝑋ℓ = 2𝜋𝑓𝑋ℓ(𝐸𝛾)𝐸𝛾𝑋ℓ (2-18)
where 𝐸𝛾 denotes the γ energy and 𝑓𝑋ℓ is the energy-dependent γ ray strength function, which is given by Kopecky and Uhl [50].
The generalized Lorentzian form is proposed for E1: 𝑓𝐸1(𝐸𝛾) = 𝐾𝐸1[ 𝐸𝛾Γ̃𝐸1(𝐸𝛾) (𝐸𝛾2−𝐸𝐸12 ) 2 +𝐸𝛾2Γ̃𝐸12 (𝐸𝛾) +0.7Γ𝐸14𝜋2𝑇2 𝐸𝐸13 ] 𝜎𝐸1Γ𝐸1 (2-19)
The Giant Dipole Resonance (GDR) shape given by Brink and Axel [51, 52] is suggested for M1 and E2 radiation transition [50]:
𝑓𝑋ℓ(𝐸𝛾) = 𝐾𝑋ℓ 𝜎𝑋ℓ𝐸𝛾Γ𝑋ℓ2 (𝐸𝛾2−𝐸𝑋ℓ2 )
2 +𝐸𝛾2Γ𝑋ℓ2
(2-20)
The common coefficient in the above two forms of 𝑓𝑋ℓ is: 𝐾𝑋ℓ = 1
13
The energy-dependent damping width Γ̃𝐸1(𝐸𝛾) and the nuclear “temperature” T are
given by:
Γ̃𝐸1(𝐸𝛾) = Γ𝐸1𝐸𝛾2+4𝜋2𝑇2
𝐸𝐸12 (2-22)
𝑇 = √𝐸𝑛−𝑆𝑛−Δ−𝐸𝛾
𝑎(𝑆𝑛) (2-23)
where Sn is the neutron separation energy, En is the incident neutron energy, ∆ is the
pairing energy, and a is the level density parameter at Sn.
The normalized gamma-ray transmission coefficient is given by: 𝑇𝛾 =2𝜋Γ𝛾
𝐷0 (2-24)
The Gilbert-Cameron formula [53] is widely used for computing the s-wave neutron average level spacing D0 and other levels. In the Gilbert-Cameron formula, the Constant
Temperature Model (CTM) is used to describe the cumulated excited level below Sn (Z,
N+1):
𝑁(𝐸) = exp (𝐸−𝐸0
𝑇 ) (2-25)
Hence, the excited level density can be obtained as: 𝜌(𝐸) =𝑑𝑁(𝐸) 𝑑𝐸 = 1 𝑇exp ( 𝐸−𝐸0 𝑇 ) (2-26)
At high energy, the Fermi gas model [54] is used to describe the level density.
For statistical model calculations in the continuum region, the TALYS code [55] is widely used and was coupled into CONRAD [33]. It is notable that the OM code ECIS was also included in TALYS, so that both the OM calculations and the SM calculations can be performed with TALYS.
For calculating damage cross sections, since TALYS calculates the spectra of recoil nuclei from two-body kinematics, CONRAD provides the option for the damage calculation directly using the spectra computed by TALYS [34]. This option can reduce the computation time for total or partially total damage cross sections but is only available in the fast energy region for compound reactions. For scattering reaction, we combine the damage cross section computed with the recoil spectrum of TALYS and that computed with kinematics and angular distribution of the shape elastic scattering from ECIS calculation. However, it should be noted that the azimuthal angle and relativistic kinematics are not yet considered for computing recoil spectra in TALYS [55]. More details on the damage cross section calculation are with CONRAD are published in Refs. [34, 56].
Figure 2-4 shows the elastic and inelastic neutron scattering cross sections on 56Fe
14
data from EXFOR [43]. Elastic scattering includes the shape elastic scattering determined by OM calculations from ECIS and the nuclear reaction-induced elastic scattering from TALYS calculations. Both elastic scattering and inelastic scattering reactions use the incident neutron transmission coefficient Tn from OM calculations.
Similar to the OM, the SM with optimized parameters corresponds well with experimental data in the high-energy region but it cannot describe the fluctuations below 5 MeV.
Figure 2-4. Elastic (upper) and inelastic (lower) neutron scattering cross sections of 56Fe from TALYS calculation with optimized parameters [42].
![Figure 2-3. Total cross section of 56 Fe from ECIS calculation with optimized parameters [42]](https://thumb-eu.123doks.com/thumbv2/123doknet/12858946.368435/35.892.230.655.594.917/figure-total-cross-section-ecis-calculation-optimized-parameters.webp)
![Figure 3-2. Experimental data of the average number of displacements with respect to PKA energy in Cu [69]](https://thumb-eu.123doks.com/thumbv2/123doknet/12858946.368435/50.892.232.596.274.606/figure-experimental-data-average-number-displacements-respect-energy.webp)
![Figure 3-3. Probability of stable atomic displacement versus recoil energy [23]. The dashed curve represents the step function approximation](https://thumb-eu.123doks.com/thumbv2/123doknet/12858946.368435/51.892.237.661.111.338/figure-probability-stable-atomic-displacement-represents-function-approximation.webp)