HAL Id: hal-02083870
https://hal.archives-ouvertes.fr/hal-02083870
Submitted on 29 Mar 2019
HAL is a multi-disciplinary open access archive for the deposit and dissemination of sci-entific research documents, whether they are pub-lished or not. The documents may come from teaching and research institutions in France or abroad, or from public or private research centers.
L’archive ouverte pluridisciplinaire HAL, est destinée au dépôt et à la diffusion de documents scientifiques de niveau recherche, publiés ou non, émanant des établissements d’enseignement et de recherche français ou étrangers, des laboratoires publics ou privés.
Analysis of Shot Peening Blast by Particle Tracking and
Digital Image Correlation
Régis Kubler, René Rotinat, Jawad Badreddine, Quentin Puydt
To cite this version:
Régis Kubler, René Rotinat, Jawad Badreddine, Quentin Puydt. Analysis of Shot Peening Blast by Particle Tracking and Digital Image Correlation. International Conference on Shot Peening, Sep 2017, Montreal, Canada. pp.166-171. �hal-02083870�
This is an author-deposited version published in: https://sam.ensam.eu Handle ID: .http://hdl.handle.net/null
To cite this version :
Régis KUBLER, René ROTINAT, Jawad BADREDDINE, Quentin PUYDT - Analysis of Shot Peening Blast by Particle Tracking and Digital Image Correlation - In: International Conference on Shot Peening, Canada, 2017-09 - ICSP13 - 2017
Analysis of shot peening blast by particle tracking and digital image correlation
Kubler R. a, Rotinat R. a, Badreddine J. b, Puydt Q. c
a MSMP laboratory, Arts et Métiers ParisTech, France, [email protected], [email protected]; b SAFRAN TECH, France, [email protected]; c IRT M2P, France, [email protected]
Keywords: shot peening, high speed camera, particle tracking, DIC, process control Introduction and objectives
Shot peening process is generally controlled by Almen intensity and coverage rate measurements. The results of the shot peening surface treatment depend on the process parameters (type of machine, nozzle, shot type, mass flow, velocity, impact angle) and on the properties of the treated parts (material behaviour, roughness). Previous studies have investigated the control of shot peening via measurement of the global flow characteristics [1, 2, 3]. Developing experimental methods to characterize a particle flux is useful to obtain the contact conditions of the shot peening process (location, velocity vector) on any interesting geometry. Using a high speed camera, this study aims at the analysis of the flux of shots ahead of the nozzle of a shot peening machine. In this study two set of process parameters are investigated:
S1: P= 1 bar, D=3 kg/min S2: P= 1 bar, D=13 kg/min
Quantitative evolution of the particle velocity and density in the flux is studied. Methodology
Experimental set-up for high speed acquisition
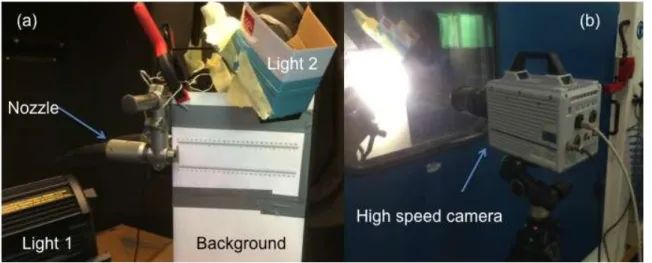
The shot peening machine used is a Wheelabrator cabine installed at IRT M2P laboratory. Figure 1 shows the experimental set-up used for the high speed video acquisitions. One linear nozzle with a 10 mm diameter is used. The shot peening process is controlled by the air pressure P (bars) and the flow rate of shots D (kg/min). S230 steel shots are used.
The lighting of the scene is set inside the cabine with a cold DECOOL projector positioned behind the nozzle and a LED projector at the top of the particle flux (Fig. 1a). A high speed Photron SA5 camera is positioned outside the peening cabine in front of the window using a 28x105 mm lens. To obtain a good contrast, a white paper background is fixed behind the particle flux. No surface has been positioned in front of the nozzle to avoid the observation of shot beads after bouncing.
For each process parameters acquisitions are carried out in two zones, 0 to 120 mm (zone 1) and 120 to 140 mm (zone 3) ahead of the nozzle exit. Image acquisitions are triggered when the pressure control and mass flow rate sensors are stabilized.
The software Photron Fastcam Viewer is used for high speed image acquisition. The image size is 896x704 pixels, the acquisition speed is 12 000 frames/s with a shutter time of 1/69000 s. An average duration of 0.3 second is captured.
Figures 2 and 3 show respectively instant images of the particles flux between 0 and 120 mm (zone 1) ahead of the nozzle and between 120 and 240 mm (zone 3) for the process parameters S1 and S2. The flux appears denser when the mass flow rate is higher. In Figures 2 and 3, X and Y represent respectively the horizontal and vertical directions. Since 2D images are obtained, all the particles including the ones out of the focal plane are observed. No treatment has been applied to distinguish the particle according to their position in Z direction.
3.1 Shot peening - performance 3 PROCEEDINGS
Figure 1 : Experimental set-up. (a) Lightning and background (b) High speed camera positioned outside of the shot peening machine.
Figure 2 : High speed image acquisition in zone 1 (0 to 120 mm ahead of the nozzle) with different process parameters: left: S1- P=1 bar, D=3 kg/min; right: S2- P=1 bar, D=13kg/min.
Figure 3 : High speed image acquisition in zone 3 (120 to 240 mm ahead of the nozzle) with different process parameters: left: S1- P=1 bar, D=3 kg/min; right: S2- P=1 bar, D=13kg/min.
2D Velocity analysis using particle tracking and DIC technique
A set of 400 consecutive images is analysed for each zone and set of process parameters. Automated particle tracking using the Trackmate plugin [4] available in FIJI software is performed. A black and white local image adjustment is applied to the image sequence. The tracks of the particles are filtered in order to remove spurious tracks (Figure 4). The velocities of representative individual particles are output versus time. After particle tracking, the presented data are averaged over an area in X and Y directions. Particle count is also obtained.
Digital image correlation (DIC) analysis are carried out using Vic2D [5]. The motion of a subset (71x71 pixels) of several particles is tracked on consecutive images. Figure 5 gives a representation of the displacement field that can be obtained from the DIC post-treatment of the high speed images. Results and analysis
Analysis are performed with the two shot peening conditions (S1: P= 1 bar, D=3 kg/min, S2: P= 1 bar, D=13 kg/min) for particle tracking. For DIC, the parameters are P= 1 bar, D=8 kg/min. Velocity measurements
Figure 6 shows the velocity measurements ahead of the nozzle on a distance of 120 mm in zone 1 for the two sets of parameters. It can be observed that the higher the flow rate, the lower the
Figure 4 : Particle detection and tracking to determine the 2D velocity vector using TrackMate plugin [4] in FIJI software.
Figure 5 : DIC measurements of the displacement of a set of particles in motion (P=1 bar, D=8 kg/min).
3.1 Shot peening - performance 3 PROCEEDINGS
Figure 6 : Velocity measurements (particle tracking) in direction X and Y in a zone from 0 to 120 mm ahead of the nozzle for process parameters S1: P= 1 bar, D=3 kg/min; S2: P= 1 bar, D=13 kg/min.
Figure 7: Velocity measurements (particle tracking) in direction X and Y in a zone from 120 to 240 mm ahead of the nozzle for process parameters S1: P= 1 bar, D=3 kg/min; S2: P= 1 bar, D=13 kg/min.
average velocity of the particles in direction X (Vx). The velocity Vx is higher in the centre of the blast and an acceleration of the particles is measured from the output of the nozzle to a distance of 120 mm. In figure 7, the velocities from 120 mm to 240 mm (zone 3) ahead of the nozzle is shown. The acceleration in the centre of the flow to a velocity of 40 m/s compared to the output velocity of 25 m/s (process parameters S1).
Figure 8 shows the velocity magnitude (𝑉 = √𝑉𝑥2+ 𝑉𝑦2) obtained using DIC technique over two
consecutive images with the conditions P= 1 bar, D= 8 kg/min. This result is in good agreement with data obtained by particle tracking.
Figure 8 : DIC measurement of velocity magnitude (mm/s) for conditions P=1 bar, D=8 kg/min. X and Y axis in pixels.
Figure 9 : Particle density measurements (particle) in zones 1 and 3 ahead of the nozzle for process parameters S1: P= 1 bar,
D=3 kg/min; S2: P= 3 bars, D=13 kg/min. Duration: 1/30 s. Average over a section of 5mm2.
3.1 Shot peening - performance 3 PROCEEDINGS
Density measurements
The information of the particles detected by the particle tracking method is also used to count them over a duration of 1/30 s. Figure 9 shows the density of particles in zones 1 and 3 for process parameters S1 and S2. The density takes into account the particles that are out of the focal plane (direction z). This information about density can be linked to the strike density of the particles on a surface (linked to the coverage rate).
Conclusions
Particle velocities and distribution in a shot peening blast ahead of a nozzle have been measured using high speed camera image acquisitions. Each single particle can be tracked in order to observe its flow using automated particle tracking. DIC has also the ability to obtain the average velocity of a subset of particles.
In this study, since 2D images have been obtained, a statistical post-treatment has to be carried out on the presented data. 3D measurements with an additional synchronized high speed camera would give additional information.
Those techniques and the obtained data will be used to understand the interaction between the flow of particles and a complex surface to investigate the effect of the shot peening process.
Acknowledgments
We wish to thank all the partners of CONDOR project lead by IRT-M2P for their cooperation. References
[1] Barker B, Young, K., Pouliot, L., Particle velocity sensor for improving shot peening process control, Proceedings of ICSP9, 385-391.
[2] Wustefeld F., Linnemann, W., Kittel, S., Friese, A., On-line process control for shot peening applications, Proceedings of ICSP9, 366-372.
[3] Haubold, T., Hennig, W., Wustefeld F., Kittel, S., Friese, A., Implementing on-line process control for shot peening, Proceedings of ICSP9, 360-365.
[4] Tinevez, J.Y., Perry, N. & Schindelin, J. et al. (2016), TrackMate: An open and extensible platform for single-particle tracking, Methods 115: 80-90.