1
Validation of an automatic reference region extraction for the
quantification of [
18F]DPA-714 in dynamic brain PET studies.
Daniel García-Lorenzo*1,Sonia Lavisse*2,3, Claire Leroy4,5, Catriona Wimberley4,5,
Benedetta Bodini1, Philippe Remy2,3,7, Mattia Veronese6, Federico Turkheimer6, Bruno
Stankoff*1,8 and Michel Bottaender*4,5,9.
Running headline
Cluster analysis in [18F]-DPA714 brain PET studies
1 Sorbonne Université, UPMC Paris 06, Institut du Cerveau et de la Moelle épinière, ICM, Hôpital de la Pitié Salpêtrière, Inserm UMR S 1127, CNRS UMR 7225, Paris, France
2Commissariat à l’Energie Atomique et aux Energies Alternatives (CEA), Département de Recherche Fondamentale (DRF), Institut d’Imagerie Biomédicale (I2BM), MIRCen, F-92260 Fontenay-aux-Roses, France
3Centre National de la Recherche Scientifique (CNRS), Université Paris-Sud, Université Paris-Saclay, UMR 9199, NeurodegenerativeDiseasesLaboratory, F-92260 Fontenay-aux-Roses, France
4Commissariat à l’Energie Atomique et aux Energies Alternatives (CEA), Département de Recherche Fondamentale (DRF), Institut d’Imagerie Biomédicale (I2BM), Service Hospitalier Frédéric Joliot, F-91400 Orsay, France
5Imagerie Moléculaire In Vivo, IMIV, CEA, Inserm, CNRS, Univ. Paris-Sud, Université Paris Saclay, CEA-SHFJ, F-91400 Orsay, France
6Department of Neuroimaging, Institute of Psychiatry, Psychology and Neuroscience, King’s College London, London, UK;
7Centre Expert Parkinson, Neurologie, CHU Henri Mondor, Assistance Publique Hôpitaux de Paris and Université Paris-Est, Créteil, France
8Hôpitaux Saint Antoine, AP-HP, Paris, France.
9Commissariat à l’Energie Atomique et aux Energies Alternatives (CEA), Département deRecherche fondamentale (DRF), Institut d’Imagerie Biomédicale (I2BM),Neurospin, UNIACT, F-91191 Gif-sur-Yvette, France
*These authors equally contributed
Correspondence:
MichelBottlaender Neurospin, CEA,
91191 Gif-Sur-Yvette - France. E-mail : [email protected]
2
Abstract (196)
There is a great need for a non-invasive methodology enabling quantification of TSPO overexpression in PET clinical imaging. [18F]DPA-714 has emerged as a promising TSPO
radiotracer as it is fluorinated, highly specific and returned reliable quantification using arterial input function (AIF). Cerebellum gray matter (CRB) was proposed as reference region for simplified quantification, however this method cannot be used when inflammation involves cerebellum. Here we adapted and validated a supervised clustering (SCA) for [18F]DPA-714 analysis.
Fourteen healthy subjects genotyped for TSPO underwent an [18F]DPA-714 PET,
including ten with metabolite-corrected AIF and three for a test-retest assessment. Two-tissue-compartmental modelling provided BPNDAIF estimates that were compared to
either BPNDLoganSCA or BPNDLoganCRB generated by Logan analysis (using SCA extracted
reference region or CRB).
The SCA successfully extracted a reference region with similar reliability using classes that were defined using either all subjects, or separated into HAB and MAB subjects. BPNDAIF, BPNDLoganSCA and BPNDLoganCRB were highly correlated (ICC of 0.91±0.05) but
BPNDLoganSCA were ~26%, higher and less variable than BPNDLoganCRB. Reproducibility was
good with 5% variability in the test-retest study.
The clustering technique for [18F]DPA-714 provides a simple, robust and reproducible
technique that can be used for all neurological diseases.
Key words
3
Introduction
Neuroinflammation is known to play a key role in the onset and progression of chronic neurodegenerative diseases such as Alzheimer's, Parkinson's and multiple sclerosis. Activated microglia is the main cellular component that characterizes neuroinflammation in these disorders (1). The availability of a reliable imaging tool aimed at quantifying activated microglia in vivo might help to identify specific targets for anti-inflammatory neuroprotective strategies. The translocator protein 18 kDa (TSPO), previously named peripheral benzodiazepine receptor, is only expressed at low levels in the resting brain by quiescent microglial cells, but becomes markedly overexpressed when microglia is activated (2). Although the biological role of TSPO remains poorly understood, with putative effects on cholesterol translocation, steroid synthesis, mitochondrial functioning, and cell apoptosis, it is a promising target for molecular imaging studies of neuroinflammation (3, 4). The [11C]PK11195 radioligand was the first TSPO tracer used in humans (3) and has been investigated in several pilot imaging studies of neuroinflammation in brain diseases (5). However this tracer suffers from serious limitations, such as poor brain penetration and low specific to nonspecific binding ratio in brain and plasma, resulting in a suboptimal signal to noise ratio. Furthermore, the use of 11C radioactive labeling restricts its use to centers with onsite cyclotrons. This has led to the development of second-generation TSPO radiotracers with improved specificity, affinity and signal-to-noise ratio (6). However, a drawback for the quantification of second-generation TSPO tracers is related to different binding sites (7) resulting in three affinity profiles, high-, mixed- and low-affinity binders (HAB, MAB and LAB), which is indicated by the rs6971 single polymorphism contained within the TSPO gene.
Several 18F-labelled second-generation compounds have been investigated in human and
have showed favorable properties for imaging purposes in the brain of healthy subjects (8, 9). However, among those, [18F]FEDAA1106 shows slow kinetics, [18F]FEPPA is rapidly
metabolized and [18F]PBR06 produces brain-penetrant radiolabeled metabolites that
could bias the in vivo imaging and suitable quantification (10, 11).
[18F]DPA-714 provides an improved signal to noise ratio compared to [11C]PK11195 in several preclinical models (6, 12, 13) and was identified as one of the most promising TSPO-ligands for in vivo imaging. The compartmental modeling of [18F]DPA-714 in the
4
described the regional kinetics (14, 15). Depending on the analyzed region, the VT
(mL/cm3) estimate was about 50% higher in HABs compared to MABs, supporting the
need to take the genetic affinity profile into account for the quantification of this tracer in human studies (15).
For all TSPO radiotracers, there are challenges that relate to the quantification of binding parameters (5, 16). Compartmental modeling using the arterial input function is classically considered as the gold standard quantification method, and was first employed for [11C]PK11195 studies using a two tissue compartment model with a K1/k2 value coupled to be the same across the whole brain cortex (17).
However, arterial blood sampling is an invasive procedure and therefore a number of alternatives to the standard quantification have been recently proposed. In order to simplify [18F]DPA-714 quantification, a population-based input function (PBIF) was
tested on healthy subjects using one or two arterial or venous samples and compared to the arterial input function (AIF) quantification (15). A very good agreement between AIF and arterial PBIF was found but the variability increased when late venous samples were used. In addition, this technique still required an invasive extraction of at least one arterial sample as well as the analysis of the blood metabolites.
Reference region methods have also been applied in several recent [11C]PK11195 clinical studies. A reference region should be characterized by low to no specific binding but should have the same amount of free plus non-specifically bound (non-displaceable) ligand as the target region. Accordingly, the cerebellum has been the main choice as a reference region for TSPO ligands, in particular in ischemic stroke (18) and Alzheimer’s disease (19-21). However, these particular properties cannot be generalized to all neurological disorders potentially affecting the cerebellum, such as for multiple sclerosis (22) or HIV (23). Furthermore, data from different studies with [3H]PK11195, [11C]PBR28 and [11C]PK11195 (7, 24, 25) showed that displaceable binding had a non-negligible contribution to the distribution volume in the cerebellum. As a result, using cerebellum as reference region would lead to an underestimation of the true specific binding.
To avoid a potential bias related to the a priori selection of the anatomical reference region, methods for the automatic extraction of reference region in PET images have been developed over recent years, such as the supervised clustering algorithm (SCA) that was introduced by Turkheimer et al. in 2007 (SuperPk) for [11C]PK11195 (26). The SCA was
5
then validated and used in a [11C]PK11195 multi-center study (27). SCA is based on the creation of a set of predefined kinetic classes that guides the algorithm to select only voxels of no or low specific binding within the brain image.
Recently, a similar SCA approach was successfully applied to other tracers such as [11C]PIB (28) or [11C]TMSX (29). An unsupervised clustering approach was also
implemented for [18F]DPA-714 in ALS (30). However, no predefined classes were
identified and employed to supervise the kinetic shape of the time activity curves (TACs) in the clusters, and the results were not validated with AIF-derived-2-TCM.
In this study, we adapted and validated the SuperPK approach (26) to automatically extract the reference region from [18F]DPA-714 images (SuperDPA) in a group of
genotyped healthy subjects. The quantification using each reference region method (SCA methods or the a priori anatomically defined cerebellar gray matter) was compared to the AIF-derived 2-TCM quantification described in our previous [18F]DPA-714 study in the
same healthy human subjects (15). A further validation of the predefined classes for the SCA was performed in three ways. Firstly the influence of the genetic affinity profile was evaluated. Secondly, the optimal set of predefined classes for SuperDPA was investigated by simulating a set of classes for a range of binding conditions based on the 2-TCM kinetic parameters. Finally, the reproducibility of the SCA method was tested with 3 patients who underwent two [18F]DPA-714 scans.
6
Material and Methods
Subjects
Fourteen healthy volunteers (mean age 46.8 15.7 years, 6 females) were included from two clinical protocols conducted at the Service Hospitalier Frédéric Joliot and the ICM (NCT02305264 and NCT02319382).Written informed consent was obtained from all participants and the protocols were approved by the Medical Bioethics Committee of Ile de France Region and according to French legislation and European directives. All subjects were considered healthy according to their medical history record and physical examination. They all had a normal brain MRI.
Genomic DNA from blood samples was used to genotype the rs6971 polymorphism of the TSPO gene. The analysis revealed 7 high affinity binders (HAB) (mean age 47.4 16.0 years, 3 females) and 7 mixed affinity binders (MAB) (mean age 46.3 16.7 years, 3 females). No low affinity binders were found among the 14 subjects.
Imaging protocol
Each participant underwent a T1-weighted (T1-w) magnetic resonance image and a [18F]DPA-714 PET acquisition. More details on the imaging protocols can be found in
Lavisse et al 2015 (15). Three subjects (2 HABs, 1 MAB) underwent a second PET acquisition (injected activity difference 30.2 ± 21.6 MBq) after 7 to 9 days to study the reproducibility of the quantification method.
T1-w imaging was performed using a turbo spin echo sequence (TSE) (TE/TR= 3/6300 ms; alpha= 10, resolution= 0.92x0.92x0.93 mm) in a 1.5T Philips Achieva (Best, The Netherlands) scanner or a MPRAGE (TE/TI/TR=2.98/900/2300, alpha=9°, resolution=1x1x1.1 mm) in a 3T Siemens Trio scanner (Erlangen, Germany).
[18F]DPA-714 was prepared according to standard conditions (31). Subjects underwent
[18F]DPA-714 PET scans in a high-resolution research tomograph (HRRT, Siemens,
Knoxville, TN, USA). After a transmission scan using a 137Cs point source, a [18F]DPA-714
bolus was intravenously injected (198.4 ± 22.9 MBq). The dynamic PET acquisition in list mode lasted 90 min.
7
Ten subjects (7 HABs and 3 MABs) out of the 14 included in this study were the same as those described in Lavisse et. al. (15) and had AIFs corrected for metabolites.
Image processing
PET acquisitions were corrected for random attenuation and scattered coincidences, and reconstructed with the iterative ordered-subset expectation maximization (Ordinary Poisson [OP]-OSEM) 3D method (4 iterations using 16 subsets) including point spread function modeling within the reconstruction (using a 3D Gaussian kernel with 2 mm full-width at half-maximum). Dynamic data were binned into 27 frames (6x1 min, 7x2 min, 14x5 min). Reconstructed dynamic PET data were realigned for motion correction using the frame-to-reference image registration in PMOD 3.5 (PMOD Technologies Ltd., Zurich, CH).
T1-w images were segmented using Freesurfer 5.3 (http://freesurfer.net) and regions of interest (ROIs) were selected: thalamus, hippocampus, cerebellar gray matter, white matter and occipital, parietal, frontal and cingulate cortices. A whole brain mask was also extracted. T1-w images and ROIs were resampled into the PET space using a rigid registration in order to extract time-activity curves (TACs) from each ROI. Data from the left and right hemispheres were averaged. Kinetic modeling (2-TCM) was performed using the COMKAT library and Logan graphical analysis was proceeded using in-house software in Matlab (Math Works, Natick, MA, USA).
Implementation of the Supervised Clustering Algorithm for [18F]DPA-714 (SuperDPA)
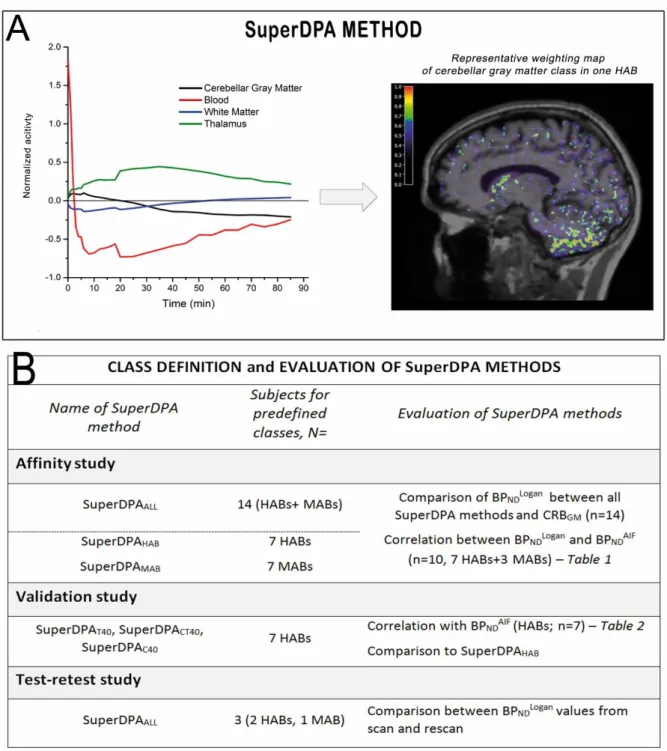
As in the SuperPK (26), the SuperDPA algorithm includes three steps to extract the reference region: i) a normalization procedure to scale each frame and make the acquisition comparable across subjects; ii) the creation of a set of predefined kinetic classes adapted to [18F]DPA-714 for use in the supervised algorithm; and iii) a supervised
clustering algorithm that calculates the contribution of each kinetic class to the signal of each voxel (Figure 1A).
i. Normalization:
Each frame is normalized to reduce variability across frames and subjects. The normalization step is carried out during the definition of the kinetic classes, as well as for each image analyzed using the SCA method. To normalize the scan, the mean value of the activity in the brain in each frame is subtracted from the activity of each voxel in that
8
frame. The resulting “centered” values are divided by the standard deviation of the values over the whole brain at the same frame.
ii. Definition of the kinetic classes of the SuperDPA
Because [11C]PK11195 and [18F]DPA-714 share the same target, we used the same four
classes presented by Yaqub et. al. 2012 (27): blood pool class, white matter class, no to low specific binding class (reference region) and high specific binding class. The blood pool class was extracted from the carotid arteries that were manually segmented using the PET image summed over the 2 first minutes of acquisition. The white matter class was defined using the Freesurfer automatic segmentation. In healthy controls (15), the level of binding in the gray matter displayed significant variation, with the highest specific uptake being detected in the thalamus. We therefore chose the thalamus to define the high specific binding class. We chose the cerebellar gray matter (CRBGM) to define the low
specific binding class (reference region class) for the following reasons. First, we have previously shown that the lowest binding was found in the CRBGM; second, TSPO mRNA
expression in cortical grey matter was found the lowest across brain as derived from Allen Brain Altas (http://human.brain-map.org) (32) and finally, Turkheimer et al. observed most voxels of the extracted reference region in the cerebellar gray matter, using SuperPK (26).
In each subject, the TACs for each class were then extracted from normalized images (step i.) and averaged across the subjects to create the set of classes used for the SuperDPA.
iii. Supervised classification
In order to extract the reference region in each PET image, the kinetics of each voxel was projected onto the kinetic classes using a non-negative least squares (NNLS) algorithm, yielding the percent contribution of the each class in that voxel. As in SuperPK (26), only voxels with a probability higher than 90% of belonging to the reference region class were averaged to create the reference TAC.
Validation of kinetic classes definition
Based on SuperDPA methodology, we developed two different approaches to validate the predefined classes. The first approach assumed that the kinetics of [18F]DPA-714 depend
on the TSPO affinity profile of each given subject. Classes were therefore independently created for HAB and MAB subjects in a so-called 'affinity study'. The second approach, a ‘validation study’, used simulated predefined classes with different characteristics to
9
investigate whether using classes with higher or lower specific binding would yield a more appropriate reference curve (Figure 1-B).
i. Affinity study
We investigated the impact of the genetic binding profile of the subjects on the shape of the classes and consequently on the extracted reference curves and estimated parameters. We therefore defined separate sets of classes based on the genetic affinity profiles: classes were created using either the 7 MABs, yielding the SuperDPAMAB method
to process the MAB subjects or the 7 HABs subjects, yielding the SuperDPAHAB to process
the HABs only. For comparison, we also generated a single set of classes from both HAB and MAB subjects pooled together (n=14), yielding the SuperDPAALL applied on all
subjects, whatever their genetic profile. ii. Validation of the classes
We generated 2 types of simulated classes: 1) a simulated reference region class with less specific binding than in the initial CRBGM TAC and 2) a simulated high specific binding class
with higher specific binding (from the thalamus TAC). To create the simulated classes, we modified the k3 parameter previously determined in Lavisse et al. (15) using the 2-TCM
for the 7 HAB subjects. To generate the simulated CRBGM class with lower specific binding
for each subject, the initial k3 of the cerebellum gray matter was decreased by - 40% while
all other parameters (K1, k2, k4) remained unchanged. Similarly, to generate a simulated
higher specific binding class, the initial k3 was increased by +40%. Again, this was done
for each subject. The resulting simulated TACs were used to create the classes for the reference region class and the high specific binding class using the method described earlier. For each simulation, the white matter and the blood classes were kept the same as in SuperDPAHAB. The simulations required all subjects to have AIF available for the
estimation of the parameters and curve generation. To avoid the impact of the genetic affinity, only the HAB group (n=7) was used for these simulations.
In total, three SuperDPA methods were defined in this ‘validation study’: theSuperDPAC40methodwith a 40% reduction in the specific binding of the CRBGM (2) the
SuperDPAT40 with a 40% increase in the specific binding of the thalamus and (3)
SuperDPACT40 method with both 40% decrease in the CRBGM and 40% increase in the
10 Binding parameter estimation
We previously showed (15) that the model that best described the kinetics of [18
F]DPA-714 was the 2-TCM that was therefore used as ground truth in this study. For each ROI, BPND was indirectly estimated using the AIF as in previous studies (26, 27) to obtain
BPNDAIF with:
BPNDAIF=(VTROI– VTREF ) / VTREF
where VTROI and VTREF are the total volumes of distribution computed with the 2-TCM for
the ROI and the extracted reference region of each method, respectively.
In parallel, [18F]DPA-714 binding in all ROIs was estimated using the Logan reference
graphical method for all SuperDPA approaches and CRBGM (33), as previously described
(34). The Logan graphical analysis provided the distribution volume ratio (DVRLOGAN) that
was converted into BPNDLOGAN (BPNDLOGAN = DVRLOGAN – 1).
BPNDLOGAN parametric images were computed using the extracted reference region of the
SuperDPA methods to show the distribution of specific binding across the brain for each method.
Method evaluation and validation (Figure 1B) i. Affinity study
BPNDLOGAN values estimated from reference regions extracted using SuperDPAALL and
SuperDPAHAB/MAB were cross-compared for each subject (n=14) and compared to the BPND
from subjects with arterial sampling (n=10; BPNDAIF). In addition, BPNDLOGAN from these
two methods were also correlated to the BPNDLOGAN obtained for the CRBGM. Comparisons
were assessed using the Pearson correlation, intra-class correlation (ICC) and relative error coefficients. Relative error was calculated based on absolute BPNDLOGAN and BPNDAIF
values.
ii. Validation of the classes
BPNDLOGAN provided by the SuperDPAHAB and the three sets optimized SuperDPA methods
(superDPAC40, superDPAT40 and superDPATC40) were compared to BPNDAIF from the
11
using correlation coefficient, intra-class correlation (ICC) and the relative error between BPNDLOGAN and BPNDAIF.
iii. Test-retest study
The reproducibility of the SuperDPAALL, SuperDPAHAB/MAB and CRBGM was evaluated using
the three subjects who had two PET acquisitions within 7-9 days. Each reference region method was applied for both the first and the second PET exams independently, yielding BPNDLOGAN estimates. The relative error was computed between the BPNDLOGAN
measurements from the scan and rescan images.
Statistics
For each of the SCA methods investigated, the set of predefined classes were computed using a leave-one-out approach. Then, the reference region for the remaining subject was extracted using the classes created without that particular subject.
All statistics were computed using the freely distributed software R (www.r-project.org). Pearson correlation was used as correlation coefficient. The ICC measured the absolute agreement between the parameters derived when using the AIF and the reference region quantifications, according to the Shrout and Fleiss convention (35). Coefficient of variation was defined as the standard deviation of the BPNDLOGAN estimates of all group
subjects divided by their mean. Pairwise comparisons were performed using Mann-Whitney or paired Mann-Mann-Whitney, when appropriate. BPNDLOGAN obtained from all
methods were compared using a one-way paired ANOVA followed by post hoc Bonferroni corrected Fisher tests. Significance for all tests was set to p < 0.05.
12
RESULTS
Reference region extraction using the SuperDPA
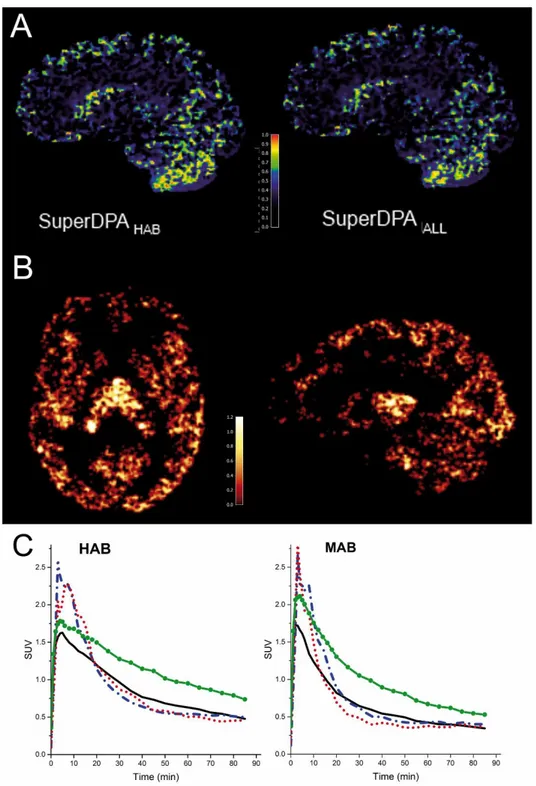
Weighting maps were extracted from dynamic [18F]DPA-714 scans of HAB and MAB
subjects, using the SuperDPAALL and the SuperDPAHAB/MAB approaches. The coefficient
maps for blood and white matter kinetic classes displayed expected distributions (data not shown). Maps representing high specific binding showed voxels mainly located in the thalamus region. Interestingly, the majority of voxels assigned to the reference region (probability higher than 90% of belonging to the reference region class) were located in the cerebellar gray matter and caudate and to some extent throughout the cortical gray matter. Representative probability maps from SuperDPAALL and SuperDPAHAB are
displayed in Figure 2A for one HAB subject.
Mean TACs from the reference region extracted using SuperDPAALL and SuperDPAHAB/MAB
together with TACs of the CRBGM and thalamus are shown in Figure 2C. TACs using both
SuperDPAALL and SuperDPAHAB/MAB showed a higher peak and a faster wash-out than that
obtained in the cerebellar gray matter and reached the same residual activity at 90 minutes.
Quantification of PET data
Representative BPNDLOGAN parametric images obtained using the voxel-wise Logan method
in one HAB subject (SuperDPAALL) are shown in Figure 2B. As expected, the highest
specific binding was found in the thalamus (15). BPNDLOGAN obtained using the
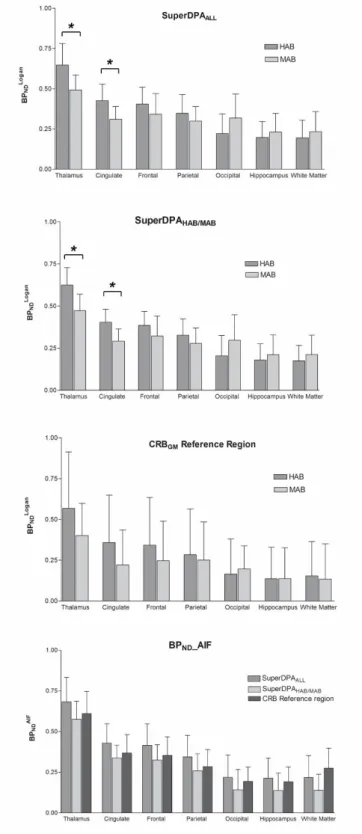
SuperDPAALL, the SuperDPAHAB/MAB and the CRBGM are presented in Figure 3. Among
studied ROIs, the highest BPNDLOGAN estimates were found in the thalamus, the parietal,
cingulate and frontal cortices. The lowest binding was seen in the white matter and hippocampus. To validate the SuperDPA approach, these BPNDLOGAN estimates were
compared to BPNDAIF: correlation coefficients r and ICC values between both parameters
were found higher than 0.92 in all ROIs except in the white matter (r=0.85, ICC=0.86) using SuperDPAALL (Table 1).
Influence of the genetic affinity profiles
For all methods (SuperDPAALL, SuperDPAHAB/MAB and CRBGM), the average TACs of the
extracted reference regions showed a slightly different shape between the HAB and the MAB groups (Figure 2C). Similar to the CRBGM TACs, both SuperDPAALL and
13
SuperDPAHAB/MAB could identify TSPO affinity based on the TAC shapes, with a wider peak
and a slower wash-out for the HAB group.
As shown in Figure 3, the mean BPNDLOGAN value was higher in the HAB group compared
to the MAB group in the four regions with high specific binding (thalamus and cingulate, frontal and parietal cortices), whichever reference region was used. The difference reached significance in the thalamus and the cingulate cortex when using the supervised clustering approaches only: respectively, +24.4% and +27.8% for SuperDPAALL (p=0.04)
and +24.0% and +27.0% for SuperDPAHAB/MAB (p=0.02). As illustrated in Figure 3, the
BPNDLOGAN using both SuperDPA methods showed much lower standard deviation
compared to those obtained with CRBGM in all regions: the inter-subject variability
measured by the coefficient of variation was 0.2 and 0.19 (for HABs and MABs, respectively) using SuperDPAHAB/MAB and 0.17 and 0.21 using SuperDPAALL compared to
0.61 and 0.49 for the CRBGM reference region. The CRBGM approach did not allow the
difference between HABs and MABs to become significant in any region.
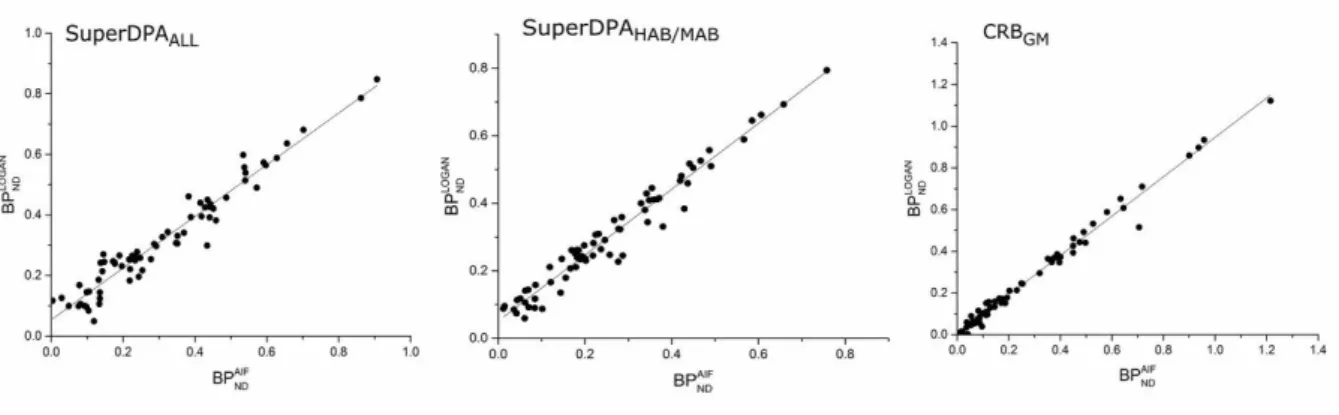
For all methods, the BPNDAIF and BPNDLOGAN were found to be highly correlated (Table 1
and Figure 4): r values were above 0.9 for gray matter ROIs and above 0.85 for the white matter. ICC were also high, slightly higher for CRBGM (mean 0.99 ± 01) followed by the
SuperDPAALL (mean 0.91 ± 0.05) and SuperDPAHAB/MAB (mean 0.84 ±0.05).
According to affinity group, the mean BPNDLOGAN estimates were significantly higher with
SuperDPAALL and with SuperDPAHAB/MAB compared to those obtained with CRBGM method
in each ROI (averaged over the 7 ROIs : respectively +25.6±10.6%; p<0.0002 and +20.4±10.6%; p<0.006 compared to CRBGM). Furthermore, the mean BPNDLOGAN estimates
obtained with all SuperDPA methods overestimated the BPNDAIF values (+15.2% and
+45.4% respectively). Interestingly, this relative error was lower in ROIs characterized by a high specific binding such as the thalamus (-0.5% and+6.4%), the frontal cortex
(+7.2% and +16.9%), and the cingulate cortex (7.5% and 15.9%) for SuperDPAALL and
SuperDPAHAB/MAB, respectively. Using the CRBGM as reference region resulted in a wider
range of relative error from -106.3% to +34.3% with overall higher absolute values. The standard deviation of the relative error was lower for SuperDPAALL (+38.7%) compared
14 Validation of the predefined classes
Correlations and ICC between the BPNDAIF and the BPNDLOGAN estimates were very high for
the three simulations tested (SuperDPAT40, SuperDPACT40, SuperDPAC40- Table 2). The
three simulations did not differ (p>0.2) with SuperDPAHAB regarding the strength of their
correlations with BPNDAIF. ICC between the BPNDAIF and BPNDLOGAN was slightly but not
significantly lower for the SuperDPAC40 (0.86±0.03) when compared to ICC between
BPNDAIF and BPNDLOGAN estimates from SuperDPAHAB (0.93±0.03). Likewise, increasing the
specific binding in the high binding class (SuperDPAT40 andSuperDPACT40) resulted in a
similar ICC compared to the SuperDPAHAB (0.93±0.03 and 0.90±0.03). Overall, very high
agreement between BPNDLOGAN and BPNDAIF was found in all ROIs.
Test-retest study
With respect to the scan-rescan reproducibility, the SuperDPA methods showed a lower average absolute variability compared to the CRBGM (CRBGM: 6.3%, SuperDPAHAB/MAB: and
SuperDPAALL: 4.5% - Figure 5) with similar standard deviation around 3.5 % for all
methods. Interestingly, regions with high specific binding (thalamus, cingulate, frontal and parietal cortices) displayed better reproducibility measures when using SuperDPA methods compared to the CRBGM.
15
Discussion
In this study, we adapted a supervised clustering approach to automatically extract reference regions within the brain from dynamic [18F]DPA-714 PET scans of healthy
volunteers. This method provides a non-invasive quantification that has the potential to greatly simplify the use of this tracer in the clinical setting. The quantification performed using SuperDPA showed a very high agreement with the gold standard AIF quantification, and a very low inter-and intra-subject variability. We found that the creation of the set of predefined classes using both HAB and MAB subjects is adequate to extract a reference region, as it provided results with the same level of reliability than with the creation of two separate sets of predefined classes.
The SuperDPA method was found to be robust for identification of voxels belonging to the reference. This was further validated when the input regions to the SuperDPA classes were compared with optimized set of classes. Although these new classes were based on simulations from the 2-TCM quantification with lower or higher specific binding, they did not impact the correlation with BPNDAIF estimates.
We found that the SuperDPA-based-quantification had excellent agreement with the AIF-based-quantification. Interestingly, correlations of the SuperDPA method with AIF quantification and reproducibility measures were both better in ROIs characterized by high specific binding compared to regions with low binding. This same finding was observed by Collste et al. in healthy volunteers (36) and by Park et al. in multiple sclerosis patients compared to healthy controls (37).This suggests that the accuracy and reproducibility of the quantification using SuperDPA should be optimal in pathological conditions associated with a high level of TSPO expression.
The use of CRBGM as pseudo reference region has previously provided consistent findings
for differentiating healthy subjects and Alzheimer patients, at prodromal and dementia stages (17, 19). This method also showed a strong correlation with AIF quantification among healthy volunteers (38) as we found in this study. However, only the SuperDPA method should enable to discriminate subtle microglial activation in brain diseases where the location and amplitude of neuroinflammation is unpredictable and may include the cerebellum. The reference region extracted from the SuperDPA methods showed a faster wash-out kinetics than the CRBGM and a lower VT (mean VT = 2.84±1.44 and VT = 3.41±2.15,
16
closer to the shape of non-displaceable binding than that of the CRBGM. Consequently, SuperDPA provided significantly higher BPNDLOGAN estimates than for CRBGM
(+25.6±10.6% and +20.4±10.6% for SuperDPAALL and SuperDPAHAB/MAB compared to
CRBGM).
Furthermore, inter-subject variability was found to be lower for SuperDPA than for CRBGM
(Figure 3). For both SuperDPA methods, the coefficient of variation of the BPNDLogan
estimates in the HAB group was of about 33%, which is the same order of magnitude as the VT estimates in HABs calculated in (15) using the AIF quantification in the same
subjects. A similar variability was described by Kreisl et al. (39)for the [11C]PBR28 (29-36% for the VT in HABs) and by Guo et al. for the [11C]PBR111 (~35% in HABs) (8).
However, all these results were obtained using VT parameter which is related to the global
uptake, whereas the BPND parameter used in the present study should reflect the specific
binding more accurately.
The test-retest analysis performed here (n=3) provided a very low BPND coefficient of
variation, less than 7%, for all quantification methods. This coefficient was lower for the SuperDPA approach (4.5%) than for the CRBGM (6.3%), although not significantly. In
comparison, poor reproducibility was found using the [11C]DPA-713 in healthy controls
by Coughlin et al. (40) according to a regional VT systematically increasing from test to retest. For the [11C]PBR28, Collste et al.(36), showed a mean VT absolute variability of 18 % in gray matter and of 48% in white matter in healthy subjects, while Park et al. (37) described a test-retest variability between 7 and 9% in healthy volunteers and MS patients. Using the SCA approach and [11C]PK11195, this variation was found of 10.6% in four AD patients (26).
Another goal of this study was to take into account the impact of genetic polymorphism related to the affinity of [18F]DPA-714 to TSPO binding site on the SCA quantification. We
confirmed here that the [18F]DPA-714 binding parameters estimated are affected by the
affinity binding status of each subject, similarly to the other second generation TSPO tracers (8). In particular, the difference between HABs and MABs was particularly high in TSPO-rich regions: BPNDLOGAN was significantly higher of ~26% in thalamus and cingulate in HABs compared to MABs. This difference is comparable to previous studies: using the 2-TCM in the same subjects, Lavisse et al. found approximately +30% difference in [18F]DPA-714 VT in the thalamus (15). The [18F]FEPPA tracer was shown to induce either
17
difference (non-significant) in white matter (42). For [11C]PBR28, Kreisl et al. (39) found SUV ~40% greater in HAB subjects than in MAB subjects.
The ability of the SuperDPA method to detect the impact of the TSPO polymorphism on [18F]DPA-714 uptake finally confirms the superiority of this method over the CRBGM which
failed to show a significant difference in binding parameters between HABs and MABs. Compared to SuperDPAHAB/MAB, the BPNDLOGAN values obtained with the SuperDPAALL were found closer to those obtained with AIF with a lower relative error, indicating that SuperDPAALL provides binding parameter estimation that is as accurate as SuperDPAHAB/MAB,if not even better. Therefore, the same supervised clustering procedure can be applied for reference voxels extraction in HAB and MAB subjects. Running SCA does not need the prerequisite of TSPO polymorphism knowledge but we confirm here that TSPO genotype correction is required for cross-sectional comparisons.
One limitation of the study is that our method was only applied to a healthy group of volunteers. However, healthy subjects have a low expression of TSPO throughout brain regions and the quantification is expected to be more challenging than in patients where higher levels of TSPO expression are observed and therefore statistical differences should be more easily detected. Simulating pathological condition here by increasing the specific binding in the corresponding class (SuperDPAT40) did not change the extracted reference
region and resulting binding parameters. This suggests that our method, based on kinetic classes defined in a population of healthy volunteers, can be applied in patients to accurately detect and quantify neuroinflammation.
Another possible confounding factor that remains to be assessed for [18F]DPA-714
quantification is the influence of endothelial binding on SCA-based estimates. It has been suggested that the endothelial cells express non negligible TSPO for binding with [18F]DPA-714. The introduction of an extra irreversible compartment representing this
endothelial cell binding on blood brain barrier in the model (2-TCM-1K) has been showed to enhance the estimation accuracy of the [11C]PBR28 binding parameters(16, 43, 44). In
this study, the validation of the SCA-based parameter estimation methods was done using estimates from our previous quantification study of [18F]DPA-714 which describes the
2-TCM as an appropriate model. The question of whether it is necessary to include endothelial binding into the AIF-based quantification for [18F]DPA-714 and whether it
needs to be accounted for in simplified modeling methods as for [11C]PK11195 (27, 45) is
18 Conclusion
In this study, we adapted a supervised clustering approach to automatically extract reference regions within the brain from dynamic [18F]DPA-714 PET images of healthy
volunteers. The creation of a unique set of predefined classes from both HAB and MAB subjects was shown to be adequate to extract a reference region as it provided results with the same level of reliability than when creating two separate sets of predefined classes. Thus, the knowledge of TSPO genetic status is not a prerequisite to run the SCA method but the 30% difference in BPNDLOGAN between HABs and MABs highlights the need
to allocate subjects in their genetic affinity status to allow clinical interpretation. The SuperDPA method was validated through 1) simulated kinetic classes, 2) high correlation with results obtained using quantification based on invasive AIF and 3) by showing very low intra-subject variability. Regarding those criteria, the SCA method appeared to be more robust and accurate than the CRBGM reference region method. Moreover, the SCA
allows the possibility of a non-invasive quantification that should greatly simplify the use of this tracer in any neurological disorders. The very good reproducibility and low inter-subject variability suggest that this method might be able to detect subtle changes in TSPO binding on [18F]DPA-714 images of patients and to measure longitudinal changes in
neuroinflammation.
Acknowledgements
The authors would like to thank chemical/radiopharmaceutical, PET physicist and nursing staff of Service Hospitalier Frédéric Joliot for the synthesis of [18F]DPA-714,
patient management and PET image reconstruction. We thank Lena Guillot, Isabelle Rebeix, Sylvie Forlani, and Luce Dauphinot for the genetic analysis.
This work was supported by France Parkinson (NCT 02319382), ANR-08-MNPS-016-02 and ANR-10-IAIHU-06(NCT02305264). a grant from “Investissement d’Avenir- ANR-11-INBS-0011”—NeurATRIS, CEA. The sponsor of the NCT02305264 study was AP-HP (Assistance Publique des Hôpitaux de Paris). BB was partly supported by ECTRIMS and Fondation ARSEP. CW was supported by the Eurotalent grant number 600382.
No other potential conflict of interest relevant to this article was reported.
Disclosures / Conflicts of interest
19
References
1. Glass CK, Saijo K, Winner B, Marchetto MC, Gage FH. Mechanisms underlying inflammation in neurodegeneration. Cell. 2010;140(6):918-34.
2. Venneti S, Lopresti BJ, Wiley CA. Molecular imaging of microglia/macrophages in the brain. Glia. 2013;61(1):10-23.
3. Benavides J, Malgouris C, Imbault F, Begassat F, Uzan A, Renault C, et al. "Peripheral type" benzodiazepine binding sites in rat adrenals: binding studies with [3H]PK 11195 and autoradiographic localization. Arch Int Pharmacodyn Ther. 1983;266(1):38-49.
4. Vivash L, O'Brien TJ. Imaging Microglial Activation with TSPO PET: Lighting Up Neurologic Diseases? J Nucl Med. 2016;57(2):165-8.
5. Hinz R, Boellaard R. Challenges of quantification of TSPO in the human brain. Clin Transl Imaging. 2015:1-14.
6. Chauveau F, Van Camp N, Dolle F, Kuhnast B, Hinnen F, Damont A, et al. Comparative evaluation of the translocator protein radioligands 11C-DPA-713, 18F-DPA-714, and 11C-PK11195 in a rat model of acute neuroinflammation. J Nucl Med. 2009;50(3):468-76.
7. Owen DR, Yeo AJ, Gunn RN, Song K, Wadsworth G, Lewis A, et al. An 18-kDa Translocator Protein (TSPO) polymorphism explains differences in binding affinity of the PET radioligand PBR28. J Cereb Blood Flow Metab. 2012;32(1):1-5.
8. Guo Q, Colasanti A, Owen DR, Onega M, Kamalakaran A, Bennacef I, et al. Quantification of the specific translocator protein signal of 18F-PBR111 in healthy humans: a genetic polymorphism effect on in vivo binding. J Nucl Med. 2013;54(11):1915-23.
9. Rusjan PM, Wilson AA, Bloomfield PM, Vitcu I, Meyer JH, Houle S, et al. Quantitation of translocator protein binding in human brain with the novel radioligand [18F]-FEPPA and positron emission tomography. J Cereb Blood Flow Metab. 2011;31(8):1807-16.
10. Fujimura Y, Zoghbi SS, Simeon FG, Taku A, Pike VW, Innis RB, et al. Quantification of translocator protein (18 kDa) in the human brain with PET and a novel radioligand, (18)F-PBR06. J Nucl Med. 2009;50(7):1047-53.
11. Varrone A, Mattsson P, Forsberg A, Takano A, Nag S, Gulyas B, et al. In vivo imaging of the 18-kDa translocator protein (TSPO) with [18F]FEDAA1106 and PET does not show increased binding in Alzheimer's disease patients. Eur J Nucl Med Mol Imaging. 2013;40(6):921-31.
12. Abourbeh G, Theze B, Maroy R, Dubois A, Brulon V, Fontyn Y, et al. Imaging microglial/macrophage activation in spinal cords of experimental autoimmune encephalomyelitis rats by positron emission tomography using the mitochondrial 18 kDa translocator protein radioligand [(1)(8)F]DPA-714. J Neurosci. 2012;32(17):5728-36.
13. Boutin H, Prenant C, Maroy R, Galea J, Greenhalgh AD, Smigova A, et al. [18F]DPA-714: direct comparison with [11C]PK11195 in a model of cerebral ischemia in rats. PLoS One. 2013;8(2) 14. Golla SSV, Boellaard R, Oikonen V, Hoffmann A, van Berckel BNM, Windhorst AD, et al. Quantification
of [lsqb]18F[rsqb]DPA-714 binding in the human brain: initial studies in healthy controls and Alzheimer/'s disease patients. J Cereb Blood Flow Metab. 2015;35(5):766-72.
15. Lavisse S, García-Lorenzo D, Peyronneau M-A, Bodini b, Thiriez C, Kuhnast B, et al. Optimized quantification of TSPO radioligand 18F-DPA-714 uptake in the brain of genotyped healthy volunteers. Journal of Nuclear Medicine. 2015.
16. Turkheimer FE, Rizzo G, Bloomfield PS, Howes O, Zanotti-Fregonara P, Bertoldo A, et al. The methodology of TSPO imaging with positron emission tomography. Biochem Soc Trans. 2015;43(4):586-92.
17. Kropholler MA, Boellaard R, Schuitemaker A, van Berckel BN, Luurtsema G, Windhorst AD, et al. Development of a tracer kinetic plasma input model for (R)-[11C]PK11195 brain studies. J Cereb Blood Flow Metab. 2005;25(7):842-51.
18. Gerhard A, Schwarz J, Myers R, Wise R, Banati RB. Evolution of microglial activation in patients after ischemic stroke: a [11C](R)-PK11195 PET study. Neuroimage. 2005;24(2):591-5.
19. Hamelin L, Lagarde J, Dorothee G, Leroy C, Labit M, Comley RA, et al. Early and protective microglial activation in Alzheimer's disease: a prospective study using 18F-DPA-714 PET imaging. Brain. 2016;139(Pt 4):1252-64.
20. Kropholler MA, Boellaard R, van Berckel BN, Schuitemaker A, Kloet RW, Lubberink MJ, et al. Evaluation of reference regions for (R)-[(11)C]PK11195 studies in Alzheimer's disease and mild cognitive impairment. J Cereb Blood Flow Metab. 2007;27(12):1965-74.
20
21. Lyoo CH, Ikawa M, Liow JS, Zoghbi SS, Morse CL, Pike VW, et al. Cerebellum Can Serve As a Pseudo-Reference Region in Alzheimer Disease to Detect Neuroinflammation Measured with PET Radioligand Binding to Translocator Protein. J Nucl Med. 2015;56(5):701-6.
22. Politis M, Giannetti P, Su P, Turkheimer F, Keihaninejad S, Wu K, et al. Increased PK11195 PET binding in the cortex of patients with MS correlates with disability. Neurology. 2012;79(6):523-30.
23. Garvey LJ, Pavese N, Ramlackhansingh A, Thomson E, Allsop JM, Politis M, et al. Acute HCV/HIV Coinfection Is Associated with Cognitive Dysfunction and Cerebral Metabolite Disturbance, but Not Increased Microglial Cell Activation. PLoS One. 2012;7(7)
24. Doble A, Malgouris C, Daniel M, Daniel N, Imbault F, Basbaum A, et al. Labelling of peripheral-type benzodiazepine binding sites in human brain with [3H]PK 11195: anatomical and subcellular distribution. Brain research bulletin. 1987;18(1):49-61.
25. Schuitemaker A, Kropholler MA, Boellaard R, van der Flier WM, Kloet RW, van der Doef TF, et al. Microglial activation in Alzheimer's disease: an (R)-[(1)(1)C]PK11195 positron emission tomography study. Neurobiol Aging. 2013;34(1):128-36.
26. Turkheimer FE, Edison P, Pavese N, Roncaroli F, Anderson AN, Hammers A, et al. Reference and Target Region Modeling of [11C]-(R)-PK11195 Brain Studies. Journal of Nuclear Medicine. 2007;48(1):158-67.
27. Yaqub M, van Berckel BNM, Schuitemaker A, Hinz R, Turkheimer FE, Tomasi G, et al. Optimization of supervised cluster analysis for extracting reference tissue input curves in (R)-[lsqb]11C[rsqb]PK11195 brain PET studies. J Cereb Blood Flow Metab. 2012;32(8):1600-8.
28. Ikoma Y, Edison P, Ramlackhansingh A, Brooks DJ, Turkheimer FE. Reference region automatic extraction in dynamic [11C]PIB. J Cereb Blood Flow Metab. 2013;33(11):1725-31.
29. Rissanen E, Tuisku J, Luoto P, Arponen E, Johansson J, Oikonen V, et al. Automated reference region extraction and population-based input function for brain [lsqb]11C[rsqb]TMSX PET image analyses. J Cereb Blood Flow Metab. 2015;35(1):157-65.
30. Corcia P, Tauber C, Vercoullie J, Arlicot N, Prunier C, Praline J, et al. Molecular Imaging of Microglial Activation in Amyotrophic Lateral Sclerosis. PLoS One. 2012;7(12)
31. Kuhnast B, Damont A, Hinnen F, Catarina T, Demphel S, Le Helleix S, et al. [18F]DPA-714, [18F]PBR111 and [18F]FEDAA1106-selective radioligands for imaging TSPO 18 kDa with PET: automated radiosynthesis on a TRACERLAb FX-FN synthesizer and quality controls. Appl Radiat Isot. 2012;70(3):489-97.
32. Hawrylycz MJ, Lein ES, Guillozet-Bongaarts AL, Shen EH, Ng L, Miller JA, et al. An anatomically comprehensive atlas of the adult human brain transcriptome. Nature. 2012;489(7416):391-9. 33. Logan J, Fowler JS, Volkow ND, Ding YS, Wang G-J, Alexoff DL. A Strategy for Removing the Bias in the
Graphical Analysis Method. J Cereb Blood Flow Metab. 2001;21(3):307-20.
34. Arlicot N, Vercouillie J, Ribeiro MJ, Tauber C, Venel Y, Baulieu JL, et al. Initial evaluation in healthy humans of [18F]DPA-714, a potential PET biomarker for neuroinflammation. Nucl Med Biol. 2012;39(4):570-8.
35. Shrout PE, Fleiss JL. Intraclass correlations: uses in assessing rater reliability. Psychological bulletin. 1979;86(2):420-8.
36. Collste K, Forsberg A, Varrone A, Amini N, Aeinehband S, Yakushev I, et al. Test-retest reproducibility of [(11)C]PBR28 binding to TSPO in healthy control subjects. Eur J Nucl Med Mol Imaging. 2016;43(1):173-83.
37. Park E, Gallezot JD, Delgadillo A, Liu S, Planeta B, Lin SF, et al. (11)C-PBR28 imaging in multiple sclerosis patients and healthy controls: test-retest reproducibility and focal visualization of active white matter areas. Eur J Nucl Med Mol Imaging. 2015;42(7):1081-92.
38. Kreisl WC, Lyoo CH, Liow JS, Wei M, Snow J, Page E, et al. (11)C-PBR28 binding to translocator protein increases with progression of Alzheimer's disease. Neurobiol Aging. 2016;44:53-61.
39. Kreisl WC, Jenko KJ, Hines CS, Lyoo CH, Corona W, Morse CL, et al. A genetic polymorphism for translocator protein 18 kDa affects both in vitro and in vivo radioligand binding in human brain to this putative biomarker of neuroinflammation. J Cereb Blood Flow Metab. 2013;33(1):53-8.
40. Coughlin JM, Wang Y, Ma S, Yue C, Kim PK, Adams AV, et al. Regional brain distribution of translocator protein using [(11)C]DPA-713 PET in individuals infected with HIV. J Neurovirol. 2014;20(3):219-32.
41. Mizrahi R, Rusjan PM, Kennedy J, Pollock B, Mulsant B, Suridjan I, et al. Translocator protein (18 kDa) polymorphism (rs6971) explains in-vivo brain binding affinity of the PET radioligand [(18)F]-FEPPA. J Cereb Blood Flow Metab. 2012;32(6):968-72.
21
42. Suridjan I, Rusjan PM, Kenk M, Verhoeff NP, Voineskos AN, Rotenberg D, et al. Quantitative imaging of neuroinflammation in human white matter: a positron emission tomography study with translocator protein 18 kDa radioligand, [18F]-FEPPA. Synapse. 2014;68(11):536-47.
43. Bloomfield PS, Selvaraj S, Veronese M, Rizzo G, Bertoldo A, Owen DR, et al. Microglial Activity in People at Ultra High Risk of Psychosis and in Schizophrenia: An [C]PBR28 PET Brain Imaging Study. Am J Psychiatry. 2015
44. Rizzo G, Veronese M, Tonietto M, Zanotti-Fregonara P, Turkheimer F, Bertoldo A. Kinetic modeling using a two-tissue compartment model and an additional irreversible vascular component improves the quantification of [11C]PBR28 brain PET data. Journal of Nuclear Medicine. 2014;55(supplement 1):2020.
45. Tomasi G, Edison P, Bertoldo A, Roncaroli F, Singh P, Gerhard A, et al. Novel reference region model reveals increased microglial and reduced vascular binding of 11C-(R)-PK11195 in patients with Alzheimer's disease. J Nucl Med. 2008;49(8):1249-56.
22
Figures :
23
Figure 2 : A: Weighting maps of low/non-specific class (used for reference region selection) for one representative HAB subject using SuperDPAHAB (left) and SuperDPAALL
(right).
B: BPND LOGAN parametric map (axial and sagittal views) from one HAB subject using
SuperDPAALL.
C: Averaged TACs of thalamus (green line with solid circle), cerebellar gray matter (solid black line) and SCA-based-reference-regions obtained with SuperDPAALL (dashed blue
line) and SuperDPAHAB/MAB (dotted red line) methods. TACs are average SUV from HABs
24
Figure 3 : BPNDLOGAN estimates of each ROI using SuperDPAALL (top), SuperDPAHAB/MAB
(middle) and the CRBGM (bottom) methods in HAB (n=7) and MAB (n=7) subjects. Error
25
Figure 4 : Relationship between BPND estimates with the arterial input function analysis
(BPNDAIF) and reference input Logan graphical analysis (BPNDLOGAN) using the
SuperDPAALL (left), SuperDPAHAB/MAB (middle) extracted reference region and the CRBGM
(right)
Figure 5 : Evaluation of intrasubject-variability (test-retest) of the [18F]DPA-714 scan
measures of each ROI using CRBGM , SuperDPAALL and SuperDPAHAB/MAB methods.
Test-retest variability is calculated as the absolute value of the difference as follows: Variability (%) = 100 x |(DVRTest –DVRReTest)| / Mean (DVRTest, DVRReTest)
26 Table 1
Table 1 : BPNDAIF and BPNDLogan correlations using the SuperDPA methods
CORRELATION ICC % RELATIVE ERROR RELATIVE ERROR SD (%) REGRESSION COEFF
ALL MAB HAB CRBGM ALL HAB MAB CRBGM ALL MAB HAB CRBGM ALL HAB MAB CRBGM ALL MAB HAB CRBGM
Thalamus 0.96 0.96 1.00 0.94 0.92 0.99 -0.53 6.37 -6.73 10.27 7.50 5.86 0.79 0.95 1.07 Cingulate 0.97 0.94 1.00 0.95 0.83 1.00 7.47 15.91 -5.67 19.28 13.69 8.97 0.81 0.97 1.13 Frontal 0.98 0.92 1.00 0.96 0.83 1.00 7.16 16.89 -3.19 19.61 15.08 5.72 0.73 0.97 0.89 Parietal 0.97 0.95 1.00 0.93 0.8 1.00 15.32 27.03 1.22 27.25 17.14 12.72 0.76 1.00 0.96 Occipital 0.90 0.96 1.00 0.88 0.83 1.00 21.95 112.52 106.30 33.86 191.23 294.73 0.79 1.00 0.96 Hipp 0.90 0.96 0.99 0.88 0.88 0.98 15.12 41.41 -6.75 42.20 34.66 47.91 0.69 0.88 0.90 WM 0.87 0.85 0.98 0.83 0.78 0.96 38.66 97.46 -34.32 118.40 170.58 37.28 0.60 0.79 0.78 Mean 0.94 0.93 0.99 0.91 0.84 0.99 15.17 45.37 23.46 38.70 64.27 59.03 0.74 0.94 0.96 SD 0.05 0.04 0.01 0.05 0.05 0.01 12.70 42.38 45.17 36.67 80.33 105.25 0.07 0.08 0.11
Correlation coefficients (r), ICC values, relative error (%), relative error standard deviation (%) and regression coefficients between BPNDAIF and BPNDLogan. The latter are estimated using SuperDPAALL, SuperDPAHAB/MAB and CRBGM (n=10, 7 HABs+ 3 MABs). Relative error is calculated against BPNDAIF.
27
TABLE 2 BPNDAIF estimates and BPNDLOGAN correlations using simulated classes.
SuperDPAALL T40 C40 CT40 Thalamus 0.94 (1.0) 0.95 (3.3) 0.93 (6.9) 0.96 (7.0) Cingulate 0.93 (4.9) 0.92 (2.4) 0.94 (14.2) 0.97 (13.9) Frontal 0.94 (6.0) 0.96 (2.8) 0.92 (14.8) 0.96 (14.5) Parietal 0.95 (4.7) 0.96 (0.7) 0.95 (15.0) 0.97 (14.7) Occipital 0.97 (13.3) 0.97 (0.2) 0.94 (23.3) 0.97 (21.6) Hippocampus 0.97 (6.7) 0.93 (22.5) 0.93 (11.0) 0.95 (10.5) White Matter 0.85 (10.7) 0.85 (13.1) 0.89 (12.7) 0.93 (11.5)
Correlation coefficients (and relative errors in %) between BPNDAIF estimates and BPNDLOGAN obtained with SuperDPAALL, SuperDPAT40, SuperDPAC40, SuperDPACT40 (n= 7 HABs) in all studied ROIs.