HAL Id: hal-02487023
https://hal.archives-ouvertes.fr/hal-02487023
Submitted on 21 Feb 2020
HAL is a multi-disciplinary open access
archive for the deposit and dissemination of
sci-entific research documents, whether they are
pub-lished or not. The documents may come from
teaching and research institutions in France or
abroad, or from public or private research centers.
L’archive ouverte pluridisciplinaire HAL, est
destinée au dépôt et à la diffusion de documents
scientifiques de niveau recherche, publiés ou non,
émanant des établissements d’enseignement et de
recherche français ou étrangers, des laboratoires
publics ou privés.
POTOMAC: towards a realistic secondary and
backscattered emission model for the multipactor
Adrien Plaçais, Mohamed Belhaj, Julien Hillairet, Jérôme Puech
To cite this version:
Adrien Plaçais, Mohamed Belhaj, Julien Hillairet, Jérôme Puech. POTOMAC: towards a realistic
secondary and backscattered emission model for the multipactor. 2019 IEEE Pulsed Power and Plasma
Science Conference, Jun 2019, ORLANDO, United States. �hal-02487023�
POTOMAC: TOWARDS A REALISTIC SECONDARY AND
BACKSCATTERED EMISSION MODEL FOR THE MULTIPACTOR
A. Plaçais
*†‡, M. Belhaj
*, J. Hillairet
†, J. Puech
‡*DPHY, ONERA, Université de Toulouse F-31055 Toulouse, France †CEA, IRFM, F-13108 Saint-Paul-Lez-Durance, France
‡CNES, DSO/RF/HNO, F-31401 Toulouse, France
Abstract
Characterized by a very fast growth of the electron population in vacuum of Radio-Frequency (RF) devices, the multipactor effect has been widely studied during the past decades. As it limits the transmitted RF power and may degrade RF devices, its understanding is primordial. Multipactor simulation tools give accurate results in the simplest cases, but are less accurate for advanced configurations: complex geometries, dielectric materials, presence of magnetic fields, etc. In such cases, an accurate modelling of the electron emission phenomena becomes essential. We extended a one-dimension electron emission (EE) model to three dimensions. The obtained model is compared to measured electron emission yields. The impact of this new model on the simulated multipactor threshold of parallel plane wave-guide is also investigated.
I. INTRODUCTION
The multipactor phenomenon is an electron avalanche that appears in RF devices when a certain RF power threshold 𝑃𝑚𝑎𝑥 is reached. Electrons enter in resonance with the RF electric field and provided that their energy is sufficient, the electron cloud (EC) grows in a few nanoseconds. The multipactor may appear in satellite payloads [1] or in nuclear fusion facilities (tokamaks) where microwave systems are used to heat the plasma [2]. In the most extreme cases, the multipactor leads to electric arcs, very destructive for the systems. The created EC may also simply disturb the RF signal, or reflect the power to the source.
When a flux of Primary Electrons (PE) impact a sample, a flux of electrons is emitted. It is composed by Secondary Electrons (SE), which are electrons removed from the material, of Elastically Backscattered Electrons (EBE), which are PE backscattered by the sample without energy loss and by Inelastically Backscattered Electrons (IBE), which are PE backscattered by the sample with energy loss. If the number of emitted electrons exceeds the number of PE, the electron population grows; in addition, if the EC enters in resonance with the RF field, the multipactor may appear.
The multipactor phenomenon is well modeled in the simplest configurations, such as metallic rectangular waveguides. However, some RF components are more complex to describe. For example, dielectrics are widely used in satellite payloads as they may allow a reduction in the size of the systems and thus a reduction in cost. In contrary to metals, dielectrics can trap a net electrical charge, which influences the electrons trajectory and thus the aforementioned resonance condition between the RF signal and the EC. Moreover, dielectrics emission properties vary with their charge. Other RF components may present magnetic fields or complex geometries. These features complicate the problematic, pushing constructors to increase their safety margins. A simulation code called POTOMAC (Physical simulatiOn TOol for Multipactor in Advanced Configurations) was developed to model this kind of systems. The choice of the Electron Emission (EE) model can lead to huge variations in multipactor simulations [3], [4]. Thus, a precise modelling of the multipactor requires an accurate modelling of the EE phenomena.
II. ELECTRON EMISSION PHENOMENA
A. Electron Emission model
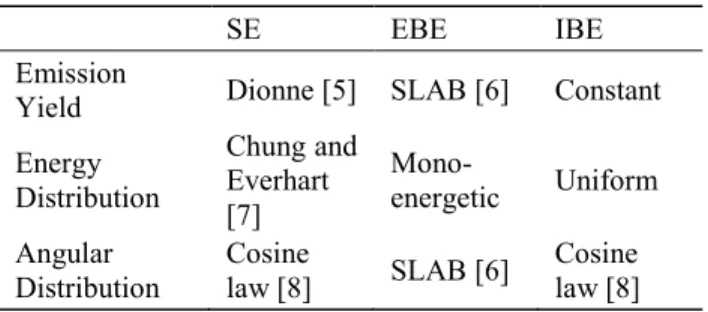
Table 1. POTOMAC Electron Emission model.
SE EBE IBE
Emission
Yield Dionne [5] SLAB [6] Constant Energy Distribution Chung and Everhart [7] Mono-energetic Uniform Angular
Distribution Cosine law [8] SLAB [6] Cosine law [8] In order to model the EE phenomena, we need to describe precisely for each of the electrons populations their angular and energetic distribution, as well as their emission yield. All these quantities rely on the incidence angle and energy of the PE, along with the surface state of the sample or the presence of contaminants. The emission yield is the number of emitted electrons divided by the
number of impinging electrons. As this quantity conditions the apparition of the multipactor, its study is very important. We detailed the full EE model used in POTOMAC in Table 1.
Numerous models for the Secondary Electron Emission Yield (SEEY) exist, but they suffer from either a lack of precision [9], are too slow for the implementation in a PIC code [10], [11], or cannot discriminate the SE from EBE and IBE [12]. This is why we choose to use Dionne model [5].
B. One-dimension Dionne model
We make here the commonly used assumptions the constant energy loss law of PE [16] and that the three dimensions scattering of secondary electrons is negligible. Then, the SEEY can be expressed as:
𝛿 = 𝐺 ⋅ 𝑇 ⋅ 𝑆 (1)
Where 𝐺 is the generation term given by Eq. (2), 𝑇 the transmission term by Eq. (3) and 𝑆 is the constant escape term.
𝐺 = 𝐸0 𝑅 ⋅ 𝑊𝑓
(2) 𝑇 = 𝑑 ⋅ (1 − e−𝑅/𝑑) (3) In these expressions, 𝐸0 is the energy of the PE and 𝑊𝑓 the material work function, both defined prior to the vacuum level and in eV. 𝑑 is the diffusion length of electrons in the material in nm and 𝑅 the range of the PE in nm, given by:
𝑅 = 𝐸0 𝑛
𝐴 ⋅ 𝑛 (4)
With 𝐴 and 𝑛 fitting parameters. The range is the depth reached by PE. All the constitutive terms of this model have a physical sense. It is for example possible to modify 𝑆 in order to take into account for the presence of thin layers on top of the materials [13], [14] or 𝑑 to consider the influence of dielectrics charge [15]. However, this model does not take into account the incidence angle of PE, which is mandatory to work with magnetic fields among others. C. Three-dimensions Dionne model
We calculated the variation in range due to the modification of the incidence angle. We took into account the refraction of electrons due to the surface potential step [17]. We propose to replace the expression of the range in Eq. (4) by the following expression:
𝑅 = 𝐸0 𝑛 𝐴 ⋅ 𝑛⋅ √1 − 𝐸0 𝐸0+ 𝑊𝑓 ⋅ sin2𝑘𝜃 (5)
Where the incidence angle 𝜃 is defined prior to the sample normal and where 𝑘 is a phenomenological parameter. An increase in the incidence angle 𝜃 leads to a reduction of 𝑅. As a matter of fact, PE cannot penetrate so
deep in the material when 𝜃 is high. Consequently, SE are emitted closer to the sample surface and are more likely to reach the surface and to be emitted.
We noticed that omitting 𝑘 led to an overestimation of 𝛿. Indeed, due to the fact that technical materials present a random surface morphology, an electron impinging the sample with a macroscopic angle 𝜃 will be likely to hit the sample with a microscopic angle different from 𝜃. Thus, 𝑘 is a phenomenological parameter that represents the difference between the macroscopic and microscopic incidence angles.
III.
EXPERIMENTAL VERIFICATION
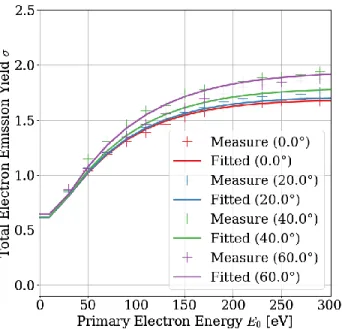
Figure 1. Fit on Cu #1 TEEY measurements, with 𝑘 = 0.91
We made Total Electron Emission Yield (TEEY) measurements on two copper samples, previously heated at 200°C in situ for two hours. The first sample (Cu #1) was polished whereas the second one (Cu #2) was left rough. We made the measurements at the ONERA under very high vacuum conditions (10−9 mbar).
The TEEY, 𝜎 is the sum of the SEEY 𝛿, of the Elastically Backscattered Electron Emission Yield (EBEEY) 𝜂𝑒 and of the Inelastically Backscattered Electron Emission Yield (IBEEY) 𝜂𝑖 as shown in Eq. (6).
𝜎 = 𝛿 + 𝜂𝑒+ 𝜂𝑖 (6)
We computed the EBEEY with the Monte-Carlo based model SLAB [6] and fitted 𝜎 − 𝜂𝑒= 𝛿 + 𝜂𝑖, with Dionne model for 𝛿 and a constant model for 𝜂𝑖. Simulations in POTOMAC highlighted the fact that all PE had energies
below 300 eV and most of them hit the surfaces quasi-normally. Thus, our model should be valid for energies 𝐸0∈ [0 eV; 300 eV] and incidence angles 𝜃0∈ [0°; 20°]. Fig. 1 shows a fit of the three-dimensions model on the polished copper sample. It reproduces the measure points correctly for the normal and 20° incidences. As the sample was polished, macroscopic and microscopic angles are very close and 𝑘 is close to unity. The fit is not as good for the 40° and 60° incidences.
Figure 2. Fit on Cu #2 TEEY measurements, with 𝑘 = 0.54
A fit on the rough copper sample is presented Fig. 2. As this sample was not polished, 𝑘 is very far from unity. As for the first sample, the extended Dionne model works for the low incidences but deviates at higher incidences. It is interesting to see that, for this sample, the measured SEEY is higher at 40° than at 60°. Our hypothesis is that this is due to surface morphology induced differences between microscopic and macroscopic angles.
IV.
MULTIPACTOR RESULTS
Figure 3. Sketch of the simulated geometry in POTOMAC
Multipactor simulations were led on an infinite parallel-plate configuration, the parallel-plates being separated by a distance of 0.1 mm. The RF signal 𝐸𝑅𝐹 has a frequency 𝑓 = 17.2 GHz. Both plates have the same emission properties as the sample Cu #2. A first simulation was made with the original Dionne model, and a second one with the three-dimensions Dionne model. A static difference of potential was applied between the plates in order to simulate the presence of a dielectric charged on one of the plates. 100 seed electrons were injected during the three first RF periods, and we considered that the multipactor was reached when the electron population went up to 500 electrons. The simulated geometry is represented Fig. 3.
The simulation results are represented Fig. 4. The x-axis is the potential difference between the plates in V, and the y-axis the multipactor power variation in dB. Even if the new Dionne model did not change the multipactor dynamics at stake [18], it showed slight variations in the results.
V. CONCLUSIONS
The Dionne model for the SEEY was extended to three-dimensions. The inclusion of a new phenomenological parameter was required in order to take into account the differences between macroscopic and microscopic incidence angles. This model was compared to TEEY measurements and fitted relatively well for low angles. A more detailed description of the samples surface morphology would be required in order to fit higher incidences angles. This model induced slight modifications in multipactor results in a simple parallel-plate configuration.
The EE model is yet to be improved. SLAB model for the EBE will be replaced by the more accurate OKGM model [19]. As the constant emission yield for the IBE is a
first order approximation, Monte-Carlo simulations will be led in order to enhance the model. Magnetic fields will be included in POTOMAC.
VI.
ACKNOWLEDGMENTS
This work has been carried out within the framework of the EUROfusion Consortium and has received funding from the Euratom research and training programme 2014-2018 and 2019-2020 under grant agreement No 633053. The views and opinions expressed herein do not necessarily reflect those of the European Commission.
VII. REFERENCES
[1] J. de Lara et al., “Multipactor prediction for on-board spacecraft RF equipment with the MEST software tool,” IEEE Trans. Plasma Sci., vol. 34, no. 2, pp. 476–484, Apr. 2006.
[2] M. Goniche et al., “Modelling of power limit in RF antenna waveguides operated in the lower hybrid range of frequency,” Nucl. Fusion, vol. 54, no. 1, p. 013003, Jan. 2014.
[3] M. S. Feldman, A. A. Hubble, R. Spektor, and P. T. Partridge, “Effects of Backscattered Electrons on Multipactor Simulations with Parallel Magnetic Fields,” in 2018 IEEE MTT-S International
Conference on Numerical Electromagnetic and Multiphysics Modeling and Optimization (NEMO),
2018, pp. 1–3.
[4] N. Fil, M. Belhaj, J. Hillairet, and J. Puech, “Multipactor threshold sensitivity to Total Electron Emission Yield in parallel-plate waveguide and TEEY models accuracy,” in 2016 IEEE MTT-S
International Microwave Symposium (IMS), 2016,
vol. 23, no. 1, pp. 1–4.
[5] G. F. Dionne, “Effects of secondary electron scattering on secondary emission yield curves,” J.
Appl. Phys., vol. 44, no. 12, pp. 5361–5364, Dec.
1973.
[6] A. Jablonski, P. Mrozek, G. Gergely, M. Menhyárd, and A. Sulyok, “The inelastic mean free path of electrons in some semiconductor compounds and metals,” Surf. Interface Anal., vol. 6, no. 6, pp. 291–294, Dec. 1984.
[7] M. S. Chung and T. E. Everhart, “Simple calculation of energy distribution of low-energy secondary electrons emitted from metals under electron bombardment,” J. Appl. Phys., vol. 45, no. 2, pp. 707–709, Feb. 1974.
[8] J. Greenwood, “The correct and incorrect generation of a cosine distribution of scattered particles for Monte-Carlo modelling of vacuum systems,” Vacuum, vol. 67, no. 2, pp. 217–222, Sep. 2002.
[9] S. Barral, K. Makowski, Z. Peradzyński, N. Gascon, and M. Dudeck, “Wall material effects in stationary plasma thrusters. II. Near-wall and in-wall conductivity,” Phys. Plasmas, vol. 10, no. 10, pp. 4137–4152, Oct. 2003.
[10] C. Inguimbert, J. Pierron, M. Belhaj, and J. Puech, “An analytical model for secondary electron emission,” in MULCOPIM, 2017.
[11] C. Inguimbert, J. Pierron, M. Belhaj, and J. Puech, “Extrapolated Range Expression for Electrons Down to ~10 eV,” in NSREC, 2016.
[12] J. R. M. Vaughan, “Secondary emission formulas,”
IEEE Trans. Electron Devices, vol. 40, no. 4, p.
830, Apr. 1993.
[13] J. Cazaux, “Calculated influence of work function on SE escape probability and Secondary Electron Emission yield,” Appl. Surf. Sci., vol. 257, no. 3, pp. 1002–1009, Nov. 2010.
[14] A. Plaçais, E. Sorolla, M. Belhaj, J. Hillairet, and J. Puech, “Influence of work function on the multipactor threshold,” in 2018 IEEE MTT-S
International Conference on Numerical Electromagnetic and Multiphysics Modeling and Optimization (NEMO), 2018, pp. 1–4.
[15] N. Balcon, M. Belhaj, T. Tondu, J. C. Mateo-Velez, and D. Payan, “Secondary electron emission of cover glasses: Temperature and incident flux effects,” in International Symposium
on Materials in the Space Environment, 2013.
[16] J. R. Young, “Penetration of Electrons and Ions in Aluminum,” J. Appl. Phys., vol. 27, no. 1, pp. 1–4, Jan. 1956.
[17] C. Weisbuch, H. Benisty, D. Labilloy, R. Houdré, R. P. Stanley, and M. Ilegems, Confined Electrons
and Photons, vol. 340. Boston, MA: Springer US,
1995.
[18] E. Sorolla, M. Belhaj, J. Sombrin, and J. Puech, “New multipactor dynamics in presence of dielectrics,” Phys. Plasmas, vol. 24, no. 10, p. 103508, Oct. 2017.
[19] A. Jablonski, “Angular distribution of elastic electron backscattering from surfaces: determination of the electron inelastic mean free path,” J. Phys. D. Appl. Phys., vol. 47, no. 5, p. 055301, Feb. 2014.