PCR-based analysis of microbial
communities during the EuroGeoMars
campaign at Mars Desert Research Station,
Utah
Cora S. Thiel
1, Pascale Ehrenfreund
2, Bernard Foing
3, Vladimir Pletser
4and
Oliver Ullrich
5,6,71
Institute of Medical Physics and Biophysics, CeNTech, University of Muenster, Heisenbergstrasse 11, D-48149 Muenster, Germany
e-mail: [email protected]
2Leiden Institute of Chemistry, Leiden University, Einsteinweg 55, NL-2300 RA, Leiden, The Netherlands 3
Science and Robotic Exploration Directorate, European Space Agency, ESTEC, P.O. Box 299, NL-2200 AG, Noordwijk, The Netherlands
4
Human Space Flight Directorate, European Space Agency, ESTEC, P.O. Box 299, NL-2200 AG, Noordwijk, The Netherlands
5
Institute of Anatomy, Faculty of Medicine, University of Zurich, Winterthurerstrasse 190, CH-8057 Zurich, Switzerland 6Department of Machine Design, Engineering Design and Product Development, Institute of Mechanical Engineering, Otto-von-Guericke-University Magdeburg, Universitätsplatz, D-39106 Magdeburg, Germany
7Zurich Center for Integrative Human Physiology (ZIHP), University of Zurich, Winterthurerstrasse 190, CH-8057 Zurich, Switzerland
Abstract: The search for evidence of past or present life on Mars will require the detection of markers that indicate the presence of life. Because deoxyribonucleic acid (DNA) is found in all known living organisms, it is considered to be a‘biosignature’ of life. The main function of DNA is the long-term storage of genetic information, which is passed on from generation to generation as hereditary material. The Polymerase Chain Reaction (PCR) is a revolutionary technique which allows a single fragment or a small number of fragments of a DNA molecule to be amplified millions of times, making it possible to detect minimal traces of DNA. The compactness of the contemporary PCR instruments makes routine sample analysis possible with a minimum amount of laboratory space. Furthermore the technique is effective, robust and straightforward. Our goal was to establish a routine for the detection of DNA from micro-organisms using the PCR technique during the EuroGeoMars simulation campaign. This took place at the Mars Society’s Mars Desert Research Station (MDRS) in Utah in February 2009 (organized with the support of the International Lunar Exploration Working Group (ILEWG), NASA Ames and the European Space Research and Technology Centre (ESTEC)). During the MDRS simulation, we showed that it is possible to establish a minimal molecular biology lab in the habitat for the immediate on-site analysis of samples by PCR after sample collection. Soil and water samples were taken at different locations and soil depths. The sample analysis was started immediately after the crew returned to the habitat laboratory. DNA was isolated from
micro-organisms and used as a template for PCR analysis of the highly conserved ribosomal DNA to identify representatives of the different groups of micro-organisms (bacteria, archaea and eukarya). The PCR products were visualized by agarose gel electrophoresis and documented by transillumination and digital imaging. The microbial diversity in the collected samples was analysed with respect to sampling depth and the presence or absence of vegetation. For thefirst time, we have demonstrated that it is possible to perform direct on-site DNA analysis by PCR at MDRS, a simulated planetary habitat in an extreme environment that serves as a model for preparation and optimization of techniques to be used for future Mars exploration.
Received 15 December 2010, accepted 9 February 2011, first published online 22 March 2011
Key words: astrobiology, life detection, Mars Desert Research Station, microbial communities, PCR instrumentation, ribosomal DNA.
Introduction
The search for evidence of life on Mars will rely on the detection of biomolecules and universal markers (Fajardo-Cavazos et al.2010). Due to their unique role in storing the
genetic information of all forms of life on Earth, nucleic acids, specifically DNA, have been considered a ‘biosignature’
of life (Lyon et al.2010). DNA is able to attach and bind
to mineral surfaces (Cleaves et al.2010) and survive strong UV exposure whilst retaining biological activity if bound to
surfaces in plasmid form (Lyon et al. 2010). Additionally, recent studies indicate that forward-contaminant DNA could exist for considerable periods of time on the Martian surface (Fajardo-Cavazos et al.2010).
Due to significant meteoritic exchanges between Mars and
Earth, there is a reasonable chance that potential past or present life on Mars could be related to life on Earth. Impact-induced ejections of rocks from planetary surfaces were frequent events in the early history of the solar system and
have been considered possible first steps in the potential
interplanetary transfer of micro-organisms (Moeller et al.
2008). Thus, the search for DNA on Mars could lead to a
significant insight: if potential Martian life is based on DNA, this would strongly suggest a common origin of life on Earth and Mars. For this search, supremely sensitive technologies used to study life on Earth, including life in extreme environments, can be applied to the search for life on other planets (Isenbarger et al. 2008). Interestingly, identi fi-cation of bacterial communities by DNA extraction has already been successfully performed in other extreme conditions such as Australian hypersaline environments
with extremely low pH (Mormile et al. 2009), the
Antarctic Dry Valleys which include some of the coldest, driest and most oligotrophic soils (Cary et al.2010) and the Atacama Desert of northern Chile which is one of the most
arid deserts on Earth (Drees et al. 2006; Connon et al.
2007).
In order to assess several human and scientific aspects
of future robotic and manned missions on planetary surfaces, the EuroGeoMars campaign was performed as part of the
ExoGeoLab pilot project developed at ESTEC/ESA
(European Space Agency) in collaboration with ILEWG,
NASA Ames and European and US investigators (Foing2009;
Ehrenfreund et al.2010; Foing et al.2010; Ehrenfreund et al. 2011; Foing et al.2011) at the Mars Desert Research Station.
The MDRS is a Mars analogue research station (Fig. 1(a)),
situated in the San Rafael Swell in Utah, about 7 miles from Hanksville. The primary goal of our study was to test the possibility of analysing soil samples for microbial life, on-site in the habitat’s laboratory. We wanted to establish a routine sample analysis for the detection of microbial DNA based on the polymerase chain reaction (PCR) technique, going far beyond the techniques that other MDRS crews had previously used, such as microscopic analysis or the conventional cultivation of microbial samples on agar or other nutrient
media (MDRS crews 1b, 7, 11, 44, 52 in Secosky 2008).
The PCR is an effective tool to identify trace amounts of DNA, ideally down to the level of a single molecule (Saiki et al. 1985; Mullis & Faloona 1987; Sermon & De Rycke2007). The establishment of such a technique would be a powerful tool for the detection of traces of life, since non-culturable micro-organisms or even endospores could be detected as well.
Soils and sediments often contain DNA that can be
amplified by PCR (Hofreiter et al. 2003; Willerslev et al.
2003) and bacterial DNA sequences have been found in
sediments that go back over half a million years (Willerslev
et al.2004). Therefore, there is the possibility that DNA bound to minerals (Cleaves et al.2010; Lyon et al.2010) could exist on
the Martian surface (Fajardo-Cavazos et al. 2010) and be
accessible for analysis. For the ultimate goal of analysing soil samples from Mars on-site, a sensitive, robust and reliable detection method has to be developed, optimized and tested under Mars analogue conditions.
Material and methods
Instruments for the PCR experiment at MDRS
All instruments and consumables were evaluated for their usability in biological experiments at MDRS in pre-mission tests in a conventional laboratory as well as at ESTEC in The Netherlands. The following instruments were shipped to MDRS: a precision balance (Satorius, Germany) used
to weigh 0.25 g of soil sample for the DNA purification,
a Vortex (vortex genie2, Fisher Scientific, Germany) and
a centrifuge (EPP cent mini spin plus, Eppendorf, Germany) required for DNA extraction. A glove box (self-built) was
used to pipette the PCR mixtures. Fragment amplification
from sample DNA was performed in the thermal cycler Primus 25 advanced (Peqlab, Germany). PCR fragments were separated according to their molecular weights and viewed with 1.2% agarose E-Gels containing SYBRsafe (Invitrogen,
Germany) using the E-Gel iBase system (Invitrogen,
Germany) and viewed with the E-Gel Safe Imager Real-time Transilluminator (Invitrogen, Germany). Agarose gels were documented with a digital camera (Coolpix 995, Nikon) on a tripod.
Sample collection
It was decided before the mission that samples would be collected at different depths (0 to−2, −10, −30 cm) in places both without and near vegetation in order to compare the microbial content. Samples were intended to be taken by drilling and soil should have been taken from the drilling core by measuring the desired depths. Unfortunately, it became clear during the mission that the soil was too dry and it was not possible to obtain an intact drilling core. Additionally,
sampling down to−30 cm was often not possible because of
the stony or solid-clay soil structure. Therefore, soil samples were collected with a shovel, and sterile soil sampling spatulas. After arriving at the chosen sampling location (Table 1), the ground was examined and a location without any visible human or animal traces was chosen. We followed this strategy because we did not want to have false positive micro-organisms in our samples that would invalidate the analysis of the microbial communities’ content. For the sampling, all collecting instruments (shovel, soil-sampling spatula) were sterilized by wiping them with 70% ethanol solution to remove
any contamination. Surface samples (0 to−2 cm depth) were
directly collected with a sterile spatula. For sampling depths
of−10 and −30 cm, a hole was dug with a sterilized shovel
and the soil samples were taken from the side of the hole with a sterile spatula to avoid contamination from the upper soil
178 Cora S. Thielet al.
https:/www.cambridge.org/core/terms. https://doi.org/10.1017/S1473550411000073
layers. Samples were transferred into sterile sampling bags (VWR International, Germany) and stored until return to the habitat laboratory. The shovel was wiped with 70% ethanol between the different sampling steps and for each sampling a new, sterile spatula was used.
DNA extraction methods
The DNA extraction was performed using the PowerSoil DNA Isolation Kit (MOBIO Laboratories, USA). This extraction method allows genomic DNA to be isolated from environ-mental samples containing a high humic acid content, which usually impairs DNA quality and hinders subsequent
enzy-matic reactions such as PCR amplification of microbial DNA.
According to the manufacturer, this kit can be used to extract DNA from various soil types, such as compost, sediment and manure.
The DNA was extracted from the soil samples as follows: 0.25 g of soil, accurately measured with a scale, was taken from the collected soil in the sterile sampling bag and added to the supplied bead-beating tube before being mixed by vortexing. Then 60μl of the lysis solution C1 was added to the tube and the mixture was briefly vortexed. The sample tube was
taped to theflat-bed vortex and vortexed at maximum speed
for 10 minutes. Thereafter, the tube was centrifuged at 10 000 g for 30 seconds at room temperature. The supernatant was
transferred to a clean 2 ml collection tube. Then 250μl of
solution C2 was added to precipitate the non-DNA organic and inorganic material including humic substances, cell debris and proteins. After vortexing the solution for 5 seconds and incubation for 5 minutes at 4 °C, the tube was centrifuged at room temperature for 1 minute at 10 000 g. A maximum
volume of 600μl of supernatant was transferred into a clean collection tube. Then 200μl of C3 solution, a second reagent to precipitate additional non-DNA organic and inorganic material, was added and the mixture was incubated at 4 °C for 5 minutes. After centrifugation for 1 minute at room
temperature at 10 000 g, a maximum volume of 750μl of
supernatant was transferred into a clean collection tube. The solution was mixed with 1200μl of C4, a high salt solution, and vortexed for 5 seconds. 675μl of this solution was then loaded
onto a spin filter and centrifuged for 1 minute at 10000 g
at room temperature to bind the DNA to the silica material. The rest of the solution was loaded onto the membrane in a second centrifugation step. 500μl of the ethanol-based wash solution C5 was pipetted onto the silica membrane, the tube was centrifuged for 30 seconds at 10 000 g and theflow through was discarded. After a second centrifugation step, the silica membrane was transferred to a clean collection tube and 100μl of elution buffer C6 (10 mM TrisCl, pH 8) was added to the centre of the membrane. The DNA was eluted by centrifu-gation at room temperature for 30 seconds at 10 000 g and then stored in the freezer compartment of the laboratory fridge until it was used for PCR. (For a detailed DNA extraction protocol,
including buffer C1–C6 application, see the manufacturer’s
manual: http://www.mobio.com/images/custom/file/protocol/
12888.pdf).
In order to test for potential sample contamination by
microbial or human DNA due to dust and airflow in the
MDRS laboratory, the DNA extraction procedure was also performed with 0.25 g of sterile water instead of soil and the eluate was used as a negative control for PCR analysis.
Fig. 1. The Mars Desert Research Station. (a) The habitat, the green house and the All Terrain Vehicles are shown (Credit: The Mars Society). (b) The newly installed molecular biology laboratory at MDRS. Vortex, balance, centrifuge, PCR machine and glove box are shown
(Credit: EuroGeoMars crew 77). (c) Firstfloor of the MDRS habitat. The molecular biology working area is highlighted in red (Credit: The Mars Society).
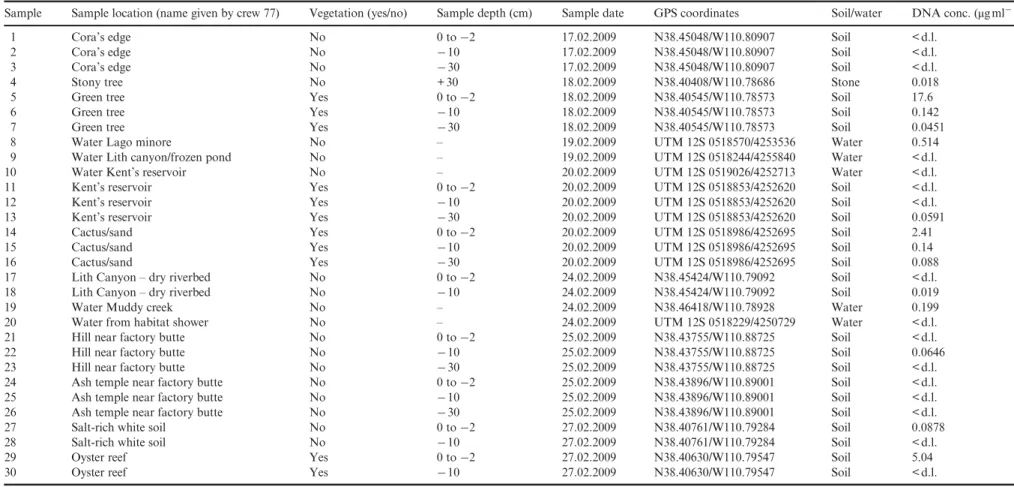
Table 1. Description of the sites chosen for collection of soil samples
Sample Sample location (name given by crew 77) Vegetation (yes/no) Sample depth (cm) Sample date GPS coordinates Soil/water DNA conc. (μgml− 1)
1 Cora’s edge No 0 to−2 17.02.2009 N38.45048/W110.80907 Soil < d.l.
2 Cora’s edge No −10 17.02.2009 N38.45048/W110.80907 Soil < d.l.
3 Cora’s edge No −30 17.02.2009 N38.45048/W110.80907 Soil < d.l.
4 Stony tree No + 30 18.02.2009 N38.40408/W110.78686 Stone 0.018
5 Green tree Yes 0 to−2 18.02.2009 N38.40545/W110.78573 Soil 17.6
6 Green tree Yes −10 18.02.2009 N38.40545/W110.78573 Soil 0.142
7 Green tree Yes −30 18.02.2009 N38.40545/W110.78573 Soil 0.0451
8 Water Lago minore No – 19.02.2009 UTM 12S 0518570/4253536 Water 0.514
9 Water Lith canyon/frozen pond No – 19.02.2009 UTM 12S 0518244/4255840 Water < d.l.
10 Water Kent’s reservoir No – 20.02.2009 UTM 12S 0519026/4252713 Water < d.l.
11 Kent’s reservoir Yes 0 to−2 20.02.2009 UTM 12S 0518853/4252620 Soil < d.l.
12 Kent’s reservoir Yes −10 20.02.2009 UTM 12S 0518853/4252620 Soil < d.l.
13 Kent’s reservoir Yes −30 20.02.2009 UTM 12S 0518853/4252620 Soil 0.0591
14 Cactus/sand Yes 0 to−2 20.02.2009 UTM 12S 0518986/4252695 Soil 2.41
15 Cactus/sand Yes −10 20.02.2009 UTM 12S 0518986/4252695 Soil 0.14
16 Cactus/sand Yes −30 20.02.2009 UTM 12S 0518986/4252695 Soil 0.088
17 Lith Canyon– dry riverbed No 0 to−2 24.02.2009 N38.45424/W110.79092 Soil < d.l.
18 Lith Canyon– dry riverbed No −10 24.02.2009 N38.45424/W110.79092 Soil 0.019
19 Water Muddy creek No – 24.02.2009 N38.46418/W110.78928 Water 0.199
20 Water from habitat shower No – 24.02.2009 UTM 12S 0518229/4250729 Water < d.l.
21 Hill near factory butte No 0 to−2 25.02.2009 N38.43755/W110.88725 Soil < d.l.
22 Hill near factory butte No −10 25.02.2009 N38.43755/W110.88725 Soil 0.0646
23 Hill near factory butte No −30 25.02.2009 N38.43755/W110.88725 Soil < d.l.
24 Ash temple near factory butte No 0 to−2 25.02.2009 N38.43896/W110.89001 Soil < d.l.
25 Ash temple near factory butte No −10 25.02.2009 N38.43896/W110.89001 Soil < d.l.
26 Ash temple near factory butte No −30 25.02.2009 N38.43896/W110.89001 Soil < d.l.
27 Salt-rich white soil No 0 to−2 27.02.2009 N38.40761/W110.79284 Soil 0.0878
28 Salt-rich white soil No −10 27.02.2009 N38.40761/W110.79284 Soil < d.l.
29 Oyster reef Yes 0 to−2 27.02.2009 N38.40630/W110.79547 Soil 5.04
30 Oyster reef Yes −10 27.02.2009 N38.40630/W110.79547 Soil < d.l.
< d.l.: DNA concentration below detection limit.
180 Co ra S. Thiel et al . https:/www.cambridge.org/core/terms . https://doi.org/10.1017/S1473550411000073 Downloaded from https:/www.cambridge.org/core
. University of Basel Library
, on
30 May 2017 at 14:43:52
Quantification of DNA content in collected soil samples
The amount of DNA after purification with the PowerSoil
DNA Isolation Kit (MOBIO Laboratories, USA) was analysed by using the Qubit dsDNA HS assay kit in com-bination with the Qubit Fluorometer (Invitrogen, Germany).
The assay uses the fluorescent dye PicoGreen that binds to
double stranded (ds)DNA leading to an enhancement in fluorescence. This method is up to 1000 times as sensitive as UV absorbance readings and therefore suitable for very
low sample concentrations (1–500 ngml− 1). Moreover, the
measurement is unaffected by many contaminants such as free nucleotides, salts, solvents and proteins. The measurement was performed according to the manufacturer’s protocol (http:// probes.invitrogen.com/media/pis/mp32851.pdf). In brief, 10μl
of the supplied standard solutions or the purified DNA
samples was mixed with 190μl of the Qubit working solution
(dsDNA HS reagent:Qubit dsDNA HS buffer, 1:200). The reactions were incubated at room temperature for 2 minutes
before measurement of fluorescence with the Qubit
Fluorometer and calculation of DNA concentration (Table 1). PCR fragment amplification and visualization
DNA extracted from the soil samples was used in PCR experiments with specific primers for each of the three
domains: bacteria, archaea and eukarya (fungi). One μl of
the DNA extracted from the 0.25 g of soil with the PowerSoil DNA isolation kit was used per PCR mixture (consisting of:
specific primers (Table 2) and Taq PCR MasterMix Kit
components (Qiagen, Germany)). PCR amplifications were performed with this basic protocol: initial denaturation at 94 °C for 5 minutes, 30 cycles of denaturation at 94 °C for 1 minute, annealing at variable temperatures (seeTable 2) for 45 seconds, elongation at 72 °C for variable times (seeTable 2), final-elongation at 72 °C for 10 minutes. In order to prevent cross-contamination with micro-organisms from room air or raised dust, a glove box was used to prepare the PCRs. The
DNA was amplified in 30 cycles using a Primus25 advanced
cycler (PeqLab, Germany) with optimized parameters for the different primer sets (Table 2). Afterwards, the PCR samples
(25μl) were applied onto a 1.2% agarose gel containing the
SYBRsafe DNA gel stain dye (E-Gel 1.2% with SYBRsafe, Invitrogen, Germany) next to a molecular weight marker as a fragment length standard (TRACKIT 100 bp DNA ladder, Invitrogen, Germany) and run for 26 minutes in the E-Gel iBase system (Invitrogen, Germany). A digital picture (Coolpix 995, Nikon) of the gel was taken on the E-Gel Safe Imager
Real-time Transilluminator (Invitrogen, Germany) under the amberfilter (blue light filter for eye protection).
After the mission, all of the collected samples were re-analyzed using the PCR technique in a laboratory at Mesa State College in Grand Junction, Colorado, using the same PCR mixture components and PCR programmes as for the MDRS experiments. Unfortunately, the agarose gel visualiza-tion system had to remain in the laboratory at MDRS and the agarose gel preparation, staining and documentation of the sample re-analysis in the college laboratory had to be per-formed differently. The PCR samples were run on a 1% unstained agarose gel in TAE buffer. A 1 kb DNA ladder (1 kb Plus DNA Ladder Fermentas, Germany) was used as a molecular weight marker. The gel was run for 30 minutes and an ethidium bromide containing card (InstaStain Ethidium Bromide, EDVOTEK, USA; http://www.edvotek.com/pdf/ instastain_ethidium.pdf), was placed onto the gel for 2–4 minutes to stain the DNA. Although this is not the standard method for staining weak amplification products, it was the routine staining method in the Mesa College Laboratory. The gels were placed on an UV-transilluminator and documented with an imaging system.
Results
Pre-mission tests for instrument selection
The biology experiment of MDRS crew 77 was tested beforehand in the home laboratory of one of the authors to select the most adequate instruments and techniques for identifying microbial DNA by PCR. The optimal PCR conditions were analysed for the different primer sets specific for bacteria, fungi and archaea. Optimal PCR fragment amplification conditions such as annealing temperature, elongation time and cycle number were identified (Table 2) using Escherichia coli DNA or microbial DNA isolated from garden soil (Fig. 2) as positive controls for the PCR (Fig. 3). A PCR with bacterial primers was performed on the DNA extracted from 2 MDRS test samples to complete the pre-mission test at ESTEC (Fig. 3). All necessary instruments and consumables were tested for their versatility and easiness of future use in a small laboratory such as the one at MDRS. Emphasis was placed on easy handling, a limited number of procedure steps, non-toxicity and a minimum amount of working space. The experimental equipment was transported
to ESTEC in the Netherlands for thefinal pre-mission test
(Fig. 3) and shipped to MDRS to be installed and functionally Table 2. PCR primers and conditions
Primer combination Forward primer (5′−3′) Reverse primer (5′−3′)
Annealing
temperature Elongation time Source 27F/1492R (bacterial primers) 27F
agagtttgatcctggctcag
1492R
ggttaccttgttacgactt
55 °C 3 minutes Lane (1991)
ITS1/ITS4 (fungal primers) ITS1
tccgtaggtgaacctgcgg
ITS4
Tcctccgcttattgatatgc
52 °C 2 minutes White et al. (1990)
Arch21F/Arch958R (archaeal primers) Arch21F ttccggttgatccygccgga Arch958R yccggcgttgamtccaatt 55 °C 3 minutes De Long (1992)
tested in the laboratory by the technical crew and crews 76 and 77 (Fig. 1(b) and (c)).
Soil sampling
In total, 25 soil samples were collected (Table 1). The soil sample collection sites can be divided into two categories: (i) without vegetation (Fig. 4) and (ii) close to sparse vegetation that consisted of small bushes or grass (Fig. 5). Additionally, 5 water samples were collected and microbial DNA was extracted to test the versatility of the experimental set-up for future missions within a liquid sample setting (Table 1, Fig. 6).
DNA extraction and PCR
Microbial DNA was immediately isolated from the soil samples with the PowerSoil DNA Isolation Kit after return to the MDRS laboratory and stored in the freezer compart-ment of the laboratory fridge until PCR analysis. Long-term storage of collected soil samples was avoided because this would modify growth conditions and could impair the viability of some micro-organisms, leading to a change in microbial content. Because of the different requirements of the scientists who were working at MDRS laboratory working hours were divided. While geologists needed to crush their samples, e.g. for X-ray diffraction spectroscopy, which produced a lot of dust, molecular microbiology analysis needed a clean and dust-free working area. In particular, the PCR is a highly sensitive technique and the smallest traces of contamination lead to false positive results. This technical challenge was addressed by defining alternating working hours for the scientist groups, including negative controls in the experiments, as well as the
usage of a glove box (Fig. 1(b)) to prevent contamination
during pipetting of the PCR components. PCR runs were performed according to the optimized reaction conditions (Table 2). The amplified DNA fragments were visualized directly after the PCR by using agarose gels with SYBRsafe staining and a digital imaging for recording. All the PCR
experiments performed at MDRS are shown in Fig. 7and
summarized in Table 3. There was no cross-contamination
detectable, which, would have been immediately visible in the negative control included for each PCR experiment as well as in the negative control prepared to monitor the DNA
purification. As experiment time was limited due to various
other habitat maintenance chores that had to be performed (Thiel et al.2011), only 26 out of 30 samples were analysed by PCR for their bacterial and fungal content at MDRS (Fig. 7). The remaining 4 samples were analysed the day after the mission in a laboratory at Mesa State College in Grand Junction, Colorado. In total, it was possible to detect bacterial DNA in 14 and fungal DNA in 8 of the 26 analysed samples. The concentration of the DNA extracted from the soil samples was analysed in the home laboratory of one of the authors after the mission (Table 1). Due to the expected low levels of DNA content, a technique using a DNA-binding fluorescent dye was applied, which enhances the sensitivity by about 1000-fold compared to UV absorbance measurements (see Material and methods section). DNA concentration
ranged from 0.018 to 17.6μgml− 1. It is remarkable that
despite the very low DNA concentration, which was below the detection limit in about 50% of the samples (seeTable 1), it was still possible to detect the presence of micro-organisms with this established PCR assay.
PCR analysis quality at MDRS
Directly after the mission, all samples were re-analysed in a conventional laboratory setting at Mesa State College using the same bacterial, fungal and archaeal primers such as at MDRS (Fig. 8,Table 3). The direct comparison of PCR results
1
2
3
4
20 kb
Fig. 2. Detection of DNA extracted from a soil sample by the PowerSoil DNA Isolation Kit. 1, 4: commercially molecular weight marker as a fragment length standard (1 kb Plus DNA Ladder; the 20 kilo base pairs (kb) fragment is indicated); 2, 3: 10μl of purified DNA from a compost soil sample.
(a) (b)
1
2
3
4
1
2
3
4
5
1.5 kb 1.5 kb
Fig. 3. Pre-mission PCR test. Reaction conditions were optimized for the identification of bacterial DNA in the collected soil samples. (a) Agarose gel showing the amplified DNA fragments of the pre-mission test performed with the garden soil sample. 1: Commercially available molecular weight marker as a fragment length standard (1 kb Plus DNA Ladder; the 1.5 kb fragment is indicated); 2: negative control containing all reaction components but no DNA; 3: DNA extracted from garden soil sample; 4: positive control containing E. coli DNA 2–4: 25 μl of the PCR mixture was applied to the agarose gel. (b) Agarose gel showing the amplified DNA fragments of the pre-mission test performed with the soil samples collected at MDRS. 1: Commercially available molecular weight marker as a fragment length standard (1 kb Plus DNA Ladder; the 1.5 kb fragment is indicated); 2: negative control containing all reaction components but no DNA; 3: DNA extracted from MDRS test soil sample 1; 4: DNA extracted from MDRS test soil sample 2; 5: positive control containing E. coli DNA 2–5: 25 μl of the PCR mixture was applied to the agarose gel.
182 Cora S. Thielet al.
https:/www.cambridge.org/core/terms. https://doi.org/10.1017/S1473550411000073
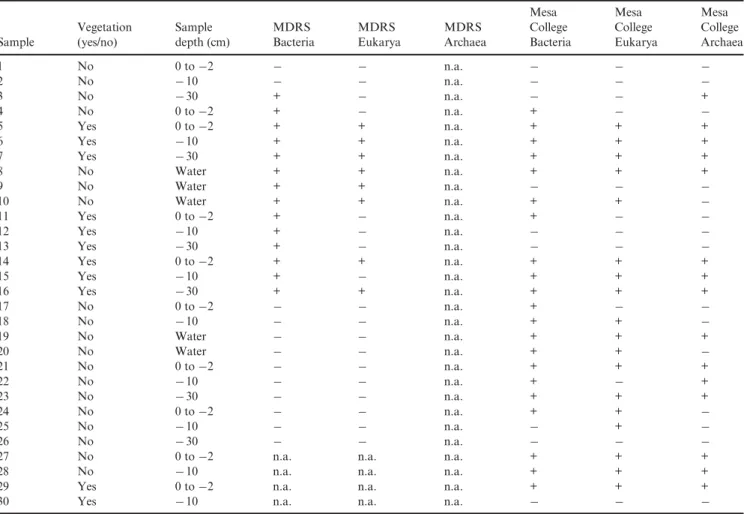
for samples 1–16 performed at MDRS and at the Mesa College Laboratory showed that 14 of the 16 MDRS PCR samples (87.5%) contained bacterial DNA, while 8 samples (50%) contained fungal DNA. Slightly different results were obtained for PCR results performed at the Mesa College Laboratory: in 10 samples (62.5%) bacterial DNA and in 8 samples (50%) fungal DNA could be detected. In 4 of the samples, positive in the analysis at MDRS using the bacterial primers, no PCR product was detected in the re-analysis at the Mesa College
Laboratory (Fig. 9). This was due to the different
DNA-staining techniques used at MDRS and at the Mesa College Laboratory (see Material and methods section). While at MDRS, precast gels with optimal SYBRsafe concentration for
visualization of even lower DNA amounts were used, gels at the Mesa College Laboratory were stained by covering them with ethidium bromide cards. Due to the short incubation time of only 2–4 minutes suggested by the manufacturer (see Material and methods section), the gel might not be evenly penetrated by the ethidium bromide so that the visualization of low amounts of DNA might not be optimal or even below the
detection limit. In samples 17–26, no PCR product but the
positive control could be detected at MDRS for bacterial and fungal primers (Fig. 7). This was due to a failure during the PCR run at MDRS, based on inconsistent power supply of the habitat generator which happened several times during crew rotations 76 and 77. The signal in the bacterial positive control
Fig. 4. Examples of soil sampling locations without neighbouring vegetation (Credit: EuroGeoMars crew 77).
(Fig. 7, upper row, third gel, lane 9) is likely due to the high starting DNA concentration in the PCR mixture sufficient to generate detectable amounts of amplification product in even low cycle numbers. Samples 27–30, as well as the analysis for archaeal DNA content of the samples, were not investigated at
MDRS because of limited time during the simulation campaign. In total, the PCR analysis of soil samples in the MDRS laboratory was highly efficient and comparable to the analysis performed in the Mesa College Laboratory (Fig. 9, Table 3).
Fig. 6. Examples for water sampling locations (Credit: EuroGeoMars crew 77).
Fig. 7. PCR experiments performed at MDRS. Upper part: PCR with bacterial primers. Lower part: PCR with primers specific for fungi. 01–26: PCR amplification of DNA from collected samples. pc: positive control: DNA extracted from E. coli. nc: negative control: reaction with water substituting the DNA. m: commercially available molecular weight marker as a fragment length standard (TrackIT 100 bp DNA ladder; filled arrows indicate the 1.5 kb fragment; open arrows indicate the 0.6 kb fragment). For each PCR sample 25 μl of the reaction mixture was applied to the agarose gel.
184 Cora S. Thielet al.
https:/www.cambridge.org/core/terms. https://doi.org/10.1017/S1473550411000073
Table 3. Results for bacteria, eukarya and archaea rRNA PCR analyses performed at MDRS and Mesa College Laboratory Sample Vegetation (yes/no) Sample depth (cm) MDRS Bacteria MDRS Eukarya MDRS Archaea Mesa College Bacteria Mesa College Eukarya Mesa College Archaea 1 No 0 to−2 − − n.a. − − − 2 No −10 − − n.a. − − − 3 No −30 + − n.a. − − + 4 No 0 to−2 + − n.a. + − − 5 Yes 0 to−2 + + n.a. + + + 6 Yes −10 + + n.a. + + + 7 Yes −30 + + n.a. + + + 8 No Water + + n.a. + + + 9 No Water + + n.a. − − − 10 No Water + + n.a. + + − 11 Yes 0 to−2 + − n.a. + − − 12 Yes −10 + − n.a. − − − 13 Yes −30 + − n.a. − − − 14 Yes 0 to−2 + + n.a. + + + 15 Yes −10 + − n.a. + + + 16 Yes −30 + + n.a. + + + 17 No 0 to−2 − − n.a. + − − 18 No −10 − − n.a. + + − 19 No Water − − n.a. + + + 20 No Water − − n.a. + + − 21 No 0 to−2 − − n.a. + + + 22 No −10 − − n.a. + − + 23 No −30 − − n.a. + + + 24 No 0 to−2 − − n.a. + + − 25 No −10 − − n.a. − + − 26 No −30 − − n.a. − − −
27 No 0 to−2 n.a. n.a. n.a. + + +
28 No −10 n.a. n.a. n.a. + + +
29 Yes 0 to−2 n.a. n.a. n.a. + + +
30 Yes −10 n.a. n.a. n.a. − − −
+ : positive signal;−: no signal; n.a.: not analysed.
Fig. 8. PCR experiments performed at the Mesa College Laboratory. Upper part: PCR with bacterial primers. Middle part: PCR performed with archaeal primers. Lower part: PCR with primers specific for fungi. 01–30: PCR amplification of DNA from collected samples. nc: negative control: reaction with water substituting the DNA. m: commercially available molecular weight marker as a fragment length standard (1 kb Plus DNA ladder;filled arrows indicate the 1.5 kb fragment; open arrows indicate the 0.5 kb fragment). For each PCR sample 25 μl of the reaction mixture was applied to the agarose gel.
Microbial content with respect to sampling depths and neighbouring vegetation
The total microbial content of all analysed samples is shown in Fig. 10. Out of the 30 samples, 21 contained bacterial DNA (70%), 18 contained fungal DNA (60%), and in 15 samples (50%) archaeal DNA was also detectable. The bacteria were as expected, the predominant micro-organisms, followed by fungi and archaea. This trend was also observed for soil and water samples analysed separately (Fig. 10). Considering the sample depths, it is interesting to see that most of the PCR positive soil
samples from depths of 0 to−2 cm contained bacterial DNA
(90%), while only 60% of the investigated samples were positive for fungi and 50% were positive for archaea (Fig. 11). At a
depth of−10 cm, approximately half of the samples included
all 3 types of micro-organisms, while at−30 cm the situation was slightly reversed and the content of archaeal DNA prevailed; however, it would be necessary to analyse more samples to verify the significance of these data. Additionally, the presence of neighbouring vegetation seemed to have an effect on the microbial content of the soil (Fig. 12). In 64–73% of the collected samples, bacterial, fungal or archaeal DNA was found for the samples collected close to a bush, grass or a
cactus. At locations without vegetation, microbial DNA was only found in 43–64% of the samples and bacteria were again the domain with the highest occurrence. Nevertheless, it seems that the existence of plants favoured a higher amount of microbial DNA in the soil.
Discussion and Conclusion
The PCR allows the amplification of the smallest amounts of nucleic acids originating from diverse starting material and is therefore a universal tool for answering questions from very differentfields, such as cell and molecular biology, medicine, diagnostics and forensic science. Despite these completely different applications, the PCR process itself is relatively consistent. Surprisingly, although the PCR technique (Saiki
et al. 1985) is widely used in many laboratories since its
discovery in 1983 by Kary Mullis, it has never before been used as an in-situ microbial DNA detection technique in Mars analogue research stations to test its applicability to the 0 2 4 6 8 10 12 14 16 bacteria fungi n u mb er o f samp les MDRS college laboratory
Fig. 9. Comparison of PCR experiments performed at MDRS and at the Mesa College Laboratory. Shown are how many of thefirst 16 samples were positive for bacteria and/or fungi in the PCR experiment at MDRS compared to the PCR run at the Mesa College Laboratory, with the differences in detection level ascribed to different staining techniques sensitivity. 0 5 10 15 20 25 total DNA samples (30) soil samples (25) water samples (5) num b e r of s a m ple s bacteria fungi archaea
Fig. 10. Total number of samples positive for bacterial, fungal and/or archaeal DNA.
0 10 20 30 40 50 60 70 80 90 100 0 to -2 cm -10 cm -30 cm P C R -p o si ti v e samp les [% ] sampling depths bacteria fungi archaea
Fig. 11. Influence of the sampling depths on the microbial content. While most of the surface samples (0 to−2 cm) contained bacterial DNA, fungi and archaea prevail at higher depths.
0 10 20 30 40 50 60 70 80 90 100
bacteria fungi archaea
P C R -p o si ti v e samp les [% ] vegetation no vegetation
Fig. 12. Influence of neighbouring vegetation on the microbial content of the soil sample.
186 Cora S. Thielet al.
https:/www.cambridge.org/core/terms. https://doi.org/10.1017/S1473550411000073
detection of life. In our study, we performed afield experiment in a Mars analogue environment to analyse the possibility of identifying microbial life under the harsh conditions of a simulated exploration mission on the Martian surface, far removed from comfortable, clean and sterile laboratory conditions.
During the preparation for the MDRS mission, we paid attention to the size and ease of handling of all instruments and consumables required for the experiment since limited space would be an issue on a real mission to Mars. Although the machines used for PCR were initially large and heavy, the latest developments have led to battery-operated thermal cyclers of a very small size, the smallestfitting in the palm of a
hand (71 × 121 × 47 mm; PalmPCR, Ahram Biosystems2010).
Development is still ongoing and we can expect even smaller and lighter instruments in the future. Additionally, a combination of DNA extraction and subsequent PCR analysis in the same automated process would reduce contamination risks and increase the comparability of samples due to a highly
standardized procedure. Automated DNA purification
instru-ments capable of isolating minute amounts of DNA for forensic diagnostics already exist, such as the Qiacube (Qiagen
2010) or the Maxwell 16 (Promega2010). Another advantage
would be the integration of a sequencer into this automated
process, so that after DNA extraction and PCR amplification
with the oligonucleotide primers of choice, the micro-organisms could be immediately identified by their sequence. This combination of automated processes will also be highly interesting for unmanned Mars lander missions and could represent a useful additional tool alongside the Life Marker Chip (LMC), one of the key instruments to detect signs of past
and present life on Mars during ESA’s ExoMars mission
on board the ExoMars rover (Parnell et al.2007) or during
follow-up missions. In contrast to the PCR-based detection of life, the LMC utilizes immunoassays with afluorescent readout
in a microarray format to detect specific organic molecules
or classes of molecules (Parnell et al.2007; Wilson2007). It would be desirable to develop two independent analytical
methods side-by-side to compare, evaluate and confirm the
research results.
Ribosomal genes are the most conserved DNA segments, and are present across the kingdoms of life on Earth. Using DNA primers corresponding to the 16S and 18S ribosomal RNA genes, samples from any environment can be analysed
for their microbial inhabitants (Isenbarger et al. 2008).
Therefore, our focus was to establish the PCR technique for the detection and discrimination of micro-organisms from the three domains (bacteria, archaea and eukarya) using universal primers located in the 16S and 18S ribosomal RNA genes. These ribosomal genes are used frequently for phylogenetic
analyses (Woese 1987), since they are small enough for
laboratory manipulations, but large enough to enable accurate interspecies comparisons. The great advantage of these genes is that certain areas are conserved, while others are highly variable (van de Peer et al.1996) so that PCR experiments can be designed either to identify whole domains or single species, depending upon the chosen primer locations.
Another goal was to analyse the composition of the microbial communities that exist in places with extreme environmental conditions such as the Utah desert. For this reason, samples were collected from different sampling depths at locations both with and without vegetation. The DNA extraction and PCR analysis were performed immediately after sample collection on-site to avoid long-term storage which would most likely falsify the results. Carrying out the data analysis on-site allows the composition of microbial
commu-nities to be much more precisely identified, as the DNA is
extracted immediately and the micro-organisms are not exposed to abnormal nor hostile conditions.
The analysis of sampling depths (Fig. 11) shows that
bacteria, archaea and eukarya are present at each depth with approximately the same frequency, ranging from 44 to 67%, with an exception for the bacterial surface content (at a depth
of up to−2 cm). In 90% of the analysed samples, we could
identify bacterial DNA. This could be related to the animal excrement or dead plant components serving as nutrients. Due to the strong winds which often prevail in this desert, bacteria are spread throughout the whole area and can be relocated on the soil surface.
We were also interested in the effect of vegetation on the content and composition of microbial communities. All three
domains (bacteria, archaea and eukarya) were identified in
soils with and without vegetation with a preference for locations with vegetation (Fig. 12). Again, bacteria were the predominant micro-organisms and were detected in 64% of all analysed samples without neighbouring vegetation and in 73% of all samples with vegetation. The increased number of positive samples in cases with neighbouring vegetation could be explained by symbiosis and food supply. Many bacteria such as rhizobia (reviewed in van Rhijn &
Vanderleyden1995) and fungi live in symbiosis with plants
(Smith & Read1997). Also for archaea of the organotroph nutritional type, the close vicinity of plants is beneficial. Additionally, the soil mineral composition is a crucial point for microbial existence and growth, and is discussed for some of the samples listed inTable 1in Ehrenfreund et al. (2011; this volume). A further possibility to investigate the composition of microbial communities on the level of the ribosomal
RNA genes is to subclone the amplified PCR products and
identify different microbial species by sequencing (Direito et al.
2011; this volume) or even to perform a metagenome
sequencing analysis of the entire microbial community (Tringe et al.2005).
In summary, PCR experiments at MDRS demonstrated clearly that despite the prevailing suboptimal, semi-sterile laboratory conditions, it is possible to detect microbial DNA with a quality and sensitivity comparable to a standard molecular biology laboratory. This is an encouraging start and
further research should test the identification of
micro-organisms by PCR in Mars-like environments to improve the technique and automation of the single steps in the process. Places such as MDRS are indispensable for pre-mission tests to learn as much as possible and be prepared for the problems that could be encountered and how they could be solved.
Apart from the characterization of living microbial com-munities, the analysis of bacterial DNA signatures is also a suitable method to analyse past microbial communities in sediments (Inagaki et al.2005). However, one of the problems associated with the analysis of DNA extracted from sediments is the potential for vertical migration of DNA across strata (Haile et al.2007), which has to be considered and analysed very carefully. Most importantly, surveying for nucleic acid-based life on other planets must be carried out with caution, owing to the risk of contamination by Earth-based life (Poole & Willerslev2007).
In any environment, theflux of nucleic acids due to cell death and horizontal gene transfer is tremendous. After the death of an organism, DNA is rapidly degraded by enzymes or
microbial organisms (Eglinton & Logan 1991), whereas
desiccation or adsorption to a mineral matrix may prevent degradation. Due to enzymatic processes that occur shortly after death and non-enzymatic hydrolytic cleavage of phos-phodiester bonds in the phosphate-sugar backbone (Lindahl 1993; Päabo et al.2004) that generate single-stranded nicks, the average size of ancient DNA (aDNA) from Earth is between 100 and 500 bp (Päabo et al.2004). As constant low temperatures play a central role in the longevity of aDNA molecules (Lindahl 1993; Hofreiter et al. 2001; Willerslev &
Cooper 2005) and rapid desiccation and high-salt
concen-trations are also strong DNA survival promoting factors (Lindahl1993), the Mars environment appears very well suited for long-time survival of DNA. Additionally, nucleic acid functional groups, including sugar hydroxyl groups, phosphate groups and extracyclic functional groups on the bases, are
capable of binding to minerals (Cleaves et al. 2010) and,
if attached to a surface, are protected and survive strong UV exposure (Lyon et al.2010).
The space environment with vacuum, extreme dehydration and solar and galactic cosmic radiation, prevents the survival
of most organisms in space (Horneck 2003). Despite this
extremely challenging situation for life, there are organisms on Earth which are potentially able to survive space travel: it has been shown that different micro-organisms can survive launch by spallation from a hypervelocity impact (Horneck et al. 2008a; Fajardo-Cavazos et al. 2009) and hypervelocity atmospheric transit (Fajardo-Cavazos et al. 2005). Thus, it has been suggested that, for example, bacterial spores situated on or within meteorites could survive interplanetary transport
(Fajardo-Cavazos et al. 2009) and hypervelocity entry from
space through Earth’s atmosphere (Fajardo-Cavazos et al.
2005; reviewed in Olsson-Francis & Cockell2010). However, DNA may be the sensitive target of spores exposed to ultrahigh
shock pressures (Moeller et al. 2008). As another extreme
example, tardigrades, which are among the most desiccation and radiation-tolerant animals, have been shown to survive extreme levels of ionizing radiation (Horikawa et al. 2006),
temperatures of−273 °C (Becquerel1950) and the vacuum of
space (Jönsson et al. 2008). Whereas microgravity and
radiation had no effect on the survival nor DNA integrity of active tardigrades (Rebecchi et al.2009), after being exposed to the space environment for 12 days, tardigrades molted and
females laid eggs (Rebecchi et al.2009). Several eggs hatched, and the newborns exhibited normal morphology and behav-iour (Rebecchi et al.2009).
Therefore, interplanetary transport of DNA or even of living organisms from Mars to Earth, especially in the early phase of solar system development, is neither impossible nor unlikely, but a possible hypothesis. If life on Mars is not based on DNA, it would support the hypothesis that life developed indepen-dently from Earth and that the special conditions on Mars also allowed development of life in another form than that on Earth, strongly suggesting that life could be a likely event in a reasonably wide range of planetary conditions. But if life on Mars is based on DNA, there is the possibility that material was transferred between planets. The results from different Mars orbiters and landers suggest environmental conditions allowing potential microbial growth: areas with subsurface water and sulphur, as well as rocks for endoliths and permafrost regions, all of which are of interest as potential
sites of existing life (Horneck 2008b). In a recent study
simulating Martian atmospheric conditions and subsurface water in the form of ice, it was shown that the growth of
non-extremophile bacteria was possible (Pavlov et al. 2010)
indicating that there are hypothetical habitats on Mars where life could still exist. In the following decades, there will be a chance to address this eminent question about the existence of life on Mars and its similarity to terrestrial life by sample return, robotic or manned missions to Mars and modern PCR-based analysis techniques.
Acknowledgements
The EuroGeoMars 2009 campaign was organized and supported by the International Lunar Exploration Working Group (ILEWG), NASA Ames Research Center and ESA/ESTEC. We acknowledge the contribution of the EuroGeoMars 2009 campaign crew and the mission support team. We thank in particular Carol Stoker (NASA Ames Research Center) and Jason Page (ESTEC) for experimental support. C.S.T. acknowledges travel support to MDRS from a grant from ILEWG. The help of Denise McKenny (Mesa State College, Grand Junction, Colorado), Jörn Kalinowski (University of Bielefeld), Heather Smith and Chris McKay (NASA Ames Research Center), was also highly appreciated for collaborations and fruitful discussions. Furthermore, we thank Uwe Schlomann, Garrit Koller, Tina Warinner, Sara Duke and John B. McClean for critically reading the manuscript and providing constructive suggestions.
References
Ahram Biosystems (2010). Available online at http://www.ahrambio.com/ product.html (accessed 20 October 2010).
Becquerel, P. (1950). La suspension de la vie au dessous de 1/20K absolu par démagnétisation adiabatique de l’alun de fer dans le vide le plus elevé. C. R. Hebd. Séances Acad. Sci. Paris 231, 261–263.
Cary, S.C., McDonald, I.R., Barrett, J.E. & Cowan, D.A. (2010). On the rocks: the microbiology of Antarctic Dry Valley soils. Nat. Rev. Microbiol. 8, 129–138.
188 Cora S. Thielet al.
https:/www.cambridge.org/core/terms. https://doi.org/10.1017/S1473550411000073
Cleaves, H.J. II, Jonsson, C.M., Jonsson, C.L., Sverjensky, D.A. & Hazen, R.M. (2010). Adsorption of nucleic acid components on rutile (TiO(2)) surfaces. Astrobiology 10, 311–323.
Connon, S.A., Lester, E.D., Shafaat, H.S., Obenhuber, D.C. & Ponce, A. (2007). Bacterial diversity in hyperarid Atacama Desert soils. J. Geophys. Res. 112, G04S17.
Córdoba-Jabonero, C., Zorzano, M.P., Selsis, F., Patel, M.R. & Cockell, C.S. (2005). Radiative zones in Martian polar environments. Icarus 175, 360–371.
DeLong, E.F. (1992). Archaea in coastal marine environments. Proc. Natl. Acad. Sci. U.S.A. 89, 5685–5689.
Direito, S.O.L., Ehrenfreund, P., Marees, A., Staats, M., Foing, B. & Röling, W.F.M. (2011). A wide variety of extremophiles and large beta-diversity at the Mars Desert Research Station (Utah). Int. J. Astrobiol. 10, 191–207.
Drees, K.P., Neilson, J.W., Betancourt, J.L., Quade, J., Henderson, D.A., Pryor, B.M. & Maier, R.M. (2006). Bacterial community structure in the hyperarid core of the Atacama Desert, Chile. Appl. Environ. Microbiol. 72, 7902–7908.
Eglinton, G. & Logan, G.A. (1991). Molecular preservation. Philos. Trans. R. Soc. Lond. B 333, 315–327; discussion 27–28.
Ehrenfreund, P., Foing, B.H., Stoker, C., Zavaleta, J., Quinn, R., Blake, D., Martins, Z., Sephton, M., Becker, L., Orzechowska, G. et al. (2010). EuroGeoMars Field Campaign: Sample Analysis of Organic Matter and Minerals. LPI Contribution No. 41, p. 1723.
Ehrenfreund, P., Röling, W., Thiel, C.S., Quinn, R., Septhon, M., Stoker, C., Direito, S., Kotler, M., Martins, Z., Orzechowska, G.E., Kidd, R. & Foing, B.F. (2011). Astrobiology and habitability studies in preparation for future Mars missions: trends from investigating minerals, organics and biota. Int. Journal of Astrobiology 10, 239–253.
Fajardo-Cavazos, P., Langenhorst, F., Melosh, H.J. & Nicholson, W.L. (2009). Bacterial spores in granite survive hypervelocity launch by spallation: implications for lithopanspermia. Astrobiology 9, 647–657. Fajardo-Cavazos, P., Link, L., Melosh, H.J. & Nicholson, W.L. (2005).
Bacillus subtilis spores on artificial meteorites survive hypervelocity atmospheric entry: implications for Lithopanspermia. Astrobiology 5, 726–736.
Fajardo-Cavazos, P., Schuerger, A.C. & Nicholson, W.L. (2010). Exposure of DNA and Bacillus subtilis spores to simulated Martian environments: use of quantitative PCR (qPCR) to measure inactivation rates of DNA to function as a template molecule. Astrobiology 10, 403–411.
Foing, B. (2009). Summary Report. EuroGeoMars Campaign: Last Rotation Crew 77. End of Rotation Report (online). Available at http://desert. marssociety.org/mdrs/fs08/0227/summary.asp (accessed 1 November 2010).
Foing, B.H., Stoker, C., Zavaleta, J., Ehrenfreund, P., Thiel, C., Sarrazin, P., Blake, D., Page, J., Pletser, V., Hendrikse, J., Direito, S., Kotler, M., Martins, Z., Orzechowska, G., Gross, C., Wendt, L., Clarke, J., Borst, A.M., Peters, S.T.M., Wilhelm M.-B., Davies G.R. & ILEWG EuroGeoMars 2009 team (2011). Field Astrobiology Research in Moon-Mars Analogue Site: Instruments & Methods. Int. Journal of Astrobiology 10, 141–160.
Foing, B.H., Mahapatra, P., Boche-Sauvan, L., Som, S., Page, J., Stoker, C., Zhavaleta, J., Sarrazin, P., Blake, D., Poulakis, P. et al. (2010). ExoGeoLab Test Bench for Landers, Rovers and Astrobiology. LPI Contribution No. 1538, p. 5477.
Haile, J., Holdaway, R., Oliver, K., Bunce, M., Gilbert, M.T., Nielsen, R., Munch, K., Ho, S.Y., Shapiro, B. & Willerslev, E. (2007). Ancient DNA chronology within sediment deposits: are paleobiological reconstructions possible and is DNA leaching a factor? Mol. Biol. Evol. 24, 982–989. Hofreiter, M., Mead, J.I., Martin, P. & Poinar, H.N. (2003). Molecular
caving. Curr. Biol. 13, R693–R695.
Hofreiter, M., Serre, D., Poinar, H.N., Kuch, M. & Päabo, S. (2001). Ancient DNA. Nat. Rev. Genet. 2, 353–360.
Horikawa, D.D., Sakashita, T., Katagiri, C., Watanabe, M., Kikawada, T., Nakahara, Y., Hamada, N., Wada, S., Funayama, T., Higashi, S. et al. (2006). Radiation tolerance in the tardigrade Milnersium tardigradum. Int. J. Radiat. Biol. 82, 843–848.
Horneck, G. (2003). Could life travel across interplanetary space? Panspermia revisited. In Evolution on Planet Earth: The Impact of the Physical Environment, ed. Rothschild, L.J. & Lister, A.M., pp. 109–127. London: Academic Press.
Horneck, G. (2008b). The microbial case for Mars and its implication for human expeditions to Mars. Acta Astronaut. 63, 1015–1024.
Horneck, G., Stöffler, D., Ott, S., Hornemann, U., Cockell, C.S., Moeller, R., Meyer, C., de Vera, J.P., Fritz, J., Schade, S. et al. (2008a). Microbial rock inhabitants survive hypervelocity impacts on Mars-like host planets: first phase of lithopanspermia experimentally tested. Astrobiology 8, 17–44.
Inagaki, F., Okada, H., Tsapin, A.I. & Nealson, K.H. (2005). Microbial survival: the paleome: a sedimentary genetic record of past microbial communities. Astrobiology 5, 141–153.
Isenbarger, T.A., Carr, C.E., Johnson, S.S., Finney, M., Church, G.M., Gilbert, W., Zuber, M.T. & Ruvkun, G. (2008). The most conserved genome segments for life detection on Earth and other planets. Orig. Life Evol. Biosph. 38, 517–533.
Jönsson, K.I., Rabbow, E., Schill, R.O., Harms-Ringdahl, M. & Rettberg, P. (2008). Tardigrades survive exposure to space in low Earth orbit. Curr. Biol. 18, R729–R731.
Lane, D.J. (1991). 16S/23S rRNA sequencing. In Nucleic Acid Techniques in Bacterial Systematics, ed. Stackebrandt, E. & Goodfellow, M., pp. 115–175. Wiley, New York.
Lindahl, T. (1993). Instability and decay of the primary structure of DNA. Nature 362, 709–715.
Lyon, D.Y., Monier, J.M., Dupraz, S., Freissinet, C., Simonet, P. & Vogel, T.M. (2010). Integrity and biological activity of DNA after UV exposure. Astrobiology 10, 285–292.
Moeller, R., Horneck, G., Rabbow, E., Reitz, G., Meyer, C., Hornemann, U. & Stöffler, D. (2008). Role of DNA protection and repair in resistance of Bacillus subtilis spores to ultrahigh shock pressures simulating hypervelocity impacts. Appl. Environ. Microbiol. 74, 6682–6689.
Mormile, M.R., Hong, B.Y. & Benison, K.C. (2009). Molecular analysis of the microbial communities of Mars analog lakes in Western Australia. Astrobiology 9, 919–930.
Mullis, K.B. & Faloona, F.A. (1987). Specific synthesis of DNA in vitro via a polymerase-catalyzed chain reaction. Methods Enzymol. 155, 335–350. Olsson-Francis, K. & Cockell, C.S. (2010). Experimental methods for
studying microbial survival in extraterrestrial environments. J. Microbiol. Methods 80, 1–13.
Päabo, S., Poinar, H., Serre, D., Jaenicke-Despres, V., Hebler, J., Rohland, N., Kuch, M., Krause, J., Vigilant, L. & Hofreiter, M. (2004). Genetic analyses from ancient DNA. Annu. Rev. Genet. 38, 645–679. Parnell, J., Cullen, D.C., Sims, M.R., Bowden, S., Cockell, C.S., Court, R.,
Ehrenfreund, P., Gaubert, F., Grant, W., Parro, V. et al. (2007). Searching for life on Mars: selection of molecular targets for ESA’s Aurora ExoMars mission. Astrobiology 7, 578–604.
Pavlov, A.K., Shelegedina, V.N., Vdovina, M.A. & Pavlov, A.A. (2010). Growth of microorganisms in Martian-like shallow subsurface conditions: laboratory modeling. Int. J. Astrobiol. 9, 51–58.
Poole, A.M. & Willerslev, E. (2007). Can identification of a fourth domain of life be made from sequence data alone, and could it be done on Mars? Astrobiology 7, 801–814.
Promega (2010). Available online at: http://www.promega.com/maxwell16/ (accessed 20 October 2010).
Qiagen (2010). Available online at: http://www.qiagen.com/products/ automation/qiacube.aspx?ShowInfo=1&r=2721 (accessed 20 October 2010).
Rebecchi, L., Altiero, T., Guidetti, R., Cesari, M., Bertolani, R., Negroni, M. & Rizzo, A.M. (2009). Tardigrade resistance to space effects:first results of experiments on the LIFE-TARSE mission on FOTON-M3 (September 2007). Astrobiology 9, 581–591.
Saiki, R.K., Scharf, S., Faloona, F., Mullis, K.B., Horn, G.T., Erlich, H.A. & Arnheim, N. (1985). Enzymatic amplification of beta-globin genomic sequences and restriction site analysis for diagnosis of sickle cell anemia. Science 230, 1350–1354.
Secosky, J. (2008). Summary of biology studies done at MDRS (online) Available at: http://desert.marssociety.org/research-summary.asp (accessed 20 October 2010).
Sermon, K. & De Rycke, M. (2007). Single cell diagnostics. Methods Mol. Med. 132, 31–42.
Smith, S.E. & Read, D.J. (1997). Mycorhizal Symbiosis. Academic Press, San Diego, CA.
Thiel, C.S., Pletser, V. & Foing, B. (2011). Human crew related aspects for astrobiology research. Int. J. Astrobiol. 10, 255–267.
Tringe, S.G., von Mering, C., Kobayashi, A., Salamov, A.A., Chen, K., Chang, H., Podar, M., Short, J.M., Mathur, E.J., Detter, J.C. et al. (2005). Comparative metagenomics of microbial communities. Science 308, 554–557.
Van de Peer, Y., Chapelle, S. & de Wachter, R. (1996). A quantitative map of nucleotide substitution rates in bacterial ribosomal subunit RNA. Nucleic Acids Res., 24, 3381–3391.
Van Rhijn, P. & Vanderleyden, J. (1995). The rhizobia-plant symbiosis. Microbiol. Rev. 59, 124–142.
White, T.J., Bruns, T.D., Lee, S.B. & Taylor, J.W. (1990). Amplification and direct sequencing of fungal ribosomal RNA genes for phylogenetics. In PCR– Protocols and Applications – A Laboratory Manual, ed. Innis, N., Gelfand, D., Sninsky, J. & White, T., pp. 315–322. Academic Press, New York.
Willerslev, E. & Cooper, A. (2005). Ancient DNA. Proc. R. Soc. B 272, 3–16.
Willerslev, E., Hansen, A.J., Binladen, J., Brand, T.B., Gilbert, M.T., Shapiro, B., Bunce, M., Wiuf, C., Gilichinsky, D.A. & Cooper, A. (2003). Diverse plant and animal genetic records from Holocene and Pleistocene sediments. Science 300, 791–795.
Willerslev, E., Hansen, A.J., Ronn, R., Brand, T.B., Barnes, I., Wiuf, C., Gilichinsky, D.A. & Cooper, A. (2004). Long-term persistence of bacterial DNA. Curr. Biol. 14, R9–R10.
Wilson, P.K. (2007). Development of life marker chip technology for in-situ life detection on Mars. PhD Thesis, Cranfield University, http://dspace.lib. cranfield.ac.uk/handle/1826/4617
Woese, C. (1987). Bacterial evolution. Microbiol. Rev. 51, 221–271.
190 Cora S. Thielet al.
https:/www.cambridge.org/core/terms. https://doi.org/10.1017/S1473550411000073