Text clustering with styles
155
0
0
Texte intégral
(2)
(3) Faculté des Sciences Secrétariat-décanat de Faculté Rue Emile-Argand 11 2000 Neuchâtel – Suisse Tél : + 41 (0)32 718 21 00 E-mail : secretariat.sciences@unine.ch. IMPRIMATUR POUR THESE DE DOCTORAT La Faculté des sciences de l'Université de Neuchâtel autorise l'impression de la présente thèse soutenue par. Monsieur Mirco KOCHER Titre:. “Text Clustering with Styles” sur le rapport des membres du jury composé comme suit: • • • •. Prof. Jacques Savoy, directeur de thèse, Université de Neuchâtel, Suisse Dr Valerio Schiavoni, Université de Neuchâtel, Suisse Prof. Fabio Crestani, Università della Svizzera italiana, Lugano, Suisse Prof. Paolo Rosso, Universidad Politecnica de Valencia, Espagne. Neuchâtel, le 22 décembre 2017. Imprimatur pour thèse de doctorat. Le Doyen, Prof. R. Bshary. www.unine.ch/sciences.
(4)
(5) ABSTRACT. This thesis mainly describes the author clustering problem where, based on a set of n texts, the goal is to determine the number k of distinct authors and regroup the texts into k classes according to their author. We iteratively build a stable and simple model for text clustering with styles. We start by designing a measure reflecting the (un)certainty of the proposed decision such that every decision comes along with a confidence of correctness instead of only giving a single answer. Afterwards, we link those pairs of texts where we see an indication of a shared authorship and have enough evidence that the same person has written them. Finally, after checking every text tuple, if we can link them together, we build the final clusters based on a strategy using a distance of probability distributions. Employing a dynamic threshold, we can choose the smallest relative distance values to detect a common origin of the texts. While in our study we mostly focus on the creation of simple methods, investigating more complex schemes leads to interesting findings. We evaluate distributed language representations and compare them to several state-of-the-art methods for authorship attribution. This comparison allows us to demonstrate that not every approach excels in every situation and that the deep learning methods might be sensitive to parameter settings. The most similar observations (or the category with the smallest distance) to the sample in question usually determines the proposed answers. We test multiple inter-textual distance functions in theoretical and empirical tests and show that the Tanimoto and Matusita distances respect all theoretical properties. Both of them perform well in empirical tests, but the Canberra and Clark measures are even better suited even though they do not fulfill all the requirements. Overall, we can note that the popular Cosine function neither satisfies all the conditions nor works notably well. Furthermore, we see that reducing the text representation not only decreases the runtime but can also increase the performance by ignoring spurious features. Our model can choose the characteristics that are the most relevant to the text in question and can analyze the author adequately. We apply our systems in various natural languages belonging to a variety of language families and in multiple text genres. With the flexible feature selection, our systems achieve reliable results in any of the tested settings.. Keywords: Natural language processing, inter-textual distance, text representation, digital humanities, digital libraries, text clustering, authorship attribution, unsupervised learning.
(6) RÉSUMÉ. Cette thèse présente le problème du regroupement d’auteurs formulé de la manière suivante : en partant d’un ensemble composé de n textes, le but est de déterminer le nombre k d’auteurs distincts, pour regrouper les textes en k classes. De manière itérative, nous construisons un système stable et simple qui est capable de regrouper automatiquement les documents selon leurs thèmes. Dans notre étude, nous commençons par proposer une mesure capable d’estimer l’(in-)certitude de la décision proposée, dans le but d’obtenir un indicateur de confiance en lieu et place d’une simple réponse. Ensuite, nous combinons les paires de textes pour lesquelles une même affectation apparaît, et dont nous sommes suffisamment confiants pour affirmer qu’ils sont rédigés par le même auteur. Enfin, après avoir vérifié chaque tuple de textes, nous construisons les classes en nous basant sur une stratégie utilisant une distance entre distributions probabilistes. Grâce à l’utilisation d’une limite dynamique, nous sommes à même de choisir les plus petites distances relatives pour détecter une origine commune entre textes. Bien que notre étude se concentre principalement sur la création de méthodes simples, des schémas plus complexes mènent à des résultats plus performants. Ainsi, nous avons opté pour une représentation distribuée et nous avons comparé son efficacité à plusieurs méthodes d’attribution d’auteurs. Cette évaluation nous permet de démontrer que toutes les approches n’excellent pas dans toutes les situations, et que des méthodes d’apprentissage profond peuvent être sensibles au choix des paramètres. Les observations les plus proches des exemples en question (ou la catégorie ayant la plus petite distance) déterminent généralement les réponses proposées. Nous avons testé plusieurs fonctions de distance inter-textuelle sur des critères théoriques et empiriques. Nous démontrons que les distances dites de Tanimoto et de Matusita respectent toutes les propriétés théoriques. Toutes deux obtiennent également de bons résultats dans le cadre de tests empiriques. Toutefois, les mesures de Canberra et de Clark sont encore mieux adaptées, bien qu’elles ne remplissent pas toutes les caractéristiques théoriques demandées. De manière générale, l’on constate que la fonction Cosinus ne répond pas à toutes les conditions, et se comporte de façon suboptimale. Enfin, nous observons que la réduction des traits stylistiques retenues diminue le temps d’exécution et peut également améliorer les performances en ignorant les redondantes. Nous testons nos systèmes pour différentes langues naturelles appartenant à une variété de familles de langues et pour plusieurs genres de textes. Grâce à la sélection flexible des attributs, nos systèmes sont capables de produire des résultats fiables dans toutes les conditions testées. Mots-clés : Traitement automatique du langage naturel, distance inter-textuelle, linguistique computationnelle, attribution d’auteur, classification automatique, apprentissage non-supervisé.
(7) ACKNOWLEDGMENTS. I would like to express my gratitude first and foremost to my supervisor Prof. Jacques Savoy for his support, guidance, and encouragement to always strive for improvement during my Ph.D. thesis. Likewise, I would like to thank the members of the jury, namely Prof. Fabio Crestani (Università della Svizzera italiana), Prof. Paolo Rosso (Universitat Politècnica de València), and Dr. Valerio Schiavoni (Université de Neuchâtel), for the time they devoted to evaluating this dissertation. I am thankful for the many interesting discussions at the IIUN and all my colleagues at UniNE throughout these years have my thanks for maintaining a great atmosphere, both at the office and in the many activities organized that are hardly related to Computer Science. Furthermore, I am much obliged to my friends for their kind thoughts, entertainment, and all the great time we spend together. Finally, I want to address the biggest thanks to my family for their patience and endless support; I couldn’t have done it alone. This research was supported in part by the Swiss National Science Foundation under Grand #200021-149665/1..
(8)
(9) Contents. 1 Introduction. 1. 1.1. Motivation & Objectives . . . . . . . . . . . . . . . . . . . . . . . .. 1. 1.2. Stylometry . . . . . . . . . . . . . . . . . . . . . . . . . . . . . . . .. 2. 1.2.1. Authorship Attribution . . . . . . . . . . . . . . . . . . . . .. 3. 1.2.2. Authorship Verification . . . . . . . . . . . . . . . . . . . . .. 4. 1.2.3. Author Profiling . . . . . . . . . . . . . . . . . . . . . . . . .. 4. 1.2.4. Authorship Linking and Author Clustering . . . . . . . . . .. 5. 1.3. Achievements . . . . . . . . . . . . . . . . . . . . . . . . . . . . . .. 6. 1.4. Organization of the Thesis . . . . . . . . . . . . . . . . . . . . . . .. 7. 2 Authorship Analysis. 9. 2.1. Feature Selection . . . . . . . . . . . . . . . . . . . . . . . . . . . .. 9. 2.2. Distance Measures . . . . . . . . . . . . . . . . . . . . . . . . . . .. 11. 2.3. Classifier Choices . . . . . . . . . . . . . . . . . . . . . . . . . . . .. 12. 2.4. Evaluation Methodology . . . . . . . . . . . . . . . . . . . . . . . .. 14. 2.5. Performance Measures . . . . . . . . . . . . . . . . . . . . . . . . .. 15. 2.6. From Analyzing to Clustering . . . . . . . . . . . . . . . . . . . . .. 19. 3 Presentation of the Publications. 21. 3.1. Distributed Language Representation for Authorship Attribution . .. 23. 3.2. A Simple and Efficient Algorithm for Authorship Verification . . . .. 25. 3.3. Distance Measures in Author Profiling . . . . . . . . . . . . . . . .. 28. 3.4. Evaluation of Text Representation Schemes and Distance Measures for Authorship Linking . . . . . . . . . . . . . . . . . . . . . . . . .. 30. 3.5. Author Clustering Using Spatium . . . . . . . . . . . . . . . . . . .. 32. 3.6. Author Clustering with an Adaptive Threshold . . . . . . . . . . . .. 35. 4 Conclusion. 37. 4.1. Summary of Contributions . . . . . . . . . . . . . . . . . . . . . . .. 37. 4.2. Future Directions . . . . . . . . . . . . . . . . . . . . . . . . . . . .. 38. ix.
(10) A Papers. 41. A.1 Distributed Language Representation for Authorship Attribution . .. 41. A.2 A Simple and Efficient Algorithm for Authorship Verification . . . .. 59. A.3 Distance Measures in Author Profiling . . . . . . . . . . . . . . . .. 71. A.4 Evaluation of Text Representation Schemes and Distance Measures for Authorship Linking . . . . . . . . . . . . . . . . . . . . . . . . .. 89. A.5 Author Clustering Using Spatium . . . . . . . . . . . . . . . . . . . 111 A.6 Author Clustering with an Adaptive Threshold . . . . . . . . . . . . 117 B Publications. 131. B.1 Journal Articles . . . . . . . . . . . . . . . . . . . . . . . . . . . . . 131 B.2 Conference Proceedings . . . . . . . . . . . . . . . . . . . . . . . . . 132 B.3 Evaluation Forums . . . . . . . . . . . . . . . . . . . . . . . . . . . 133 C Voronoi Diagrams of Distance Measures. 135. References. 141. x.
(11) Chapter 1. Introduction The Internet offers a vast amount of information in written format for which we should develop and improve effective text analyzing algorithms. This publicly available material poses important questions from a security perspective, especially regarding the increased number of pseudonymous posts, chats, threatening e-mails, or anonymously written documents available on the Web [37]. Authorship analysis involves the study of textual data to deduce knowledge about its creator based on the applied writing style. The result is a "fingerprint" for anything written by an author or a particular group of people making it easy to compare it to any other writing. Some interesting problems emerging from blogs and social networks are, for instance, detecting plagiarism, recognizing stolen identities, or rectifying wrong information about the writer. To be able to determine or characterize the real author of a document automatically is an obvious concern for criminal investigations. In historical or literary studies, being able to verify the gender of a given character may open new research directions, e.g., does Juliet speak like a female figure [11]? From a marketing viewpoint, companies may be interested in knowing, based on the analysis of blogs and online product reviews, the demographics of people that like or dislike their products (e.g., gender, personality traits). Similarly, online audience identification can be used by advertisers to target specific groups with unique characteristics, e.g., to show a product to people from a limited age range, with a certain level of education, with a given political view, or in a defined geographic location. Furthermore, detecting the real person behind a pseudonymous author is a general curiosity, e.g., trying to find out who Robert Galbraith is (we now know it is J. K. Rowling) or who Elena Ferrante is (still unknown at the time of writing this thesis). Therefore, proposing suitable algorithms to those problems presents an indisputable interest.. 1.1. Motivation & Objectives. Given the growing interest in the Web and the importance of multilingual applications, we aim to promote authorship analyzing models that would also be capable of correctly identifying the author of texts available from various electronic document sources (wiki-based corpus, blogosphere, e-mail) and written in a variety of languages. Today, these issues are of prime importance in a world centered on electronic information, especially given its ever-increasing volume of illegal copies, fraud 1.
(12) threats, and terrorism. Within the natural language processing domain, designing, implementing, and evaluating models working with languages other than English is an important and promising research field. Having a better understanding of the impact that different linguistic constructions may have on automatic processing effectiveness is an important task. Further motivation for choosing our direction of work was the prominence of relatively complicated approaches that require the tuning of several hyper-parameters and many parameters. In the end, the "optimal" parameter setting works for a specific case (combination of language and text genre) to solve some problems. Our observations were that various parameter settings could lead to very different and sometimes unpredictable results. Furthermore, deep learning and word embedding got quite popular lately showing promising achievements because the vector representations of a word based on its context can be employed in many natural language processing applications and is an active field. We speculated that it is possible to reach a high effectiveness without tuning (and possibly over-fitting) the complex systems, but instead to shift the focus to an overall simpler framework that works independently of the underlying textual data. We feel that the user should receive a logical reasoning for the decisions, which is not possible with a black box system (e.g., Support Vector Machine (SVM), neural networks, random forest) and even harder for combinations of multiple approaches. Our goal is to design, implement, and evaluate authorship analyzing models for writings in various natural languages from a variety of language families (e.g., members of the Romance, Germanic, or Slavic families), along with selected others (e.g., Arabic and Greek). Furthermore, we want to provide and evaluate different text representation strategies and define selection procedures to allow the authorship analyzing system to be more efficient. The final goal is to develop and implement clustering strategies to discover certain information linked to the author. Overall, based on the writing style in a text, we want to be able to determine the real author of a given document, verify a shared authorship, determine the demographics of an individual author, or group up all documents by the same person.. 1.2. Stylometry. To solve these stylometric questions, we can assume that every person (or each demographic class) owns a unique, measurable style that is distinct from that of others. The measured style should be the same for all documents written by a given author (e.g., Anna) or from any category (e.g., female or young writers). Simultaneously, the measured style should be different to another author (e.g., John) or another category (e.g., male or old writers). Therefore, we search for textual features that have an intra-class similarity, and at the same time, show an inter-class dissimilarity. Looking at different aspects of linguistic style, e.g., word or sentence length, vocabulary richness, and various frequencies (e.g., of words, word lengths, word forms, characters, or combinations thereof), stylometric approaches can help to analyze the author of a text. This general problem represents different applications, and, for instance, in our case, we want to tackle the task of authorship attribution, authorship verification, author profiling, authorship linking, and finally 2.
(13) author clustering.. 1.2.1. Authorship Attribution. Computer-assisted authorship attribution aims to determine, as accurately as possible, the true author of a document or a text excerpt [32, 37, 49]. Under this general definition, the closed-class attribution problem assumes that the real author is one of the specified candidates as visualized in the left part of Figure 1.1. One can presuppose that the writing style is stable over the author’s life, or at least during a few decades (e.g., between 20 to 40 years). To determine such personal stylistic aspects, a sample of texts written by each of the possible writers must be available. Based on specific stylistic representations or author profiles, the system can compute a distance (or similarity) measure between the unknown text and each possible author. The author with the smallest distance (or the highest similarity) is considered to be the actual author in this closed-class situation. We worked on this problem in a paper which we introduce and discuss in section 3.1. In the open-set situation, the real author could be one of the proposed authors or another unknown one (right side of Figure 1.1). If all probable authors show a similar distance (or similarity) and none of them is below a given threshold, then the text in question could be written by someone else. This second case is strongly related to the author verification task as explained below and we can approach it in the same way. Authorship attribution is usually the first problem to be solved when tackling authorship analyzing issues and can be extended to handle further cases.. Figure 1.1 – Left: closed-class authorship attribution to decide whether the sample was written by Anna, Berta, or Charley. Right: open-class authorship attribution to decide whether the sample was written by Daniel, Emil, or someone else.. 3.
(14) 1.2.2. Authorship Verification. The authorship attribution model can be adapted so that it only determines whether a given author did, in fact, write a given document (chat, threatening e-mail, doubtful testimony) [28, 51] as visualized in Figure 1.2. At first, this question seems simpler than the classical authorship attribution problem because the answer is a simple binary answer (yes/no). However, the challenging part is to refute a shared authorship and to find a suitable threshold for the similarity when we can still verify a common origin of two texts. For example, if we want to know if a newly discovered poem was written by Shakespeare [11, 53], the system needs to compare a model based on Shakespeare’s texts with all other possible representative non-Shakespeare models. This second part is hard to generate because we are never sure we have included all other writers having a style similar to Shakespeare. Furthermore, instead of being limited to a single decision, the system should return a probability (or degree of credibility) that the proposed author is the real one or that the answer is correct [44], as well as some justification supporting the outcome. Finally, if the system is unsure if it should verify or contradict a shared authorship, it would be better to state that there is not enough evidence to make a decision instead of risking a wrong answer and losing the user’s trust in the system. We worked on this problem in a paper which we present and discuss in section 3.2 and a working notes paper [24].. Figure 1.2 – The authorship of the text on top has to be verified or refuted to be written by the given author Gustav.. 1.2.3. Author Profiling. Do men write like women, or are there significant differences in their writing styles [22]? What are the features that best discriminate typings by separate age groups [3, 40]? Is it possible to reliably detect somebody’s personality traits based on a text excerpt? Similarly, can we detect the features that best discriminate writings by several language varieties? The spelling difference between British English and American English is well defined, but can we detect a variation from the US to Canada, or Ireland and Great Britain, and can we discriminate between New Zealand and Australia? We can transform these author profiling issues to authorship attribution questions with a closed set of possible answers [25]. Determining the gender of an author can be seen as attributing the text in question to either the female or male authors. Similarly, the age group detection takes one of four or five groups to attribute the 4.
(15) unknown text. To uncover the Big Five personality traits (extraversion, neuroticism, agreeableness, conscientiousness, and openness on an interval scale from -5 to +5 with a step size of 1) this approach is taken even further by selecting for each factor one of eleven categories. And the language variety detection in an unknown Spanish text can take one of seven groups ("Argentina", "Chile", "Colombia", "Mexico", "Peru", "Spain", or "Venezuela"). Figure 1.3 shows a general visualization of the task. Furthermore, when we profile Twitter tweets, the spelling may not always be perfect, and more sociocultural traits could be detected. We worked on this problem in various working notes papers [22, 25, 27].. Figure 1.3 – The author can be profiled based on a text excerpt to determine, for example, her1 gender, age, language variety, and personality traits.. 1.2.4. Authorship Linking and Author Clustering. For all previous tasks, it was possible to gather training data because a set of documents written by the different possible authors (or categories of writers, such as men and women) can be collected to learn which features are pertinent, what the optimal parameters are, and which threshold works the best. Here, we have a different situation where such labeled data is not available. The first targeted question, called authorship linking, is defined as follows. Having a set of n documents (or text excerpts) created by several distinct writers, find the pairs of texts generated by the same person. Therefore, the goal is to produce a ranked list containing document pairs with a shared authorship. We worked on the linking problem in a paper which we present and discuss in section 3.4 and two working notes papers [23, 26]. In the related task called author clustering, the objective is similar and usually extends the linking task. Here, the number k of distinct authors must be determined to form k separate clusters based on a preset threshold for the ranked list of authorship links. A set of documents (or text excerpts) may be regrouped in different clusters for each author (authorship attribution), for each demographic class (e.g., gender, age, personality traits, language variety (author profiling)), or according to any other factor as visualized in Figure 1.4. One of the biggest problems is that there is no way to tell beforehand how many clusters we have to create, i.e., it could be one cluster for each document individually, or only one group with documents, 1. There is no gender-neutral third-person singular pronoun in the English language, but we believe that using pronouns makes writing about authorship easier. Here, the author is a she and in others, she can be a he without loss of generality.. 5.
(16) or (more probably) something in between. In this current study, there is no training data available that would allow an estimation of the cluster size distribution and an unsupervised approach must be designed and evaluated. As possible applications for both tasks, we can regroup a set of proclamations written by different terrorist groups, link the reviews written by the same author in a collection [1], or gather a set of poems (or excerpts of literary works). The clustering problem was the topic in various papers which we present and discuss mainly in section 3.5 and section 3.6 and the same two working notes papers as the linking problem mentioned above.. Figure 1.4 – Texts grouped in clusters according to different properties.. 1.3. Achievements. In this dissertation, we examine text clustering with styles. In the work for this thesis, we achieve the following milestones: 1. We test multiple inter-textual distance functions in theoretical and empirical tests. Some of the measures work well in theory but not always in practice and vice versa. 2. We compare different text representation strategies. Reducing the size of the text not only decreases the runtime but can also increase performance by ignoring spurious features. 6.
(17) 3. We create different feature selection procedures. The Spatium chooses features most important to the text in question. 4. We design a measure reflecting the (un)certainty of the proposed decision. We designed the system such that every decision comes along with an estimation of confidence of correctness. 5. We evaluate distributed language representations as well as state-of-the-art methods for authorship attribution. Not every approach is better in every aspect, and the deep learning methods can be sensitive to parameter settings. 6. We create a simple framework to cluster texts based on the writing style. Using a dynamic threshold the relative smallest distance values can be chosen. 7. We apply our system in various natural languages belonging to a variety of language families and in multiple text genres. With a flexible feature selection, the system works in any of the tested settings. The main takeaway message is that a simple approach can lead to solid results in a short time while more complex models do not necessarily improve the result significantly but always take longer to complete. Furthermore, the results of our simple approaches can be justified in plain English because they are not based on a black box approach but use frequent words and the difference between them.. 1.4. Organization of the Thesis. The remainder of this dissertation is structured as follows. Next, in chapter 2, we show the essential steps and challenges any authorship analysis system (in our case for authorship attribution, author profiling, authorship verification, authorship linking, or author clustering) has to face by presenting relevant related works. Furthermore, we briefly introduce an overview of the testing methods and performance measures that we will use throughout the discussion of the following chapters. We present the various publications upon which we base this thesis in the central part in chapter 3. First, the chapter provides the necessary context to understand the role of the individual papers. The rest of that chapter then contains individual sections for each paper. In each of these sections, we will briefly summarize the main aspects of the article, particularly concerning its importance to our goal of developing a text clustering system based on the writing style. Finally, chapter 4 summarizes the results of our contributions and highlights the significance of our findings with their relevance to the state of the art in text clustering. In the end, we look into the future, seeking ways to improve text clustering effectiveness or efficiency by looking at various interesting issues that remain more or less unresolved. The complete articles, containing results, discussions, as well as the full list of references, can be found in Appendix A. In Appendix B, we list our publications of journal articles, conference proceedings, and the working notes in evaluation forums. Appendix C shows the Voronoi diagrams of several distance measures. 7.
(18)
(19) Chapter 2. Authorship Analysis There exists a broad body of literature which covers various techniques to solve different authorship analysis problems and studies them according to numerous perspectives. We have to solve three main challenges to achieve an effective solution for any authorship analysis task (authorship attribution, authorship verification, author profiling, authorship linking, or author clustering). First, a text representation must be defined reflecting the stylistic aspects of the author, without taking account of the genre or the topics explicitly. Therefore, we must select the most pertinent features from each text document for each category. Second, a useful distance measure between two text representations must be determined. Such a function must return a small value when the same author has written the two documents and a larger one otherwise. Instead of applying a distance measure, a similarity measure can be used to state that two texts were written by the same person when the similarity value is high enough.F Finally, a classifier has to assing a sample to a category depending on preset or learned parameters.. 2.1. Feature Selection. The first challenge is to represent the text suitably, and it is not clear which text representation proposes the highest effectiveness. To describe the stylistic aspects of an author, the first set of methods suggests defining an invariant stylistic measure [17] reflecting the particular style of a given author and varying from one person to another. Different lexical richness measures or word distribution indicators are possible solutions. For instance, Yule’s K measure, statistics related to the typetoken ratio (TTR) (e.g., Herdan’s C, Guiraud’s R, or Honoré’s H), the proportion of word-types occurring once or twice (e.g., Sichel’s S), the average word length, or the mean sentence length [4, 45]. None of these measures have proven very satisfactory due, in part, to word distributions ruled by a large number of very low probability elements (LNRE) [4]. If words seem a natural way to generate a text surrogate, other studies have suggested using the letter occurrence frequencies [21, 31] or the distribution of short or long sequences of letters (character n-grams) [38]. As demonstrated by Kešelj et al. [20] such a representation can produce good results. We can justify this approach by considering that we can detect an author employing the continuous present time form more frequently by a high frequency of the tri-gram "ing" and verbal forms 9.
(20) related to the verb "to be" (e.g., "am", "is", "are"). As another example, one can identify more adverbial forms with a word ending in "ly". However, it is not clear which n value for the character n-gram is needed to offer the highest performance level, and this value may depend on the collection, language (e.g., n = 2 for Chinese, n = 3 to n = 6 for English), as well as other factors (e.g., text genre, OCR text) [34]. On social media channels and modern messaging services, new features have been appearing in recent years. The English language went from having 92 basic printable Latin characters (small & capital letters when ignoring diacritics (e.g., résumé, naïve) plus digits and punctuations & symbols1 ) to a language with thousands of characters in just a few years because of the addition of (the language independent) emojis2 . Informally, we now encode (some interpretation of) facial expression, gender, and skin color in the texts we write on modern media. Those new features are only marginally researched but could provide indications to profile the sender of short and informal texts [27]. The Part-Of-Speech (POS) distribution can also be used to reflect the stylistic characteristics of the different authors. One writer may prefer using more noun phrases than verb phrases leading to nouns being more frequent in the text in comparison to adjectives. For instance, when comparing Presidents Kennedy’s and Obama’s speeches, one can see this difference, with Obama adopting more verbal constructions, i.e., a style oriented towards action ("yes, we can") [46]. Such a text representation does not usually produce a noteworthy result. On the other hand, instead of considering only the distribution of single POS tags, short sequences of POS tags can be more useful to detect some discriminative stylistic aspects of different authors. We could, for instance, distinguish a preference for Noun-Noun constructions (e.g., Information Retrieval) over Noun-Preposition-Noun forms (e.g., Retrieval of Information). However, a simple count based on a single feature, and primarily based on content words, cannot provide a reliable measure. The text register has an impact on those predictors, as pronouns are in general less frequent in a formal context. Nonetheless, political speeches delivered by US presidents contain more pronouns, even when the context is official [45]. Therefore, we must view a generalization based on a single experiment or the use of a single text register with caution. Gender distinction might be perceived as the simplest profiling task since the classification is a binary choice (at least as organized by the PAN3 lab in the CLEF4 evaluation forum and as utilized in this thesis). Therefore, we could easily collect a relatively large amount of data. Past studies also showed that the writing style between genders or between different age groups does differ and the stylistic differences can be detected [47]. According to Pennebaker [40], women tend to employ more personal pronouns (especially more "I" and "we") than men while in comparison using fewer determiners and prepositions. The difference is not huge, but it 1. In ascending Unicode order: ! " # $ % & ’ ( ) * + , - . / : ; < = > ? @ [ \ ] _ { | } ~ The Unicode Standard as of June 2017 contains 2,666 emojis including some sequences for genders or skin tones, flags, and the components that are used to create keycaps and other sequences, cf. https://emojipedia.org/ 3 http://pan.webis.de/ 4 http://www.clef-initiative.eu/ 2. 10.
(21) does exist. Usually, there is only a small percentage change in the relative frequencies. Since those features form a closed set, we can create a simple list of words. As an alternative, the LIWC (Linguistic Inquiry and Word Count) [52] proposes a set of word lists to measure semantic-based categories. For instance, negations, hedge phrases, cognitive, and social words are more related to female authors, while swear words, and references to money or numbers are more associated with men. Past studies indicate that common word-types or function words can reflect the personal style of each writer closely while other researchers suggest taking account of the entire vocabulary and other experiments propose to ignore terms having a low occurrence frequency (e.g., appearing once or twice). For example, Burrows [9] suggested two distinct but complementary tests. The first one is based on words regularly used by one author but sporadically by the others while the second is grounded on words infrequently used by one author and ignored by the others. The most frequent terms are suitable in many cases. According to Zipf’s law, the words used only once or twice (hapax/dis legomenon) make up around 50% of written texts [54, 55]. The advantage of using only the most frequent terms is that it can be dynamically computed based on the underlying text data without predefining specific lists. It is often possible to describe even complex concepts with a limited set of terms. For instance, using just the 1,000 most common words in the English language it is possible to describe everything from the periodic table and a car engine to the tectonic plates, the US Constitution, and the solar system in a simplistic manner [36].. 2.2. Distance Measures. We can find further concerns when choosing the most appropriate distance (or similarity) measure between two text extracts. For example, in the information retrieval [33] or deep learning community [15], Cosine from Equation 2.3 corresponds to the most popular measure. In the first research domain, we can explain this because we have to compare the rather long documents to a short query (possibly a few words). In such a query, usually all of the terms appear just once, therefore comparing it to texts based on the individual frequency is not useful and we prefer a distance measure based on the inner product. In the word embedding field, the Cosine is used in combination with algebraic operations to detect relationships between words in the vector space created by the neural network. However, many other distance measures [13] do exist that provide a more nuanced differentiation, and their success in other authorship analyzing problems is largely unknown. Choosing a suitable distance measure presents an important aspect for the authorship analyzing system. The choice depends on the field, and some domains employ the distance only implicitly. There should be a smoothness prior to the classification, meaning a slight change in the input data should either result in the same conclusion or give only a small variation of the outcome. The most simple distance measure is certainly the Manhattan distance as shown in Equation 2.1 or the Euclidean norm from Equation 2.2. Lastly, we present the Jaccard distance in Equation 2.4. 11.
(22) ∆M anhattan (A, B) =. m X. |ai − bi |. (2.1). i. v um uX ∆Euclidean (A, B) = t |ai − bi |2. (2.2). i. . ∆Cosine (A, B) =. . Pm. ai b i 1 cos−1 qP i qP m m 2 2 π ai bi i. Pm. ∆Jaccard (A, B) = 1 − Pm i. a2i +. i ai bi Pm 2 i bi −. (2.3). i. ! Pm i. ai bi. (2.4). To visualize those distance measures, we used a heat map in the paper which we presented in section 3.3. Here, we draw Voronoi diagrams with preset dots to show the enclosed neighborhood areas. For each dot, there is a corresponding colored region consisting of all points closer to that dot than to any other. We have a vector space [X Y ] that goes from the bottom left [0.0 0.0] to [1.0 1.0] in the top right and place the five dots at the positions [0.90 0.10] (blue), [0.40 0.75] (red), [0.15 0.15] (green), [0.50 0.35] (cyan), and [0.45 0.65] (yellow). As a simple illustration, we see in Figure 2.1a those five dots and their covering areas based on the Manhattan distance. We can observe that for this measure all borders between adjacent regions are either horizontal, vertical, or in a ±45 degree angle. Compared to Manhattan, when using the Euclidean distance, the borders are all still straight but can be at any angle as shown in Figure 2.1b. In this case, the border is at the midpoint between two dots and is perpendicular to them. For some points, the distance to two dots differs less than 0.1%, and we left points in such regions therefore uncolored (white). The Voronoi diagram in Figure 2.1c of the Cosine distance depicts the angular measure well. Lastly, we can see in Figure 2.1d that the Jaccard distance includes a directional factor in addition to the requirement that the points have to be spatially close located. We compare many distance measures in section 3.3 both from a theoretical standpoint as well as in various empirical test cases. In Appendix C we present the visualizations of the remaining interesting distance measures using Voronoi diagrams. Certain functions look strange at first (especially Canberra in Figure C.2c and Wave-Hedges from Figure C.2e), but they can be explained similarly as above. Some of them reward an exact match (or strong similarities) of an individual dimension more than an overall spatial proximity.. 2.3. Classifier Choices. When we represent each text excerpt in a vector space with suitable features, and if we have a good distance measure, a machine learning approach can decide to which of a set of categories an unseen query text belongs. Therefore, having a training set with data containing samples whose category membership is known, a supervised learning method can be used. If no such training set containing correctly identified. 12.
(23) (a) Manhattan distance. (b) Euclidean distance. (c) Cosine distance. (d) Jaccard distance. Figure 2.1 – Voronoi Diagram using different distances. samples is available, an unsupervised procedure has to group data into clusters based only on some distance measure and a threshold value. The k-nearest neighbors algorithm (k-NN) is a common method for classification where we analyze a test sample according to the majority of its surroundings. For instance with the 5-NN, when there are three samples labeled as category A and two as category B, the test sample would be assigned A independent of the ranking within those five representations. Therefore, the 3-NN could assign a different label if both of the B labeled samples are among the closest three samples. It is also possible that the k-NN has to solve a tie. For instance, if there are two of category A and category B each and one from category C, there’s no clear decision. One possibility would be to iteratively decrease k until there is no longer a tie in the nearest neighbors and then take this decision. To avoid a tie verdict altogether, it is also possible to not represent each sample individually in the vector space but to average the samples of each category to a single point for the whole category and 13.
(24) check which is the closest. Another way would be to include the distance value and calculate the weighted average of the k-NN. Linear regressions (or ordinal linear regressions) are well suited to predict scalar categories, like the level of extraversion as one of the psychological traits. Next to continuous and discrete quantitative variables, a linear regression could also be used to determine ordinal categories (age groups). The naïve Bayes classifier only requires a feature set, but no distance measure has to be defined. In this case, the probability for each category to contain a given sample can be directly computed. Even though it assumes complete independence of the features without any possible correlation between them (which is clearly not satisfied for natural languages), the classifier can work well and requires only a small training collection. Some proposed text categorization solutions employ a black box approach (e.g., deep learning, SVM, neural nets) that have been shown to be effective. However, such models have more difficulty justifying or explaining the proposed solution to the final user than other simpler approaches. In some cases, this is of no concern (e.g., as a character recognition system) but for authorship attribution or gender discrimination, a solution that can be justified in plain English seems to be a better approach (even if a reduction of the effectiveness has to be accepted). We prefer approaches like Burrows Delta [8], naïve Bayes, or especially an instance based k-nearest neighbor approach.. 2.4. Evaluation Methodology. In this section, we will present testing methods to evaluate the quality of different aspects of authorship analysis systems, from author attribution and author profiling to author verification and author clustering. Machine learning models have parameters that can be fitted and optimized. We can not expect that our labeled training set covers every possible combination of features or that it is free of any noise. Therefore, future data probably won’t match exactly with the data that we have to tune the system today. To assess the predicting performance of authorship analysis systems on unseen data we need solid testing methods. Furthermore, to compare multiple systems between each other, we need to convincingly show that one works better than the other by including a measurement of certainty. The amount of labeled data is usually limited in practice. With the holdout method, we split the corpus into two parts for separate training (generally 2 /3 of the samples are randomly selected) and testing (the remaining 1 /3 of the samples) of the system. Optimally, we represent each class with approximately equal proportions in both parts, and this process can be repeated to achieve a more reliable estimate. A better approach is cross-validation (CV) which avoids overlapping test sets. In the k-fold CV the data is split into k subsets of (roughly) equal size (usually k = 10). Then, in k rounds, each subset is used for testing, while the rest is used to train the system. For instance, in the 3rd round of a 5-fold CV, the system trains with the subsets 1, 2, 4, and 5 to predict the classes in subset 3. The process can also be repeated multiple times to shuffle the samples in the subsets. Finally, the 14.
(25) overall error estimation or performance measure takes the average of the scores in all subsets. Leaving-one-out (LOO) is a particular form of CV where the number of folds k is the number of training instances. This method makes the best use of the data, involves no random subsampling, but is computationally very expensive. Today, the best classifiers are trained with supervision to determine the demographics of unknown writers and to study how they use the language. However, to achieve high accuracy, the training corpus needs to be large, diverse, and accurately annotated, which may be difficult to obtain. Furthermore, to estimate the standard error of the system’s performance, a large number of corpora is required. An alternative to labeling huge amounts of data is to use artificial texts from a generator based on a preexisting corpus. The bootstrap is such a generator using a labeled dataset. In this approach, the system generates S new random bootstrap samples. A bootstrap copy has the same length, but the probability of choosing one given term (word or punctuation symbol) depends on its relative frequency in the original text. We draw the words with replacement; thus, the underlying probabilities are fixed. As the syntax is not respected, each bootstrap sample is not readable but reflects the stylistic aspects when analyzed as a bag-of-words. With S = 200 copies for each sample, we can compare multiple schemes or parameter settings by comparing their respective average performance and confidence interval. Overall, this is a cheap method as there is no labeling cost and could further be used to simulate improper spelling and language usage. However, the synthetic texts may not be realistic, resulting in a lower performance on real test documents and making it only comparable to other bootstrap corpora.. 2.5. Performance Measures. In this section, we will present measures to assess the quality of different aspects of authorship analysis systems, from author attribution and author profiling to author verification and author clustering. For categorization tasks, such as in author profiling or author attribution, the most frequently used measure is the accuracy rate (or the percentage of correct assignments). We have two distinct schemes to compute this value. When we have the same number of texts for each category, both measures return the same value. As a first method, the micro-averaging principle assumes that one decision corresponds to one vote. When the system can correctly identify, for example, the right class for 80 texts out of a total of 100 documents, the resulting accuracy rate (micro-average) is 80 /100 = 0.8 or 80%. As a second method, the accuracy rate is first computed for each of the c categories, under the assumption that the same importance can be attached to each category. In this case, one class corresponds to one vote (macro-average), and thus the overall accuracy rate is the mean of all classes. For example, with c = 3 possible categories, and with an accuracy rate of 0.8 for the first class, 0.7 for the second, and 0.6 for the third, the macro-averaging accuracy rate is (0.8+0.7+0.6) /3 = 0.7, or 70%. 15.
(26) In authorship attribution studies, the micro-averaging technique is most frequently used to compute a mean performance. The argument in favor of this method is that categories should count proportionally to their frequency, and since most corpora are well balanced, the difference in the number of texts between categories is not too large, which results mostly in the same accuracy score. Additionally, if the task requires categorizing multiple factors (e.g., age, gender, personality traits) for one document, the joint accuracy can be used. In this case, we divide the number of problems where we correctly predicted all factors for the same sample by the total number of problems in the corpus. Finally, if we allow the system to not answer in case of uncertainty, we can use the c@1 [39]. Having n questions with nc correctly classified and nu unsolved answers, the c@1 is defined as follows: nu ∗ nc 1 ) (2.5) c@1 = ∗ (nc + n n If the system provides an answer for all open problems, then the c@1 is the same as the traditional accuracy measure. However, c@1 rewards approaches that maintain the same number of correct answers and decrease the number of incorrect answers by leaving some questions unanswered (indicating that the provided evidence is not strong enough to make a final decision). For example, with n = 100 and nc = 80 (nu = 0), the accuracy rate is 0.8, and c@1 gives the same value. However, when the system leaves 10 of the incorrect decisions without an answer (nu = 10), the c@1 does not view them as fully wrong and considers them to be correct with a probability of 0.8, so we get c@1 = 0.88. Therefore, open problems add value to the c@1 as if they are answered with the accuracy already achieved. Additionally, we can have different weights for correct, omitted, and incorrect answers to measure the "merit" of the system. Of course, the ultimate goal is to reach a zero-mistake rate. When an error-free system is unlikely, we should penalize the wrong decisions. To reflect this aspect, a right answer counts as +1 point, the decision don’t know adds +0.5, while we attribute -2 for an incorrect decision. Providing wrong answers surely hurts the credibility of an automatic system. For example, having again n = 100 problems with nc = 80 correct answers, nu = 10 unsolved cases, and ni = 10 incorrect decisions, the merit score would be 1 ∗ 80 + 0.5 ∗ 10 − 2 ∗ 10 = 65. To maximize the merit rating, we could increase the thresholds to take a decision. If this can reduce the incorrect decisions to ni = 5 and the correct answers to nc = 75, on account of some correct answers becoming unsolved, and end up with nu = 20 unsolved cases, the merit score would rise to 1 ∗ 75 + 0.5 ∗ 20 − 2 ∗ 5 = 75. Faced with stupid or incorrect answers, the end user will lose his confidence in the approach. Such an attribution scheme cannot be used, for example, to support court decisions. We actively prefer a system able to know when "it does not know" and provide an answer when there is enough evidence to make a choice. To evaluate the clustering output, we can measure the purity and completeness of the generated clusters. In this perspective, a perfect system must create only k clusters, each containing all the documents written by the same person. Moreover, each document must belong to exactly one cluster; thus, the clusters must be nonoverlapping. The evaluation measures are for each document the precision, the 16.
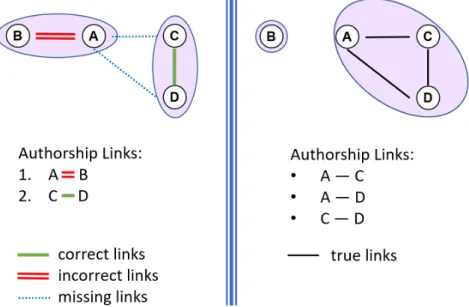
(27) recall, and the harmonic mean of the two previous values (denoted BCubed F1 ) [2]. To evaluate this, we first compute the cluster correctness function cc(di , dj ) between two documents di and dj as follows: (. cc(di , dj ) =. 1 if A(di ) = A(dj ) ∧ C(di ) = C(dj ) 0 otherwise. (2.6). where A(di ) indicates the real author of di , and C(di ) is the cluster in which di appears. Based on this notation, the document precision pr(di ) and document recall re(di ) are defined as: P. P. re(di ) =. cc(di , dj ) |C(di )|. (2.7). cc(di , dj ) |A(di )|. (2.8). dj ∈C(di ). pr(di ) =. dj ∈A(di ). The document precision represents how many texts in the same cluster are written by the same author. Therefore, this measures the purity of the cluster (the absence of noise). Symmetrically, the recall associated with one document represents how many documents from that author appear in its cluster. Therefore, this measures the completeness of the cluster. We could generate one cluster per document to achieve a perfect precision, which is a solution that produces a strong baseline if there are numerous small clusters. Therefore, the purity of each group is maximal, and the resulting precision is 1.0. Similarly, to achieve a recall of 1.0, all documents can be regrouped into a single cluster. Thus, the two measurements are in opposition. Having n texts in a given collection, the BCubed precision and recall for the whole corpus is defined as: precision =. recall =. n 1X pr(di ) n i=1. n 1X re(di ) n i=1. (2.9). (2.10). from which the well-known F1 performance measure can be computed, as F1 =. 2 ∗ precision ∗ recall precision + recall. (2.11). with a higher value meaning a better performance and a better distribution of the clusters. The BCubed F1 will serve as the main effectiveness measure in our final research. In Figure 2.2 we see an example of a suboptimal clustering output on the left side, and how it should have been on the right side. There are two authors with one having written only a single document while the other has written three texts and the goal is to create the clusters accordingly. However, in this example, two clusters of equal size were created. The document precision for both text A and B is 0.0 because none of the texts in their cluster should be in that cluster. At the same time, for text C and D we have 100% document precision as they are in 17.
(28) a pure cluster. This example gives us a BCubed precision of 0.5 for this output. The document recall of text B is 1.0 (nothing is missing), while for A we have 1 /3 document recall because it is isolated from both C and D who in turn have a 2 /3 document recall. Therefore, this results in a BCubed recall of 0.666 and the BCubed F1 is 0.571 overall for this output.. Figure 2.2 – Example of author clustering and authorship linking output (left) and the corresponding truth (right). As a second measure, one can ask the clustering algorithm to return a list of links between text pairs, ordered by an estimated probability of having the same author for the two cited documents. To evaluate such an ordered list, one can apply the average precision (AP ) [50]. If we assess the AP of a single system in multiple collections, we use the mean of the AP , called mean average precision (M AP ). For this, we first compute the link correctness function lc(i) at the i-th position of the ranked link list containing document pairs as follows: (. lc(i) =. 1 if A(di1 ) = A(di2 ) ∧ di1 6= di2 0 otherwise. (2.12). where A(di1 ) and A(di2 ) indicate the real author of the first and second document in the link at the i-th rank. The precision at a rank i and the final AP of the whole list are then defined as: Pi lc(j) (2.13) precision(i) = j=1 i P|L|. AP =. i=1. precision(i) ∗ lc(i) |R|. (2.14). where |R| specifies the number of true (relevant) links and |L| the number of created links. Using Equation 2.13, a common performance value is provided at rank 10 (denoted P rec@10) or 20 (P rec@20). These two limits are frequently adopted in the information retrieval domain because they correspond to the first two pages of results returned by a commercial search engine. The number of true links in the test collection |R| defines another interesting limit. This limit varies from one test 18.
(29) collection to another, and we denote it as RP rec. Finally, to measure the capability of a system to return only good results (or links in this context), one can measure its high precision (denoted HP rec) by indicating the rank − 1 of the first incorrect answer appearing on the top of the returned list. For instance, taking the example in Figure 2.2 from the clustering output with the created links again, we can calculate the AP . The goal is to create three links to connect all documents in the bigger cluster together while leaving text B unlinked. However, there are two missing and one incorrect link in the output. Additionally, we see that the correctly created link from text C to text D is ranked lower than the incorrect link from document A to B. We therefore have precision(1) = 0.0 and precision(2) = 0.5 with |R| = 3 which gives us an AP of 0.166. As the number of created links |L| is smaller than the number of relevant links |R| in this example, the RP rec is the same as the AP . Since the highest ranked pair is an incorrect link, the HP rec is 0. AP is a standard evaluation measure in the IR domain [33]. The AP is roughly the average area under the precision-recall curve for a set of problems. This measure is sensitive to the first rank(s), and providing an incorrect answer in the top ranks hurts the AP value intensively. Nonetheless, AP does not punish verbosity, i.e., every true link counts even when appearing near to the end of the ranked list. Therefore, by providing all possible authorship links, one can attempt to maximize AP [41].. 2.6. From Analyzing to Clustering. Our goal is to build a text clustering system based on the writing style that can reason its decisions back to the end-user. We explain our procedure for this in detail in chapter 3. For all authorship analyzing tasks, a text collection covering individuals with diverse demographics is needed. A varied corpus is better for the system to learn or deduce the writing style of particular groups of people or a specific author. The sentence structure and lexical usage can be unique and serve as a "fingerprint" in a text and can be better determined if there is more data available. Our corpora are rather short (e.g., we have 1,200 short samples of male Arabic authors), but organizations (in particular on the national level) can collect an enormous amount of data. For instance, the NSA, through PRISM5 (the program to gather data from Internet communications that matches court-approved search terms from US Internet companies) and MUSCULAR6 (where the NSA copied the unencrypted data flows from the main communications links between data centers of Google and Yahoo) are theoretically able to compare billions of author profiles with a certain author’s writings to find her true identity. From the beginning, we have evaluated our work in the CLEF evaluation campaign by participating in multiple PAN labs (namely in the years 2014, 2015, 2016, and 2017). Working in the context of an evaluation campaign allows performance as5 6. https://en.wikipedia.org/wiki/PRISM_(surveillance_program) https://en.wikipedia.org/wiki/MUSCULAR_(surveillance_program). 19.
(30) sessments across systems by numerous participants, and helps to avoid comparisons to weak baselines. The corpora used in our analysis were collected from newspaper articles, crawled from publicly available Twitter profiles, written by students as an essay or a review, or extracted from various novels. It is a valuable endeavor to explore the full space of authorship analysis techniques and iteratively build a reliable and stable system. When having a suitable text collection, we can first create a system to attribute an unknown text to one out of a closed group of possible authors (section 3.1). The extension to this is if one from the group of potential authors or another unknown author may have written the sample. For this, we need to be able to verify or controvert a shared authorship for a pair of texts (section 3.2). Similarly, when profiling a text (e.g., male or female; 10s, 20s, or older), the sample has to be classified as one out of a limited number of categories depending on the most similar observations or the category with the smallest distance (section 3.3). Then, we can link those pairs of texts where we see an indication of a shared authorship and have enough evidence that the same person has written them (section 3.4). Finally, we check for every text tuple to determine if we can link them together and build the final clusters based on different strategies (section 3.5 and section 3.6).. 20.
(31) Chapter 3. Presentation of the Publications The core of this dissertation is based on the following six publications. • Mirco Kocher, Jacques Savoy. Distributed Language Representation for Authorship Attribution In Digital Scholarship in the Humanities, to appear. • Mirco Kocher, Jacques Savoy. A Simple and Efficient Algorithm for Authorship Verification In Journal of the American Society for Information Science and Technology, 68(1), 259-269, 2017. • Mirco Kocher, Jacques Savoy. Distance Measures in Author Profiling In Information Processing and Management, 53(5), 1103-1119, 2017. • Mirco Kocher, Jacques Savoy. Evaluation of Text Representation Schemes and Distance Measures for Authorship Linking In Scientometrics (Special Issue Proposal on Scieno-Network-Mining), submitted. • Mirco Kocher, Jacques Savoy. Author Clustering Using Spatium Short Paper JCDL 2017, Toronto, Canada, June 19-23, 2017, ACM/IEEE, 265-268. • Mirco Kocher, Jacques Savoy. Author Clustering with an Adaptive Threshold In Jones, G. J. F., Lawless, S., Gonzalo, J., Kelly, L., Goeuriot, L., Thomas M., Cappellato, L., & Ferro, N. (Eds), Experimental IR Meets Multilinguality, Multimodality, and Interaction, Proceedings of the 8th International Conference of the CLEF Association, CLEF 2017, Dublin, Ireland, September 11-14, 2017, 186-198. These contributions address various questions concerning motivations and objectives regarding the goal of successively building an effective and robust text 21.
(32) clustering system with styles. The following sections give an overview of the content and contributions for each of these publications by first exposing the questions they raise and eventually presenting the approach taken to provide answers. Each section contains the central insights of the contribution while all the articles, containing results, discussions, as well as the full list of references, can be found in Appendix A. We first start in section 3.1 by comparing different methods to solve the authorship attribution problem. Then, in section 3.2, we extend our gained knowledge by verifying the authorship of a given text. In section 3.3 we have a more fundamental look at the core of authorship analyzing approaches by evaluating numerous distance measures in author profiling tasks. We evaluate different text representation schemes as well as distance measures in section 3.4, specifically for the authorship linking task. Afterwards, in section 3.5, we present our first approach for solving the author clustering problem and conclude in section 3.6 with the final assessment for reaching the goal of text clustering with styles.. 22.
(33) 3.1. Distributed Language Representation for Authorship Attribution. Deep learning approaches have become quite popular lately by producing effective results, particularly in image recognition. Similarly, word embedding now appears in many natural language processing proposals and we started investigating the use of the underlying word vector representation in the work of this thesis. A solution to the authorship attribution problem is the first step for our authorship analyzing system with the final goal to solve the task of text clustering with styles. As stylistic features able to discriminate between different authors, numerous studies propose to use the most frequent words or function words (determiners, pronouns, conjunctions, prepositions, and auxiliary verb forms) [8, 16, 43]. Those features are usually extracted from the text without considering their context. Only a few authorship experiments proposed generating document representations based on words in their context. However, those were mainly limited to bigrams of terms used directly [19] or employed to produce word networks instead [35]. In this study, the authorship of a text will be determined based on the relationships between terms using deep learning [5, 14]. We propose and implement two new classifiers based on such a distributed language representation. In this perspective, a vector-space representation can be generated either for each author or each disputed text according to words and their nearby context. Every word is nested somewhere in a high dimensional vector space such that nearby words share the same meaning, e.g., synonyms would be grouped close together. With simple linear algebraic operations, the semantic relationship between words can be explored, e.g., we see that the result of vector(France) vector(Paris) + vector(Italy) is very close to vector(Rome). For the first model, we sum up the vectors of each word from a bag-of-words to create the complete text representation in this vector space. Additionally, the probability of each word appearing in the text scales each vector, meaning the weights correspond to the relative frequencies. Therefore, a document vector is the concatenation of its word vectors. In the second model, we embed the full document in the vector space without the intermediate step of word vector combinations. This representation allows the model to capture the meaning of each word better and thus, to be similar, two texts must not only share the same words, but those words must appear in similar contexts (and with similar frequencies). To determine the authorship of a disputed text representation, the Cosine similarity between the vectors is usually applied, and then the k highest Cosine similarities are inspected. In our experiments, we had four diverse test collections available (the Federalist Papers, the State of the Union addresses, the Glasgow Herald, and La Stampa newspapers). Therefore, we show that the proposed strategies can be adapted without any difficulty to different languages (such as English and Italian) or genres (essays, political speeches, and newspaper articles). Furthermore, we compare its effectiveness with baseline methods where we treat each text as a bag-of-words, such as in the k-NN (traditionally, without deep learning), NSC (nearest shrunken centroid), chi-square, Delta, LDA (latent Dirichlet allocation), and multi-layer perceptron (MLP) classifiers. 23.
(34) The deep learning schemes offer a broad range of parameters that can be tuned and optimized. We show that the proposed default values for the learning rate, vector size, and context window size tend to produce a high-performance level where small variations around them do not modify the obtained effectiveness significantly. Nonetheless, adjusting the topology of neural networks with a different number of hidden layers or a different number of nodes in each of them has a notable influence on the achieved accuracy. Our two proposed models and the evaluations described in the paper from section A.1 indicate that such a distributed language representation performs well, providing sometimes better effectiveness than state-of-the-art methods. More specifically, we observe that the second model (document vector) shows better results than the first model (concatenation of word vectors), and the second model also tends to achieve high accuracy rates compared to the selected baselines. However, the proposed decision of the authorship attribution cannot be traced back to easily understandable reasons due to the system being a black box. Therefore, the final user does not get any explanations justifying the proposed attribution and estimating some degree of support or belief that the proposed author is the right one is harder to specify concretely. The effectiveness of all methods depends mostly on the size of the corpora. Moreover, the results indicate that none of the proposed authorship attribution methods dominates all the others in every case. For instance, k-NN can outperform many approaches in the smallest data set while NSC works especially well in the biggest collections. Different strategies can provide the best performance for individual corpora (e.g., MLP or LDA for the Federalist Papers, NSC with La Stampa corpus, the second distributed learning model for the Glasgow Herald collection). However, for the two biggest corpora (Glasgow Herald and La Stampa) having a large number of possible authors for texts published during the same year, the deep learning approaches provide the highest accuracy rates. To build our system for text clustering with styles, we learned that a simple authorship analyzing model could compete with more complex ones.. 24.
(35) 3.2. A Simple and Efficient Algorithm for Authorship Verification. Simply attributing a text sample to a set of authors is plausible as long as the list of possible authors is limited and complete. Otherwise, we have to have a method to verify or contradict the authorship of a particular writer for an individual text sample. If the writing style used in a query text Q is similar enough to the one employed by the author Av that we want to verify, then we can confirm the shared authorship. Otherwise, we can contradict it. Nonetheless, deciding if Av wrote Q should not just result in a binary answer, but ideally, a degree of certainty is obtained. The problem is to define what "similar enough" writing style means, if there exists a space between verification and contradiction, how big that range is, and finally a way of computing the degree of certainty. As features, we extract the 200 most frequent tokens (MFT, words and punctuation symbols) solely from Q. Therefore, we do not use a general feature list but collect the features dynamically depending on the text in question. This selection means the classifier does not require a learning stage to perform the feature selection. Using the MFT from Q assures that we apply features that are the most pertinent for the text in question. This representation has the additional benefit that the features are independent of the language (only a tokenizer that can handle the script is required) or genre used. In our case, we successfully tested it with the Dutch, English, Spanish, and Greek languages and the essay, novel, review, and newspaper article genres. Although intuitively the concept of a word seems simple, there is no absolutely "correct" number of words in a text. The number of words depends on a series of decisions about what counts as a word. For instance in "Ann’s reading in John’s book." the tokenizer could split the sentence based on different rules. If the ten tokens ann. ’. s. reading. in. john. ’. s. book. .. are produced, the genitive possessive case "’s" from John is treated the same as the contracted third person singular form of "to be" from Ann. However, if we leave them as the five tokens ann’s. reading. in. john’s. book.. then it is probable that the strings "ann’s", "john’s", and "book." are hapax legomenon and won’t be useful in the authorship analysis. Different text-analysis programs and different analysts produce various tokenizations. There is no harm in this, but in every analysis, we have to treat the words in a consistent way across all of the texts [18]. If Av has similar usage of the MFT, we can verify the shared authorship. As a distance measure, we use the Manhattan distance (L1 norm), meaning the sum of the absolute differences of all features between Q and Av , which we denote ∆(Q, Av ), as presented in Equation 2.1. This feature selection and distance calculation model, we called it Spatium-L1 (a Latin word meaning distance), builds the foundation of our targeted system. 25.
(36) For example, assume that Text A corresponds to "The fox, the moose, and the deer jump over a wolf." After ignoring the letter case and the hapax legomenon, the resulting vector is [the , ] = [3 2] giving the final relative representation [the , ] = [0.6 0.4] based on the term frequency. Assuming Text B contains the following sentence: "The quick fox and the brown deer jump over the lazy dog and a cat." When computing the distance ∆(A, B), we use the terms {the ,} because they are extracted from the representation of Text A. The representation of Text B is therefore [the , ] = [1.0 0.0] and calculating the Manhattan distance between these two vectors gives us ∆(A, B) = 0.8. Analogously, when estimating the distance ∆(B, A), only terms belonging to B’s representation are considered, namely {the and}, giving us the representation [the and] = [0.6 0.4] for Text B and [the and] = [0.75 0.25] for Text A, resulting in a distance ∆(B, A) = 0.3. This measure is not symmetric due to the choice of the terms. To verify whether the resulting distance is small rather than large, we randomly select m impostors (e.g., m = 3) from a text collection (in the same language and same genre) and only retain the distance of the closest sample. We repeat this step r times (e.g., r = 5) and then compute the mean over those smallest distances in the r rounds to accommodate the probabilistic influence. The mean smallest distance from the text in question to the impostors ∆(Q, Amr ) is then compared to ∆(Q, Av ). If ∆(Q, Av ) is more than 2.5% below (or above) ∆(Q, Amr ) we can confirm (or contradict) that Q was written by Av . Finally, if the value of ∆(Q, Av ) lies within ±2.5% of ∆(Q, Amr ) then we can neither confirm nor contradict the shared authorship. The limit of this 5% window was chosen arbitrarily but corresponds to a typical threshold value in statistical tests. Based on this simple rule, we can define when there is enough evidence to propose an answer or when the attribution scheme is unable to decide with a high degree of certainty. Compared to the results of the PAN CLEF 2014 evaluation campaign, our proposed attribution scheme usually achieved a performance among the three best systems within the six different test collections. When computing an overall mean over the six test collections, this approach shows the best performance level. The 5% decision window gives us a significantly higher c@1 than when always taking a decision and only considering the raw accuracy. In the PR domain (Public Relations) it is known that a happy customer will talk to only 4 to 6 friends about a good event but a dissatisfied user will tell 9-15 people if they had a bad experience [7]. This phenomenon is relatively unknown in the academic world where the traditional performance measures tend to underestimate the real "cost" of wrong classifications. Inspecting the merit score, we can see that the Spatium-L1 system generates a good overall performance and is more cautious about the danger of incorrect decisions. We can explain the high result by the fact that this verification scheme tends to opt more often for a don’t know answer when the decision is uncertain than risking a wrong answer. Having enough evidence (surpassing the 2.5% threshold), Spatium-L1 is then able to propose either an affirmative answer or not. Therefore, we have a method to decide for each text pair if the same person wrote them, and the degree of certainty with which we can give the answer to this question. To build our text clustering system with styles, we learned that focusing on. 26.
Figure


+7


Documents relatifs
Overview of the Author Identification Task at PAN-2017: Style Breach Detection and Author Clustering
Examples of unsuper- vised tasks are intrinsic plagiarism detection (identification of plagiarized parts within a given document without a reference collection of authentic
To conclude, using the top 300 most frequent terms of each document and character 2-grams, a BCubed F-score of 0.54 is achieved on the, provided, training data with a threshold of
For three languages out of four (English, Spanish and Portuguese), word unigrams obtain the highest joint accuracy from all the individual classifiers. For Arabic, character
Complete author clustering: We do a detailed analysis, where we need to identify the number k of different authors (clusters) in a collection and assign each docu- ment to exactly
Dozens of approaches have been proposed for the two author identification subtasks authorship attribution and authorship verification, so that evaluating an author obfuscation
The best performing system, by a small margin, was a system consisting of training libSVM (for English) and liblinear (for Dutch) classifiers on the combination of typed
A document could be considered as being by the same author if the highest similarity values obtained in comparing the known document to the unknown documents –
Given a document collection, the task is to group documents written by the same author, so that each cluster corresponds to a different author.. This task can also be viewed as one
