ARTICLE
Alcohol Drinking in Never Users of Tobacco, Cigarette
Smoking in Never Drinkers, and the Risk of Head and
Neck Cancer: Pooled Analysis in the International
Head and Neck Cancer Epidemiology Consortium
Mia Hashibe , Paul Brennan , Simone Benhamou , Xavier Castellsague , Chu Chen , Maria Paula Curado , Luigino Dal Maso , Alexander W . Daudt , Eleonora Fabianova , Victor Wünsch-Filho , Silvia Franceschi , Richard B . Hayes , Rolando Herrero , Sergio Koifman , Carlo La Vecchia , Philip Lazarus , Fabio Levi , Dana Mates , Elena Matos , Ana Menezes , Joshua Muscat , Jose Eluf-Neto , Andrew F . Olshan , Peter Rudnai , Stephen M . Schwartz , Elaine Smith , Erich M . Sturgis , Neonilia Szeszenia-Dabrowska , Renato Talamini , Qingyi Wei , Deborah M . Winn , David Zaridze , Witold Zatonski , Zuo-Feng Zhang , Julien Berthiller , Paolo BoffettaBackground At least 75% of head and neck cancers are attributable to a combination of cigarette smoking and alcohol drinking. A precise understanding of the independent association of each of these factors in the absence of the other with the risk of head and neck cancer is needed to elucidate mechanisms of head and neck carcinogenesis and to assess the efficacy of interventions aimed at controlling either risk factor.
Methods We examined the extent to which head and neck cancer is associated with cigarette smoking among never drinkers and with alcohol drinking among never users of tobacco. We pooled individual-level data from 15 case – control studies that included 10 244 head and neck cancer case subjects and 15 227 control subjects, of whom 1072 case subjects and 5775 control subjects were never users of tobacco and 1598 case subjects and 4051 control subjects were never drinkers of alcohol. Odds ratios (ORs) and 95% confidence intervals (CIs) were estimated using unconditional logistic regression models. All statistical tests were two-sided. Results Among never drinkers, cigarette smoking was associated with an increased risk of head and neck cancer (OR
for ever versus never smoking = 2.13, 95% CI = 1.52 to 2.98), and there were clear dose – response relation-ships for the frequency, duration, and number of pack-years of cigarette smoking. Approximately 24% (95% CI = 16% to 31%) of head and neck cancer cases among nondrinkers in this study would have been pre-vented if these individuals had not smoked cigarettes. Among never users of tobacco, alcohol consumption was associated with an increased risk of head and neck cancer only when alcohol was consumed at high fre-quency (OR for three or more drinks per day versus never drinking = 2.04, 95% CI = 1.29 to 3.21). The associ-ation with high-frequency alcohol intake was limited to cancers of the oropharynx/hypopharynx and larynx. Conclusions Our results represent the most precise estimates available of the independent association of each of the two main risk factors of head and neck cancer, and they exemplify the strengths of large-scale consortia in cancer epidemiology.
J Natl Cancer Inst 2007;99: 777 – 89
Affiliations of authors : International Agency for Research on Cancer, Lyon, France (MH, P. Brennan, SF, JB, P. Boffetta); INSERM, U794, Evry, France (SB); Institut Català d’Oncologia, Barcelona, Spain (XC); Fred Hutchinson Cancer Research Center, Seattle, WA (CC, SMS); Hospital Araujo Jorge, Goiania, Brazil (MPC); Aviano Cancer Centre, Aviano, Italy (LDM, RT); Hospital de Clinicas de Porto Alegre, Porto Alegre, Brazil (AWD); Specialized State Health Institute, Banská Bystrica, Slovakia (EF); Universidade de Sao Paulo, Sao Paulo, Brazil (VWF, JEN); National Cancer Institute, Bethesda, MD (RBH, DMW); Instituto de Investigación Epidemiológica, San José, Costa Rica (RH); Escola Nacional de Saude Publica, Rio de Janeiro, Brazil (SK); Istituto di Ricerche Farmacologiche Mario Negri and University of Milan, Milan, Italy (CLV); Penn State College of Medicine, Hershey, PA (PL, JM); Institut de médecine sociale et préventive [IUMSP], Université de Lausanne, Lausanne, Switzerland (FL); Institute of Public Health, Bucharest, Romania (DM); Institute of Oncology Angel H. Roffo, University of Buenos Aires, Argentina (EM);
Universidade Federal de Pelotas, Pelotas, Brazil (AM); University of North Carolina School of Public Health, Chapel Hill, NC (AFO); National Institute of Environmental Health, Budapest, Hungary (PR); College of Public Health, University of Iowa, Iowa City, IA (ES); University of Texas M. D. Anderson Cancer Center, Houston, Texas (EMS, QW); Institute of Occupational Medicine, Lodz, Poland (NSD); Cancer Research Centre, Moscow, Russia (DZ); Maria Sklodowska Institute of Oncology, Warsaw, Poland (WZ); University of California, Los Angeles, School of Public Health, Los Angeles, CA (ZFZ) . Correspondence to: Mia Hashibe, PhD, Gene–Environment Epidemiology Group, International Agency for Research on Cancer, 150 cours Albert Thomas, 69008 Lyon, France (e-mail: [email protected])
See “Notes” following “References.” DOI: 10.1093/jnci/djk179
© The Author 2007. Published by Oxford University Press. All rights reserved. For Permissions, please e-mail: [email protected].
Head and neck cancers are a group of related neoplasms that arise in the oral cavity, pharynx, and larynx. Almost 600 000 new cases of head and neck cancer and 300 000 deaths occur worldwide each year (1). At least 75% of head and neck cancers diagnosed in Europe, the United States, and other industrialized regions are attributable to the combination of cigarette smoking and alcohol drinking (2,3). However, the respective contributions of these risk factors to head and neck cancer risk are diffi cult to study be -cause these two habits are strongly associated with each other (4,5). A precise understanding of the independent associations between cigarette smoking and alcohol drinking and the risk of head and neck cancer has important implications for elucidating the mechanisms of head and neck carcinogenesis and for assessing the ef -fects of interventions to modify these risk factors.
The etiologic factors for head and neck cancer in individuals who have never used tobacco products are not yet well understood. Of the head and neck cancer patients, 5% – 30% are never smokers (6 – 19). Head and neck tumors in never smokers are thought to be distinct from those in smokers because they have fewer TP53 gene mutations, a lower frequency of loss of heterozygosity on chromo-some arms 3p and 4q and at chromochromo-some 11q13 (chromosomal sites at which loss of heterozygosity occurs during the progression
of oral cancer), and fewer microsatellite alterations than head and neck tumors that arise in smokers (20). Analyses of never users of tobacco are necessary to establish the etiologic role of risk factors other than tobacco use because tobacco use is the primary risk fac-tor for head and neck cancer (21), and thus, residual confounding by tobacco use is diffi cult to rule out. Similarly, because alcohol drinking is a risk factor for head and neck cancer (22), analyses of nondrinkers are needed to rule out confounding by alcohol when estimating the effect of cigarette smoking. A pooled analysis within a consortium is a cost-effective method for generating a large sample size for the analysis of rare subgroups such as head and neck cancer patients who are never users of tobacco and never drinkers.
Previous estimates of the independent associations among cigarette smoking, alcohol drinking, and the risk of head and neck cancer (23 – 28) were imprecise because of the small numbers of case subjects who were never drinkers or never tobacco smokers (typically fewer than 100). To overcome this limitation, we con-ducted a pooled analysis of cigarette smoking among never drinkers and alcohol drinking among never users of tobacco. This analysis was made possible by the establishment, in 2004, of the International Head and Neck Cancer Epidemiology (INHANCE) consortium as an international collaboration among research groups that were conducting large, ongoing (or recently com-pleted) molecular epidemiology studies of head and neck cancer. The primary goal of the consortium is to address research questions — such as the independent associations among cigarette smoking, alcohol drinking, and head and neck cancer — that are diffi cult to answer in individual studies, which typically include 500 – 1000 case subjects and a comparable number of control sub-jects. Our goal was to examine whether cigarette smoking and alcohol drinking are each a risk factor in the absence of the other and to explore whether risk estimates differ by cancer site within the head and neck.
Methods
StudiesInvestigators who had recently conducted molecular epidemiologic studies of head and neck cancers were invited to participate in the INHANCE consortium. The included studies had to have a proto-col for the recruitment of case and control subjects and to have used a structured epidemiologic questionnaire that addressed both tobacco and alcohol use. We also invited investigators who had conducted high-quality, large-scale epidemiologic studies that lacked a molecular component to participate in the INHANCE consortium. The eligibility criteria for these studies were that they include more than 300 head and neck cancer case subjects and that information be available on demographic and tumor characteristics, alcohol consumption, and tobacco use habits (i.e., cigarettes, cigars, pipes, and, where relevant, snuff and chewing tobacco).
We initially pooled the data from 15 individual case – control studies (6 – 19) that included 10 302 head and neck cancer case subjects and 15 329 control subjects (data version 1.0). Case and control subjects with missing data on age, sex, or race/ethnicity and case subjects with missing information on the site of origin of their cancer (58 case subjects and 102 control subjects) were C O N T E X T A N D C A V E A T S
Prior knowledge
Although at least 75% of head and neck cancers diagnosed in industrialized regions are attributable to the combination of ciga-rette smoking and alcohol drinking, the respective contributions of these risk factors to head and neck cancer risk are unclear because the two habits are strongly associated with each other.
Study design
A pooled analysis of data from 15 case – control studies of head and neck cancer risk and cigarette smoking among never drinkers and head and neck cancer risk and alcohol drinking among never users of tobacco.
Contribution
Among never drinkers, cigarette smoking was associated with an increased risk of head and neck cancer, and there were clear dose – response relationships for the frequency, duration, and number of pack-years of cigarette smoking. Among never users of tobacco, high-frequency alcohol consumption was associated with increased risks of cancers of the oropharynx/hypopharynx and larynx only.
Implications
Approximately one quarter of the head and neck cancers among the never drinkers were attributable to ever cigarette smoking, assuming a causal relationship. Only 7% of the head and neck can-cers were attributable to alcohol drinking among the never users of tobacco, assuming a causal relationship.
Limitations
Misclassification of alcohol exposure, particularly exposure to hard liquors, and recall bias could have influenced the observed associa-tions. Regional differences in social acceptance of tobacco habits and alcohol consumption may have influenced how a subject responded to questions about these practices in a face-to-face interview.
excluded from this analysis. Thus, the data for this analysis in -cluded 10 244 head and neck cancer case subjects and 15 227 con-trol subjects.
The characteristics of the individual studies included in the pooled data are shown in Table 1 . The studies are referred to by location and by whether they are multicenter in study design. Most were hospital-based case – control studies, and in most studies, the control subjects were frequency matched to the case subjects on age, sex, and additional factors (e.g., study center, hospital, and race/ethnicity). The Los Angeles study individually matched the control subjects to case subjects on age decade, sex, and neighbor-hood, although in the study analysis the matching was broken. Face-to-face interviews were conducted in all studies except for the Iowa study, in which subjects completed self-administered ques-tionnaires. Written informed consent was obtained from all study subjects, and the investigations were approved by the institutional review board at each study center. Blank questionnaires were col-lected from all the individual studies to assess the comparability of the collected data and of the wording of interview questions among the studies. Data from individual studies were received at the International Agency for Research on Cancer (IARC) with personal identifi ers removed. Each data item was checked for illogical or missing values. Queries were sent to the investigators to resolve inconsistencies.
Case subjects were included in this analysis if their tumor had been classifi ed by the original study as an invasive tumor of the oral cavity, oropharynx, hypopharynx, oral cavity or pharynx not otherwise specifi ed, or larynx or head and neck cancer unspecifi ed according to the International Classifi cation of Diseases for Oncology, Version 2 [ICD-O-2; (29)] or the International Classifi cation of Diseases, 9th [ICD-9; (30)] or 10th [ICD-10; (31)] Revision. Subjects with salivary gland cancers (ICD-O-2 codes C07 – C08) were excluded from our analysis because the etiologic pattern of these cancers differs from that of head and neck can-cers (32). For studies that used ICD-O-2 or ICD-10 classifi cation (Central Europe, Iowa, Los Angeles, Seattle, Puerto Rico, and South America studies), tumors were assigned to one of the six categories as follows: 1) oral cavity (includes lip, tongue, gum, fl oor of mouth, and hard palate): codes C00.3 – C00.9, C02.0 – C02.3, C03.0, C03.1, C03.9, C04.0, C04.1, C04.8, C04.9, C05.0, C06.0 – C06.2, C06.8, and C06.9; 2) oropharynx (includes base of tongue, lingual tonsil, soft palate, uvula, tonsil, and oropharynx): codes C01.9, C02.4, C05.1, C05.2, C09.0, C09.1, C09.8, C09.9, C10.0 – C10.4, C10.8, and C10.9; 3) hypopharynx (includes pyriform sinus and hypopharynx): codes C12.9, C13.0 – C13.2, C13.8, and C13.9; 4) oral cavity, pharynx unspecifi ed or overlapping: codes C02.8, C02.9, C05.8, C05.9, C14.0, C14.2, and C14.8; 5) larynx (includes glottis, supraglottis, and subglottis): codes C32.0 – C32.3 and C32.8 – C32.9; and 6) head and neck cancer unspecifi ed: defi ned as overlapping lesions when more than one ICD topo-graphic code was available for each case subject and the multiple sites were not within one of the categories listed above.
For studies that classifi ed tumor site data according to ICD-9 codes (Milan, Aviano, France, Italy Multicenter, Switzerland, North Carolina, Tampa, and International Multicenter studies), the assigned codes were converted to ICD-O-2 codes. For the Houston study, instead of the original ICD code, we received the
study surgeon’s classifi cation of subsites as oral cavity, oropharynx, hypopharynx, or larynx, consistent with the ICD-O-2 group designations listed above. There were 2854 case subjects with oral cavity cancer, 3358 with pharyngeal cancer (oropharyngeal or hypopharyngeal), 905 with oral cavity/pharynx not otherwise specifi ed, 2821 with laryngeal cancer, and 306 with unspecifi ed head and neck cancer.
Some studies (i.e., the France, North Carolina, Tampa, and Houston studies) restricted eligibility to case subjects with squa-mous cell carcinomas (SCC). For other studies that provided the ICD-O-2 histologic coding for each tumor (i.e., the Switzerland, Central Europe, Seattle, Los Angeles, Puerto Rico, and South America studies and the following centers in the International Multicenter study: Australia, Aviano, Barcelona, Canada, Cuba, Granada, Ireland, Milan, Poland, Sevilla, and Udine), we used the following codes to identify case subjects with SCC: 8070/3, 8071/3, 8072/3, 8073/3, 8074/3, 8075/3, 8076/3, 8078/3, 8083/3, and 8084/3. The Iowa study provided a variable instead of ICD coding to specify which case subjects had SCC. For the Milan and Aviano studies, the Italy Multicenter study, and four centers in the International Multicenter study (i.e., Bangalore, Madras, and Trivandrum in India and Khartoum in Sudan), no data were avail-able on histologic type. Of the 7613 head and neck cancer case subjects for whom histologic information was available, 7025 (92.3%) had SCC.
The questions about tobacco and alcohol use on study ques-tionnaires were conceptually similar across studies, although the exact wording differed. The questions about tobacco and alcohol use were examined carefully for comparability before variables were created for this report. Each study subject was asked whether he or she had ever been a smoker of cigarettes, cigars, or pipes. However, the defi nitions of ever smoking varied widely among the individual studies (i.e., for cigarettes, ever smoking was defi ned as smoked ≥ 100 cigarettes in a lifetime [Central Europe, Los Angeles, North Carolina, Puerto Rico, Seattle, and Houston studies], as smoked one or more cigarettes per day for ≥ 1 year [International Multicenter, Tampa, South America, Milan, Aviano, Italy Multicenter, and Switzerland studies], as smoked one-half pack or more per week for ≥ 1 year [Iowa study], and as smoked “regularly” [France study]; for cigars and pipes, ever smoking was defi ned as smoked cigars or pipes for ≥ 6 months [Seattle, North Carolina, and Puerto Rico studies], as smoked one or more cigars or one or more pipefuls of tobacco per month for ≥ 6 months [Los Angeles study], as smoked one or more cigars or pipes per day for ≥ 1 year [Milan, Aviano, Italy, Switzerland, South America], as smoked cigars or pipes “regularly” [France and Central Europe studies], as ever used cigars or pipes [Houston study], as smoked at least one cigar or one pipeful of tobacco a week for ≥ 1 year [Iowa], as smoked daily for >1 year [International Multicenter study], and as smoked a cigar or pipe once a day for ≥ 1 year [Tampa study]. Variables on the frequency (i.e., number of cigarettes, cigars, or pipes smoked per day), duration (in years), and pack-years (i.e., cumulative smoking) of tobacco smoking were available in all stud-ies. For several studies (i.e., the Central Europe, South America, France, and North Carolina studies), the frequency and duration variables were calculated centrally; for all other studies, we used the data calculated by the individual studies.
Table 1.
Summary of individual studies in INHANCE consortium pooled data version 1.0, by region and study period
*
Study location (reference
† ) Recruitment period Case subjects Control subjects ‡ Source Participation rate, % Age eligibility, y Total No. of never drinkers No. of never users of tobacco Source Participation rate, % Total No. of never drinkers
No. of never users of tobacco
Europe Milan, Italy (6) 1984 – 1989 Hospital 95 § <80 416 75 28 Hospital (unhealthy) 95 § 1531 305 575 Aviano, Italy (7) 1984 – 1989 Hospital >95 § >18 482 7 2 6 Hospital (unhealthy) 95 § 855 57 277 Paris, France (8) 1987 – 1992 Hospital 95 § NA 323 12 0 Hospital (unhealthy) 95 § 234 19 0
Italy (Aviano, Milan, Latina)
|| (9) 1990 – 1999 Hospital >95 18 – 80 1058 37 68 Hospital (unhealthy) 95 2579 246 987 Switzerland (10) 1991 – 1997 Hospital 95 <80 516 39 30 Hospital (unhealthy) 95 883 435 418
Central Europe (Banska
Bystrica, Bucharest, Budapest, Lodz, Moscow) || (11) 1998 – 2003 Hospital 96 ≥ 15 762 14 49 Hospital (unhealthy) 97 907 62 308 North America Seattle, WA (12) 1985 – 1995 Cancer regist y 54.4, 63.3 ¶ 18 – 65 407 16 53
Random digit dialing
63, 61 ¶ 607 45 192 Iowa (13) 1993 – 2006 Hospital 87 >17 546 137 106 Hospital (healthy) 92 759 335 285 North Carolina (14) 1994 – 1997 Hospital 88 >17 180 31 11 Hospital (unhealthy) 86 202 94 74 Tampa, FL (15) 1994 – 2003 Hospital 98 ≥ 18 207 43 37
Cancer screening clinic
(healthy) 90 897 351 345 Los Angeles, CA (16) 1999 – 2004 Cancer regist y 49 18 – 65 417 70 115 Neighborhood 67.5 1005 250 453 Houston, TX (17) 2001 – 2006 Hospital 95 ≥ 18 830 234 186 Hospital visitors >80 865 396 374 South/Central America Puerto Rico (18) 1992 – 1995 Cancer regist y 71 21 – 79 350 31 32 Residential records 83 521 112 211
South America (Buenos Aires,
Havana,
Goiãnia,
Pelotas,
Porto Alegre, Rio de Janeiro,
São Paolo) || (NA) 2000 – 2003 Hospital 95 15 – 79 2191 215 123 Hospital (unhealthy) 86 1706 495 506 International
International (Italy, Spain, I
reland, Poland, Canada, Austra lia, Cuba, India, Sudan) || (19) 1992 – 1997 Hospital 88.7 NA 1559 637 208 Hospital/Community 87.3 1676 849 770 Total 10 244 1598 1072 15 227 4051 5775 *
INHANCE = International Head and Neck Cancer Epidemiology; NA = not applicable/not available.
†
Representative publication in which study methods are described.
‡
All studies frequency matched control subjects to case subjects on age and sex. Additional frequency matching factors included
study center (Italy, Central Europe, South America, and International Multicenter
studies), hospital (France study), ethnicity (Tampa study), and neighborhood (Los Angeles study).
§
Participation rate was not formally assessed, estimated response rate reported.
||
Multicenter study.
¶
Two response rates are reported because data were collected in two population-based case
–
control studies, the first from 1985 to 1989 among men and the second from 1990 to 1995 among men and women.
Information about snuff use and chewing habits was collected by the Puerto Rico study, the International Multicenter studies, and all studies in North America. Snuff use and chewing are not common behaviors in Europe or South America, except in specifi c populations (e.g., Norway and Sweden) that were not included in the pooled dataset. For the Indian study population in the International Multicenter study, information on betel quid and areca nut chewing was collected. The defi nitions of ever chewing and ever use of snuff differed across studies (i.e., as ever use of snuff or chew for ≥ 6 months [Seattle, North Carolina, and Puerto Rico studies], as use of at least one small can of snuff or one pouch of chewing tobacco per week for ≥ 1 year [Iowa study], as use of chew or snuff at least once per day for ≥ 1 year [Tampa study], as daily chewing of tobacco, betel quid, areca nut, or pan masala or daily snuffi ng of tobacco for ≥ 1 year [International Multicenter studies], as at least one plug of tobacco or one pinch of snuff of tobacco per month for ≥ 6 months [Los Angeles study], and as ever use of snuff or dip or chewing tobacco [Houston study]). Frequency and dura-tion variables for chewing and snuff use habits were pooled across relevant studies. For this study, never users of tobacco were defi ned as individuals who had not used cigarettes, cigars, pipes, snuff, or chewing products during their lifetimes.
In the alcohol section of the study questionnaires, subjects were asked if they were alcohol drinkers; for those who responded that they were, subsequent questions were asked about the fre-quency of drinking, the duration of drinking, and the different types of alcoholic beverages consumed (i.e., beer, wine, hard liquors, and/or aperitifs). The defi nitions of ever alcohol drinking were “ever” consumed alcohol (France, Central Europe, Aviano, Milan, Italy Multicenter, and Switzerland studies); consumed more than four drinks in a year (Seattle study); consumed one or more drinks per month for 6 or more months in a lifetime (Los Angeles study); consumed 12 or more drinks of any kind of alcohol in a lifetime (Puerto Rico study); consumed alcoholic beverages one or more times per month (International Multicenter and South America studies); consumed an average of one or more drinks per week for 1 or more years (Iowa study); consumed alco-hol one or more times per week for 1 or more years (Tampa and Houston studies); and consumed beer, wine, or liquor four or more times per month (North Carolina study).
The volume specifi cation for alcoholic beverages by type dif-fered across studies. For example, a glass of wine was defi ned as 100 – 150 mL in the European studies, whereas the North American studies defi ned a wine glass as 3.6 – 5 ounces. To estimate cumula-tive alcohol consumption (milliliters of beverage over a lifetime) for each beverage type, we converted into milliliters the beverage volume specifi ed in the questionnaire for the alcoholic beverage type and multiplied this value by the number of that beverage type consumed per week and the duration of beverage type consump-tion reported. We then multiplied the volume percentage of pure ethanol by beverage type (i.e., 5% for beer, 12% for wine, 40% for liquor, and 40% for aperitifs) to the beverage volume (33) to esti-mate the cumulative consumption of pure ethanol for each subject in milliliters. We then divided the cumulative consumption of pure ethanol by 15.6 mL, the mean volume of pure ethanol per drink across all alcoholic beverage types for the 15 studies, to calculate the lifetime number of standardized drinks consumed by each
subject (i.e., one standardized drink contains 15.6 mL of pure ethanol). Cumulative alcohol consumption was then expressed in drink-years. To obtain the frequency of consumption of each alco-holic beverage type, the cumulative consumption for each type of alcoholic beverage was divided by the corresponding duration. For the overall frequency of alcohol drinking (i.e., the number of drinks per day), the frequency of consumption of each alcoholic beverage type was weighted by the corresponding duration. For the France, Iowa, and Tampa studies, data on duration by type of alcoholic beverage were not available; thus, the average of the frequency of all alcoholic beverage types within those studies was used as the overall frequency.
Data on passive smoking exposure at home and at work (never/ ever), which were available in six studies (Central Europe, Tampa, Los Angeles, Houston, Puerto Rico, and South America studies), were pooled. A variable representing the number of fi rst-degree relatives who had head and neck cancer was also pooled across the 12 studies that had assessed this information (Milan, Aviano, Italy Multicenter, Switzerland, Central Europe, North Carolina, Tampa, Los Angeles, Houston, Puerto Rico, South America, and International Multicenter studies).
Statistical Methods
The associations between head and neck cancer and cigarette smoking by drinking status and between head and neck cancer and alcohol drinking by tobacco use status were assessed by estimating odds ratios (ORs) and 95% confidence intervals (CIs) using uncon-ditional logistic regression models for each case – control study. The models included age (<40, 40 – 44, 45 – 49, 50 – 54, 55 – 59, 60 – 64, 65 – 69, 70 – 74, or ≥ 75 years), sex, education level (no formal education, less than junior high school, some high school, high-school gradu-ate, vocational/some college, or college graduate/postgraduate), race/ethnicity (non-Hispanic white, black, Hispanic/Latino, Asian/ Pacific Islander, Latin American, other), and study center. To calculate summary estimates of associations, the study-specific esti-mates were included in a two-stage random-effects logistic regres-sion model that included the DerSimonian and Laird (34) estimator, which allows for unexplained sources of heterogeneity among studies. Pooled odds ratios were also estimated with a fixed-effects logistic regression model that adjusted for age, sex, education level, race/ethnicity, and study center. In addition, we adjusted for years of cigar smoking (as a continuous variable) and years of pipe smoking (as a continuous variable) when assessing cigarette smok-ing among never drinkers. We estimated odds ratios for cigarette smoking for both drinkers and nondrinkers in the same model for each study and odds ratios for alcohol drinking among tobacco users and never users of tobacco so that all the data could be used to estimate confounder relationships.
For subjects with a missing education level (17 case subjects and 80 control subjects among never users of tobacco, 56 case subjects and 108 control subjects among the never drinkers), we applied multiple imputation with the PROC MI procedure in SAS statisti-cal software (version 9.1; SAS Institute Inc, Cary, NC) so that these subjects could be included in the analyses. We assumed that the education data were missing at random, i.e., whether or not education level was missing did not depend on any other unob-served or missing values (35). We used a logistic regression model
(36) to predict education level for each of the geographic regions separately using age, sex, race/ethnicity, study center, and case – control status as the covariates. The logistic regression results to assess summary estimates for cigarettes and alcohol drinking for the fi ve imputations were combined by using the PROC MIANALYZE procedure in SAS statistical software.
We tested for heterogeneity among the study odds ratios by conducting a likelihood ratio test comparing a model that included the product terms between each study (other than the reference study) with the variable of interest and a model without a product terms (degrees of freedom = number of studies − 1), for the risk of head and neck cancer combined and for the risk of each of the head and neck cancer subsites. We report the random-effects estimates for situations in which heterogeneity was detected consistently for assessments of the risk of head and neck cancers associated with cigarette smoking among never drinkers or with alcohol drinking among never users of tobacco. Fixed-effects estimates are reported for all other models. We examined whether the results from the two-stage random-effects model and from the fi xed-effects logistic regression model were comparable to each other in terms of the magnitude of the effect. We also conducted an infl uence analysis, in which each study was excluded one at a time to ensure that the statistical signifi cance and magnitude of the overall summary estimate were not dependent on any one study.
Analyses were stratifi ed by cancer site (oral cavity, pharynx, oral cavity/pharynx not specifi ed, and larynx), age category ( ≤ 45, 46 – 50, 51 – 60, 61 – 70, and >70 years), sex, race/ethnicity, education level, source of control subjects (hospital based versus population based), and geographic region (Europe, North America, South/ Central America, others). We also repeated the analysis restricting the cases to SCC histology within the set of studies that had collected histology information. All statistical tests were sided, and P value less than .05 was considered to be statistically signifi cant.
The attributable fraction (AF) for cigarette smoking among never drinkers and for alcohol drinking among never users of tobacco was estimated using the formula AF = p(ec) × (OR − 1)/OR, where p(ec) is the proportion exposed among the case subjects (4).
Results
Characteristics of Studies and Subjects
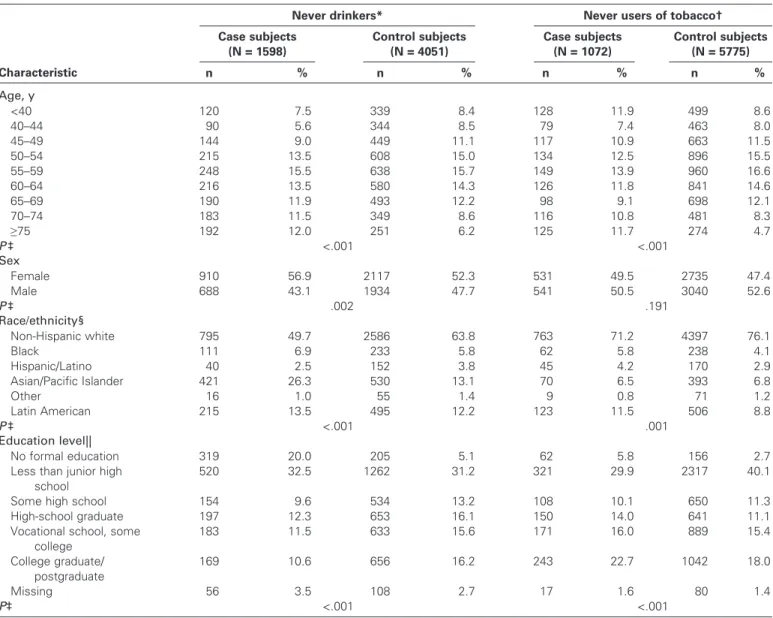
Approximately 15.6% of the case subjects and 26.6% of the control subjects in data version 1.0 were never drinkers and 10.5% of the case subjects and 37.9% of the control subjects were never users of tobacco ( Table 1 ). The International Multicenter study contributed 39.9% of the case subjects and 21.0% of the control subjects who were never drinkers; the majority of these subjects (406 case sub-jects and 487 control subsub-jects) were from India, where the preva-lence of alcohol drinking is low. The International Multicenter and Houston studies contributed the largest proportions of case sub-jects who were never users of tobacco (19.4% and 17.4%, respec-tively). Characteristics of case and control subjects who were never drinkers or never users of tobacco are shown in Table 2 . The case and control subjects among the never drinkers and among the never users of tobacco differed with respect to distributions of age, sex,
race/ethnicity, and education level. The never drinkers were more likely to be younger than 40 years or 75 years or older, female, and Asian/Pacific Islanders and had less education than the overall group of case subjects. The never users of tobacco were more likely to be younger than 40 years or 75 years or older and female and had completed a higher level of education than the overall group of case subjects.
Cigarette Smoking and Head and Neck Cancer Risk Among Never Drinkers
Cigarette smoking was associated with an increased risk of head and neck cancer among never drinkers, and there were clear dose – response relationships for smoking frequency, duration, and cumu-lative consumption ( Table 3 ). Figure 1 shows a forest plot of the study-specific risk estimates for ever versus never cigarette smoking among never drinkers and the combined risk estimate (OR for ever versus never cigarette smoking = 2.13, 95% CI = 1.52 to 2.98). Seven studies (i.e., the Milan, Italy Multicenter, Switzerland, North Carolina, Houston, South America, and International Multicenter studies) reported a positive association between ever cigarette smoking and the risk of head and neck cancer in never drinkers. The Milan, Seattle, Iowa, and South America studies contributed the most to heterogeneity among the odds ratios (i.e., excluding them increased the P value for heterogeneity from <.001 to .208). When these four studies were not included in the summary esti-mate, the observed association (OR = 2.02, 95% CI = 1.61 to 2.53) was consistent with the results from the full analysis. The results also did not change substantially when we restricted the analysis to large-scale studies (i.e., those with more than 500 case subjects in the individual study). Because a large proportion of the never drink-ers were from India, we also estimated the odds ratio after exclud-ing this group of subjects and found that doexclud-ing so did not change the odds ratio substantially (OR = 2.21, 95% CI = 1.54 to 3.18). The influence analysis showed that no one study was responsible for either the magnitude or the statistical significance of the sum-mary estimate.
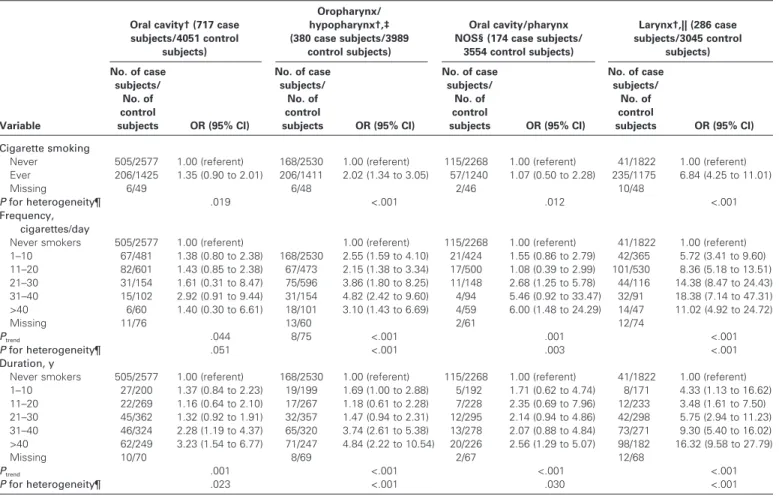
We next examined risks associated with specifi c head and neck cancer subsites. The risk of laryngeal cancer was strongly associ-ated with cigarette smoking among never drinkers, whereas the risk of oral cavity and pharyngeal cancers was not as strong ( Table 4 ). These differences and magnitudes of the risk estimates were not affected by excluding individuals who smoked cigars or pipes or who had chewing or snuff use habits. Exclusion of the subjects from India also did not change the heterogeneity in associations by cancer subsite. No strong differences among the strata were observed in the analysis of cigarette smoking among never drinkers stratifi ed by age, race, ethnicity, education level, or study design (data not shown).
The association between ever smoking and the risk of head and neck cancer among never drinkers was slightly stronger for women (OR = 2.33, 95% CI = 1.56 to 3.49) than for men (OR = 1.65, 95% CI = 1.14 to 2.39), but this difference was not statisti-cally signifi cant; this sex difference was not apparent for associa-tions with smoking frequency and duration categories (data not shown). Cigarette smoking was associated with greater risks of head and neck cancer among never drinkers for studies in Europe (OR for ever versus never smoking = 3.45, 95% CI = 1.90 to 5.89)
Table 2. Selected characteristics of head and neck cancer case subjects and control subjects who were never users of tobacco or never drinkers
Never drinkers * Never users of tobacco † Case subjects (N = 1598) Control subjects (N = 4051) Case subjects (N = 1072) Control subjects (N = 5775) Characteristic n % n % n % n % Age, y <40 120 7.5 339 8.4 128 11.9 499 8.6 40 – 44 90 5.6 344 8.5 79 7.4 463 8.0 45 – 49 144 9.0 449 11.1 117 10.9 663 11.5 50 – 54 215 13.5 608 15.0 134 12.5 896 15.5 55 – 59 248 15.5 638 15.7 149 13.9 960 16.6 60 – 64 216 13.5 580 14.3 126 11.8 841 14.6 65 – 69 190 11.9 493 12.2 98 9.1 698 12.1 70 – 74 183 11.5 349 8.6 116 10.8 481 8.3 ≥ 75 192 12.0 251 6.2 125 11.7 274 4.7 P ‡ <.001 <.001 Sex Female 910 56.9 2117 52.3 531 49.5 2735 47.4 Male 688 43.1 1934 47.7 541 50.5 3040 52.6 P ‡ .002 .191 Race/ethnicity § Non-Hispanic white 795 49.7 2586 63.8 763 71.2 4397 76.1 Black 111 6.9 233 5.8 62 5.8 238 4.1 Hispanic/Latino 40 2.5 152 3.8 45 4.2 170 2.9 Asian/Pacific Islander 421 26.3 530 13.1 70 6.5 393 6.8 Other 16 1.0 55 1.4 9 0.8 71 1.2 Latin American 215 13.5 495 12.2 123 11.5 506 8.8 P ‡ <.001 .001 Education level || No formal education 319 20.0 205 5.1 62 5.8 156 2.7
Less than junior high school
520 32.5 1262 31.2 321 29.9 2317 40.1
Some high school 154 9.6 534 13.2 108 10.1 650 11.3
High-school graduate 197 12.3 653 16.1 150 14.0 641 11.1
Vocational school, some college 183 11.5 633 15.6 171 16.0 889 15.4 College graduate/ postgraduate 169 10.6 656 16.2 243 22.7 1042 18.0 Missing 56 3.5 108 2.7 17 1.6 80 1.4 P ‡ <.001 <.001
* The definitions of ever alcohol drinking were 1) ever consumed alcohol (France, Central Europe, Aviano, Milan, Italy Multicenter, and Switzerland studies), 2) more than four drinks in a year (Seattle study), 3) one or more drinks per month for 6 or more months in a lifetime (Los Angeles study), 4) 12 or more drinks of any kind of alcohol in a lifetime (Puerto Rico study), 5) one or more times per month (Multicenter, South America studies), 6) average of one or more drinks per week for 1 or more years (Iowa study), 7) one or more times per week for 1 or more years (Tampa and Houston studies), and 8) four or more times per month of beer, wine, or liquor (North Carolina study).
† The definitions of ever cigarette smoking were 1) smoked 100 or more cigarettes in a lifetime (Central Europe, Los Angeles, North Carolina, Puerto Rico, Seattle, and Houston studies), 2) smoked one cigarette/day for 1 or more years (International Multicenter, Tampa, South America, Milan, Aviano, Italy Multicenter, and Switzerland studies), 3) smoked one-half pack per week for 1 or more years (Iowa study), and 4) smoked ”regularly” (France study). The definitions of ever cigar and pipe smoking were smoked cigars or pipes for 6 or more months (Seattle, North Carolina, and Puerto Rico studies), smoked one cigar or one pipeful of tobacco per month for 6 or more months (Los Angeles study), smoked one cigar or pipe/day for 1 or more years (Milan, Aviano, Italy, Switzerland, and South America studies), smoked cigars or pipes “regularly” (France and Central Europe studies), ever used cigars or pipes (Houston study), one cigar or one pipeful of tobacco a week for 1 or more years (Iowa), smoked daily for 1 or more years (International Multicenter study), and smoked a cigar or pipe once a day for 1 or more years (Tampa study). The definitions of ever chewing and ever use of snuff differed across studies (i.e., ever use of snuff or chew for ≥ 6 months [Seattle, North Carolina, and Puerto Rico studies], one small can of snuff or one pouch of chewing tobacco per week for ≥ 1 year [Iowa study], use chew or snuff once per day for ≥ 1 year [Tampa study], chewed daily tobacco, betel quid, areca nut, or pan masala or snuffed tobacco daily for ≥ 1 year [International Multicenter studies], one plug of tobacco or one pinch of snuff of tobacco per month for ≥ 6 months [Los Angeles study], and ever use of snuff or chew [Houston study]).
‡ Chi-square test (two-sided).
§ Information on ethnicity was not collected in the Central Europe and South America studies. In the Central Europe study, all subjects were classified as non-Hispanic white because the large majority of these populations were white. All subjects in the South American study were categorized as Latin American. We adjusted for study center in all logistic regression models as a proxy variable for race/ethnicity because each center had an expected predominant ethnic group distribution. || Information on education level was collected in each study as highest degree earned (Houston, Puerto Rico, Tampa, North Carolina, and Seattle studies), years of
education (Iowa, Los Angeles, Italy Multicenter, Aviano, Milan, Switzerland, International Multicenter, and South America studies), or age at last formal education (Central Europe study). The French study did not collect information on education level. In the analysis, for subjects with missing information on education level, we applied multiple imputation (n = 5 imputations), by using a logistic regression model, with age, sex, race/ethnicity, case – control status, and study as predictors for education level, within geographic region.
and South America (OR = 3.58, 95% CI = 1.24 to 10.30) than for studies in India and Sudan (OR = 1.17, 95% CI = 0.78 to 1.76) and North America (OR = 1.20, 95% CI = 0.86 to 1.67). Dose – response trends for the frequency, duration, and pack-years of cigarette smoking were apparent for studies in Europe, South America, and North America, but not for studies in India and Sudan (data not shown).
Alcohol Drinking and Head and Neck Cancer Risk Among Never Users of Tobacco
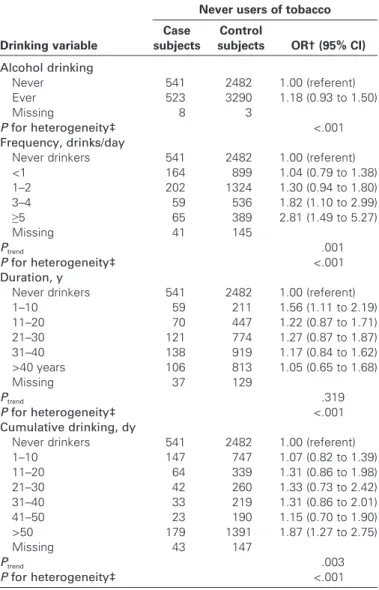
Among never users of tobacco, there was no association between ever drinking alcohol and the risk of head and neck cancer (OR = 1.18, 95% CI = 0.93 to 1.50; Table 3 ). Heterogeneity among the study estimates was indicated for ever alcohol drinking ( P for het-erogeneity<.001), for categories of frequency ( P for heterogeneity =
.006), and for duration ( P for heterogeneity<.001) of alcohol con-sumption. In an influence analysis, individual exclusions of the Italy Multicenter study (OR = 1.23, 95% CI = 0.99 to 1.53), the Seattle study (OR = 1.24, 95% CI = 0.99 to 1.54), or the Iowa study (OR = 1.23, 95% CI = 1.01 to 1.51) resulted in borderline statistically significant associations for ever drinking. No dose – response rela-tionship was apparent for the duration of alcohol use and the risk of head and neck cancer among never users of tobacco. However, consuming an increasing number of drinks per day was associated with a greater risk of head and neck cancer among never users of tobacco ( P trend = .001; Table 5 ). More specifically, never users of
tobacco who consumed three or more alcoholic drinks per day had approximately twice the risk of head and neck cancer as never drinkers (OR = 2.04, 95% CI = 1.29 to 3.21; Fig. 1 ). The influence analysis confirmed that the increased risk of head and neck cancer associated with consuming three or more drinks per day was not due to any one study. The odds ratios for alcohol drinking did not change substantially when the analysis was restricted to relatively large studies (i.e., those with more than 500 case subjects in the original study). Adjustment for family history of cancer or for pas-sive smoking also did not change the odds ratio for alcohol drinking substantially (data not shown).
An analysis of never users of tobacco stratifi ed by cancer subsite revealed a dose – response relationship, with monotonic increasing risks for the frequency of alcohol consumption on the risks of pha-ryngeal and lapha-ryngeal cancers ( Table 6 ). For phapha-ryngeal cancer, increased risks were observed for subjects who drank one to two drinks per day (OR = 1.66, 95% CI = 1.18 to 2.34), whereas for laryngeal cancer, an increased risk was observed for drinking fi ve or more drinks per day (OR = 2.98, 95% CI = 1.72 to 5.17). Monotonic increasing risks were not observed for the duration of alcohol consumption, even though the P trend was statistically
sig-nifi cant for all cancer subsites. Differences in risk associated with alcohol consumption were not observed when the analyses of never users of tobacco were further stratifi ed by age, sex, race/e thnicity, education level, study region, or source of control subjects. Attributable Fractions
Approximately 24% (95% CI = 16% to 31%) of the cases of head and neck cancer among the never drinkers were attributable to ever cigarette smoking, assuming a causal relationship. Among the never users of tobacco, 7% (95% CI = − 4% to 16%) of the cases of head and neck cancer were attributable to alcohol drinking, assuming a causal relationship.
Discussion
The results of this pooled analysis confirm previous findings that cigarette smoking is a strong risk factor for head and neck cancer independent of alcohol drinking. Seven of the 15 studies we included showed a statistically significant association between ever having smoked cigarettes and the risk of head and neck cancer in never drinkers, including dose – response relationships for smoking frequency and duration. Based on an earlier review of epidemio-logic studies reviewed in the IARC monograph (21), the magnitude of average relative risks for tobacco smoking were 4.0 – 5.0 for oral cavity cancers, 4.0 – 5.0 for oro- and hypopharyngeal cancers, and Table 3 . Cigarette smoking among never drinkers and the risk of
head and neck cancer *
Never drinkers Smoking variable Case subjects Control subjects OR † (95% CI) Cigarette smoking Never 854 2577 1.00 (referent) Ever 720 1425 2.13 (1.52 to 2.98) Missing 24 49 P for heterogeneity ‡ <.001 Frequency, cigarettes/day
Never smokers 854 2577 1.00 (referent)
1 – 10 202 481 1.82 (1.28 to 2.59) 11 – 20 281 601 2.36 (1.60 to 3.47) 21 – 30 119 154 3.58 (2.09 to 6.16) 31 – 40 72 102 4.46 (2.54 to 7.83) >40 37 60 2.69 (1.21 to 5.98) Missing 33 76 P trend <.001 P for heterogeneity ‡ <.001 Duration, y
Never smokers 854 2577 1.00 (referent)
1 – 10 63 200 1.45 (1.04 to 2.03) 11 – 20 59 269 1.10 (0.75 to 1.61) 21 – 30 133 362 1.79 (1.20 to 2.67) 31 – 40 202 324 3.61 (2.26 to 5.75) >40 255 249 4.83 (3.18 to 7.33) Missing 32 70 P trend <.001 P for heterogeneity ‡ <.001 Cumulative smoking, py
Never smokers 854 2577 1.00 (referent)
1 – 10 139 407 1.58 (1.13 to 2.22) 11 – 20 108 291 1.85 (1.08 to 3.16) 21 – 30 109 219 2.75 (1.71 to 4.43) 31 – 40 91 152 4.06 (2.33 to 7.09) 41 – 50 70 101 3.46 (1.97 to 6.09) >50 193 219 5.40 (3.06 to 9.53) Missing 34 85 P trend <.001 P for heterogeneity ‡ <.001
* OR = odds ratio; CI = confidence interval; py = pack-years; dy = drink-years. † Random-effects model used. Study-specific odds ratios were adjusted for
age, sex, race/ethnicity, education level, study center, years of cigar smoking (continuous), and years of pipe smoking (continuous).
Fig. 1 . The risk of head and neck cancer as -sociated with cigarette smoking in never drinkers of alcohol ( left ) and with alcohol drinking in never users of tobacco ( right ), overall and by study, using International Head and Neck Cancer Epidemiology con-sortium pooled data version 1.0. Odds ratios (ORs) for ever versus never cigarette smok-ing in never drinkers were adjusted for age, sex, race/ethnicity, education level, study center, years of cigar smoking, and years of pipe smoking. Odds ratios for drinking three or more alcoholic drinks per day versus never drinking in never users of tobacco were adjusted for age, sex, race/ethnicity, education level, and study center. Study-specifi c estimates for the Paris, France, study were not available because none of the sub-jects were never users of tobacco and, among the never drinkers, none of the con-trol subjects were never cigarette smokers. Squares = study-specifi c odds ratios; size of the square = the weight given to this study (inverse of the variance of the log odds ratio)
when estimating the summary odds ratio; horizontal lines = study-specifi c confi dence intervals (CIs); diamond = summary estimate combining the study-specifi c estimates with a random-effects model; solid vertical line = odds ratio of 1; dashed vertical line = summary odds ratio.
Table 4 . Cigarette smoking and the risk of head and neck cancer by subsite among never drinkers *
Oral cavity † (717 case subjects/4051 control subjects) Oropharynx/ hypopharynx † , ‡ (380 case subjects/3989 control subjects) Oral cavity/pharynx NOS § (174 case subjects/
3554 control subjects) Larynx † , || (286 case subjects/3045 control subjects) Variable No. of case subjects/ No. of control subjects OR (95% CI) No. of case subjects/ No. of control subjects OR (95% CI) No. of case subjects/ No. of control subjects OR (95% CI) No. of case subjects/ No. of control subjects OR (95% CI) Cigarette smoking
Never 505/2577 1.00 (referent) 168/2530 1.00 (referent) 115/2268 1.00 (referent) 41/1822 1.00 (referent) Ever 206/1425 1.35 (0.90 to 2.01) 206/1411 2.02 (1.34 to 3.05) 57/1240 1.07 (0.50 to 2.28) 235/1175 6.84 (4.25 to 11.01)
Missing 6/49 6/48 2/46 10/48
P for heterogeneity ¶ .019 <.001 .012 <.001
Frequency, cigarettes/day
Never smokers 505/2577 1.00 (referent) 1.00 (referent) 115/2268 1.00 (referent) 41/1822 1.00 (referent) 1 – 10 67/481 1.38 (0.80 to 2.38) 168/2530 2.55 (1.59 to 4.10) 21/424 1.55 (0.86 to 2.79) 42/365 5.72 (3.41 to 9.60) 11 – 20 82/601 1.43 (0.85 to 2.38) 67/473 2.15 (1.38 to 3.34) 17/500 1.08 (0.39 to 2.99) 101/530 8.36 (5.18 to 13.51) 21 – 30 31/154 1.61 (0.31 to 8.47) 75/596 3.86 (1.80 to 8.25) 11/148 2.68 (1.25 to 5.78) 44/116 14.38 (8.47 to 24.43) 31 – 40 15/102 2.92 (0.91 to 9.44) 31/154 4.82 (2.42 to 9.60) 4/94 5.46 (0.92 to 33.47) 32/91 18.38 (7.14 to 47.31) >40 6/60 1.40 (0.30 to 6.61) 18/101 3.10 (1.43 to 6.69) 4/59 6.00 (1.48 to 24.29) 14/47 11.02 (4.92 to 24.72) Missing 11/76 13/60 2/61 12/74 P trend .044 8/75 <.001 .001 <.001 P for heterogeneity ¶ .051 <.001 .003 <.001 Duration, y
Never smokers 505/2577 1.00 (referent) 168/2530 1.00 (referent) 115/2268 1.00 (referent) 41/1822 1.00 (referent) 1 – 10 27/200 1.37 (0.84 to 2.23) 19/199 1.69 (1.00 to 2.88) 5/192 1.71 (0.62 to 4.74) 8/171 4.33 (1.13 to 16.62) 11 – 20 22/269 1.16 (0.64 to 2.10) 17/267 1.18 (0.61 to 2.28) 7/228 2.35 (0.69 to 7.96) 12/233 3.48 (1.61 to 7.50) 21 – 30 45/362 1.32 (0.92 to 1.91) 32/357 1.47 (0.94 to 2.31) 12/295 2.14 (0.94 to 4.86) 42/298 5.75 (2.94 to 11.23) 31 – 40 46/324 2.28 (1.19 to 4.37) 65/320 3.74 (2.61 to 5.38) 13/278 2.07 (0.88 to 4.84) 73/271 9.30 (5.40 to 16.02) >40 62/249 3.23 (1.54 to 6.77) 71/247 4.84 (2.22 to 10.54) 20/226 2.56 (1.29 to 5.07) 98/182 16.32 (9.58 to 27.79) Missing 10/70 8/69 2/67 12/68 P trend .001 <.001 <.001 <.001 P for heterogeneity ¶ .023 <.001 .030 <.001
* Random-effects model used for all odds ratios. NOS = not otherwise specified; OR = odds ratio; CI = confidence interval.
† Adjusted for age, sex, race/ethnicity, education level, study center, years of cigar smoking (continuous), and years of pipe smoking (continuous). ‡ Does not include the Central Europe study.
§ Does not include the Switzerland and Central Europe studies.
|| Does not include the International Multicenter, Seattle, and Puerto Rico studies. ¶ Two-sided test for heterogeneity.
10.0 for laryngeal cancers (21,37). We did not expect our estimates among never drinkers to be the same as the estimates by Vineis et al. (37), whose analyses were not restricted to never drinkers. Of interest, however, is our finding that the risk was stronger for laryn-geal cancer than for oral cavity and pharynlaryn-geal cancers, which is consistent with the Vineis estimates. For example, in the review by Vineis et al. (37), the average relative risk of laryngeal cancer was 10-fold higher for ever cigarette users versus never users across 25 case – control studies and five cohort studies, which was similar to the sevenfold increase in risk we observed among never drinkers in our pooled analysis of 15 case – control studies. We estimated increased risks of 1.4-fold for oral cavity cancers and twofold for oro- and pharyngeal cancers, for ever versus never smokers among never drinkers of alcohol. The difference in risk by subsite observed in our study was independent of associations with the use of cigars,
pipes, chewing tobacco, or snuff; exclusion of subjects who had these other tobacco habits from the analysis did not change the dif-ferences observed in risk by subsite. These results suggest that the larynx is the organ within the head and neck that is most susceptible to the effects of cigarette smoking. However, the mechanism for this increased susceptibility is unclear.
We also detected heterogeneity by geographic region for the association between cigarette smoking and the risk of head and neck cancer in never drinkers: a higher risk was observed for studies in Europe and South America than for studies in North America. This difference may refl ect the fact that cigarettes from different coun-tries and regions differ with respect to their content of nitrosamines, polycyclic aromatic hydrocarbons, and other tobacco carcinogens (38). The content of these compounds in cigarettes is also known to change over time (38). Patterns of smoking, such as the depth of inhalation, were not captured in most of the included studies and may also have varied across and between regions. In addition, socio-logic differences among societies may have led to different smoking and drinking practices; for example, because there were fewer smokers who were also never drinkers in the United States than in other countries, the precision of our estimates was decreased for some studies. Additional sources of heterogeneity for the associa-tion with cigarette smoking in never drinkers may include the dif-ferences across study centers in terms of the relative proportions of case subjects with cancers at different anatomic subsites.
Our results suggest that, in the absence of tobacco use, the association between alcohol consumption and the risk of head and neck cancer is weak and is apparent only at high doses and only for pharyngeal and laryngeal cancers. Dose – response trends for both the frequency and duration of alcohol drinking were strongest for cancers of the pharynx, which suggests that it is the organ within the head and neck that is most sensitive to the carcinogenicity of alcoholic beverages. The fi nding of an increased cancer risk only at high levels of alcohol intake in never smokers is consistent with results from two studies that were not included in this pooled dataset, one on oral cavity cancer in the United States (26) and the other on head and neck cancers in Brazil (28). There are several possible mechanisms for how alcoholic beverages might exert a carcinogenic effect in the head and neck, including ethanol acting as a solvent for carcinogens, ethanol or its metabolite acetaldehyde damaging DNA, and constituents other than ethanol in alcoholic beverages acting as carcinogens.
Our study has several limitations. First, we applied a global value for the percentage of ethanol found in each alcoholic bever-age type (wine, beer, hard liquors). Although the ethanol content of wine and beer is likely to be relatively consistent across coun-tries and regions in the world (33), there is considerable potential for variation in ethanol content among hard liquors that we did not take into account in this study. Case subjects were more likely than control subjects to drink hard liquors; thus, misclassifi cation of alcohol exposures may have been more severe for case subjects than for control subjects, which could have biased the results away from the null. However, this potential misclassifi cation would not affect our estimates for the duration of drinking or for ever drinking, for which we observed associations with the risk of pharyngeal cancer, because we did not apply a global value for the percentage of ethanol for these variables.
Table 5 . Alcohol drinkers among never users of tobacco and the risk of head and neck cancer *
Never users of tobacco
Drinking variable Case subjects Control subjects OR † (95% CI) Alcohol drinking Never 541 2482 1.00 (referent) Ever 523 3290 1.18 (0.93 to 1.50) Missing 8 3 P for heterogeneity ‡ <.001 Frequency, drinks/day
Never drinkers 541 2482 1.00 (referent)
<1 164 899 1.04 (0.79 to 1.38) 1 – 2 202 1324 1.30 (0.94 to 1.80) 3 – 4 59 536 1.82 (1.10 to 2.99) ≥ 5 65 389 2.81 (1.49 to 5.27) Missing 41 145 P trend .001 P for heterogeneity ‡ <.001 Duration, y
Never drinkers 541 2482 1.00 (referent)
1 – 10 59 211 1.56 (1.11 to 2.19) 11 – 20 70 447 1.22 (0.87 to 1.71) 21 – 30 121 774 1.27 (0.87 to 1.87) 31 – 40 138 919 1.17 (0.84 to 1.62) >40 years 106 813 1.05 (0.65 to 1.68) Missing 37 129 P trend .319 P for heterogeneity ‡ <.001 Cumulative drinking, dy
Never drinkers 541 2482 1.00 (referent)
1 – 10 147 747 1.07 (0.82 to 1.39) 11 – 20 64 339 1.31 (0.86 to 1.98) 21 – 30 42 260 1.33 (0.73 to 2.42) 31 – 40 33 219 1.31 (0.86 to 2.01) 41 – 50 23 190 1.15 (0.70 to 1.90) >50 179 1391 1.87 (1.27 to 2.75) Missing 43 147 P trend .003 P for heterogeneity ‡ <.001
* OR = odds ratio; CI = confidence interval; py = pack-years; dy = drink-years. † Random-effects model used. Study-specific odds ratios were adjusted for
age, sex, race/ethnicity, education level, and study center. ‡ Two-sided test for heterogeneity among studies.
Second, some individuals who had minimal levels of tobacco or alcohol use might have been included in the “never user of tobacco” and “never drinker” categories in the analysis because of the wording on the questionnaires used to establish the “unex-posed” groups in some of the studies. The studies with the highest thresholds for classifying an individual as unexposed were the North Carolina study (in which a never drinker was defi ned as an individual who consumed three or fewer drinks per month), the Iowa study (in which a never cigarette smoker was defi ned as an individual who smoked less than one-half pack of cigarettes per week for <1 year), and the Tampa or Houston studies (in which a never drinker was defi ned as an individual who consumed alcohol one or more times per week for one or more years), and the International Multicenter study (in which never use of cigars, pipes, chewing tobacco, or snuff was defi ned as smoking cigars or pipes, chewing, or snuffi ng less than daily for <1 year). However, the odds ratios for these studies with the highest thresholds were not substantially higher than would be expected if inclusion of these minimal users had an impact on the associations.
Third, although we excluded the possibility of residual con-founding by tobacco in the assessment of alcohol drinking and by alcohol in the assessment of cigarette smoking, we did not adjust for other potential confounders that are associated with the risk of the head and neck cancer, such as human papillomavirus (HPV) infection (19) and diet and nutrition (39,40). However, a recent analysis (41) of data from the International Multicenter study (which were included in this pooled analysis) did not show an inverse association between fruit and vegetable intake and the risks of oral cavity or oropharyngeal cancers among never users of tobacco or never drinkers of alcohol, which suggests that our results are unlikely to be due to confounding by fruit and vegetable intakes. Although HPV infection appears to be an important risk factor for oral cavity and oropharyngeal cancers for never users of tobacco (19), no association between cigarette smoking and HPV infection in the general population or source population of never users of tobacco has been established (42,43). In addition, accord-ing to several survey studies (44,45), it seems unlikely that alcohol drinking is associated with HPV infection in either the general Table 6 . Alcohol drinking and the risk of head and neck cancer by subsite among never users of tobacco *
Oral cavity † (383 case subjects/5775 control subjects) Oropharynx/ hypopharynx ‡ (369 case subjects/5775 control subjects) Oral cavity/pharynx NOS † , § (155 case subjects/4983 control subjects) Larynx † , || (121 case subjects/4602 control subjects) Variable No. of case subjects/ No. of control subjects OR (95% CI) No. of case subjects/ No. of control subjects OR (95% CI) No. of case subjects/ No. of control subjects OR (95% CI) No. of case subjects/ No. of control subjects OR (95% CI) Alcohol consumption
Never 243/2482 1.00 (referent) 153/2482 1.00 (referent) 80/1982 1.00 (referent) 40/1788 1.00 (referent) Ever 137/3290 1.17 (0.92 to 1.48) 216/3290 1.38 (0.99 to 1.94) 72/2998 1.09 (0.77 to 1.54) 79/2812 1.21 (0.82 to 1.79)
Missing 3/3 0/3 3/3 2/2
P for heterogeneity ¶ .087 <.001 .141 .193
Frequency, drinks/day
Never drinker 243/2482 1.00 (referent) 153/2482 1.00 (referent) 80/1982 1.00 (referent) 40/1788 1.00 (referent) <1 44/899 1.14 (0.8 to 1.63) 73/899 1.39 (0.99 to 1.96) 25/834 1.08 (0.67 to 1.75) 15/724 0.92 (0.5 to 1.69) 1 – 2 60/1324 1.64 (1.19 to 2.25) 83/1324 1.66 (1.18 to 2.34) 26/1171 1.24 (0.77 to 1.99) 28/1155 1.26 (0.77 to 2.07) 3 – 4 10/536 1.11 (0.57 to 2.15) 24/536 2.33 (1.37 to 3.98) 13/495 2.32 (1.24 to 4.34) 11/480 1.24 (0.62 to 2.45) ≥ 5 8/389 1.23 (0.59 to 2.57) 29/389 5.50 (2.26 to 13.36) 4/382 0.77 (0.27 to 2.18) 22/349 2.98 (1.72 to 5.17) Missing 18/145 7/145 7/119 5/106 P trend .032 <.001 .891 <.001 P for heterogeneity ¶ .913 <.001 .202 .006 Duration, y
Never drinker 243/2482 1.00 (referent) 153/2482 1.00 (referent) 80/1982 1.00 (referent) 40/1788 1.00 (referent) 1 – 10 21/211 2.36 (1.43 to 3.88) 18/211 1.76 (0.99 to 3.14) 13/181 2.59 (1.38 to 4.86) 7/185 2.61 (1.14 to 5.98) 11 – 20 17/447 1.09 (0.65 to 1.85) 28/447 1.34 (0.81 to 2.11) 11/394 1.09 (0.56 to 2.11) 9/375 1.63 (0.78 to 3.43) 21 – 30 19/774 0.81 (0.49 to 1.33) 63/774 1.95 (1.37 to 2.77) 18/697 1.26 (0.73 to 2.17) 18/673 1.40 (0.79 to 2.48) 31 – 40 35/919 1.29 (0.88 to 1.9) 61/919 1.44 (0.78 to 2.66) 14/853 0.86 (0.47 to 1.57) 21/797 1.10 (0.64 to 1.89) >40 32/813 1.15 (0.77 to 1.73) 37/813 1.51 (0.68 to 3.37) 13/773 0.92 (0.49 to 1.71) 21/677 1.00 (0.58 to 1.73) Missing 16/129 9/129 6/103 5/107 P trend <.001 .003 .014 <.001 P for heterogeneity ¶ .419 <.001 .585 .350
* NOS = not otherwise specified; OR = odds ratio; CI = confidence interval.
† Fixed-effects model, adjusted for age, sex, race/ethnicity, education level, and study center.
‡ Random-effects model. Study-specific odds ratios adjusted for age, sex, race/ethnicity, and education level. § Does not include the Switzerland and Texas studies.
|| Does not include the International Multicenter, Seattle, and Puerto Rico studies. ¶ Two-sided test for heterogeneity.