associated with hepatocellular carcinoma. World J Gastroenterol 2004; 10(11): 1555–1559.
12. Liu JJ, Zhang J, Zhou RL et al. Partial cloning of LHS cDNA and effect of its expression on behavior of hepatocellular carcinoma cells. J Beijing Med Univ 2000; 32: 526–529.
13. Liu XR, Zhou RL, Zhang QY et al. Identification and characterization of LAPTM4B encoded by a human hepatocellular carcinoma-associated novel gene. Beijing Da Xue Xue Bao 2003; 35: 340–347.
14. He J, Shao GZ, Zhou RL. Effects of the novel gene, LAPTM4B highly expression in hepatocellular carcinoma on cell proliferation and tumourigenesis of NIH3T3. Beijing Da Xue Xue Bao 2003; 35: 348–352.
15. Peng C, Zhou RL, Shao GZ et al. Expression of lysosome-associated protein transmembrane 4B-35 in cancer and its correlation with the differentiation status of hepatocellular carcinoma. World J Gastroenterol 2005; 11: 2704–2708. 16. Yang H, Xiong FX, Lin M et al. LAPTM4B-35 overexpression is a risk factor for
tumor recurrence and poor prognosis in hepatocellular carcinoma. J Cancer Res Clin Oncol 2010; 136(2): 275–281.
17. Yang Y, Yang H, Xiong F et al. LAPTM4B overexpression is an independent prognostic marker in ovarian carcinoma. Oncol Rep 2008; 20(5): 1077–1083. 18. Zhou L, He XD, Cui QC et al. Expression of LAPTM4B-35: a novel marker of
progression, invasiveness and poor prognosis of extrahepatic cholangiocarcinoma. Cancer Lett 2008; 264: 209–217.
19. Meng FL, Yin MZ, Song HT. LAPTM4B-35 overexpression is an independent prognostic marker in endometrial carcinoma. Int J Gynecol Cancer 2010; 20: 745–750.
20. Yang H, Xiong F, Wei X et al. Overexpression of LAPTM4B-35 promotes growth and metastasis of hepatocellular carcinoma in vitro and in vivo. Cancer Lett 2010; 294: 236–244.
21. Yin M, Xu Y, Lou G et al. LAPTM4B overexpression is a novel predictor of epithelial ovarian carcinoma metastasis. Int J Cancer 2010; 129: 629–635. 22. Deng LJ, Zhang QY, Liu B et al. Relationship between LAPTM4B gene polymorphism
and susceptibility of lung cancer. J Beijing Med Univ 2005; 37(3): 302–305. 23. Sun L, Zhang QY, Liu Y, Qian N. Relationship between LAPTM4B gene
polymorphism and susceptibility of lymphoma. Cancer Research on Prevention and Treatment 2007; 34(4): 245–248.
24. Cheng XJ, Xu W, Zhang QY, Zhou RL. Relationship between LAPTM4B gene polymorphism and susceptibility of colorectal and esophageal cancers. Ann Oncol 2008; 19: 527–532.
25. Meng F, Song H, Luo C et al. Correlation of LAPTM4B polymorphisms with cervical carcinoma.. Cancer 2011; 117(12): 2652–2658.
26. Xiao Jing C, Qing Yun Z, Rou Li Z. Methylation of LAPTM4B promoter region influences its mRNA expression in esophageal cancer. Zhongguo Sheng Wu Hua Xue Yu Fen Zi Sheng Wu Xue Bao 2008; 24(1): 89–94.
27. Xu F, Paquette AJ, Anderson DJ et al. Identification of a cell type-specific silencer in thefirst exon of the His-1 gene. J Cell Biochem 2000; 76(4): 615–624. 28. Liu J, Zhou R, Zhang N et al. Biological function of a novel gene overexpressed
in human hepatocellular carcinoma. Chin Med J (Engl) 2000; 113: 881–885. 29. Luo R, Zhao Z, Gao Z, Yao J. Risk factors for primary liver carcinoma in Chinese
population. World J Gastroenterol 2005; 11: 4431–4434.
Annals of Oncology 23: 1869–1880, 2012 doi:10.1093/annonc/mdr548 Published online 28 November 2011
Nutrient-based dietary patterns and the risk of head
and neck cancer: a pooled analysis in the International
Head and Neck Cancer Epidemiology consortium
V. Edefonti
1*, M. Hashibe
2, F. Ambrogi
1, M. Parpinel
3, F. Bravi
1,4, R. Talamini
5, F. Levi
6, G. Yu
7,
H. Morgenstern
8,9, K. Kelsey
10, M. McClean
11, S. Schantz
7, Z. Zhang
12, S. Chuang
13,
P. Boffetta
14,15, C. La Vecchia
1,4& A. Decarli
1,161
Section of Medical Statistics and Biometry‘Giulio A. Maccacaro’, Department of Occupational and Environmental Health, University of Milan, Milan, Italy;2
University of Utah School of Medicine, Salt Lake City, USA;3
Unit of Hygiene and Epidemiology, Department of Medical and Biological Sciences, University of Udine, Udine;
4
Department of Epidemiology,“Mario Negri” Institute for Pharmacological Research, Milan;5
Unit of Epidemiology and Biostatistics, Centro di Riferimento Oncologico, Aviano, Italy;6
Cancer Epidemiology Unit, Institut Universitaire de Médecine Sociale et Préventive, Centre Hospitalier Universitaire Vaudois and University of Lausanne, Lausanne, Switzerland;7New York Eye and Ear Infirmary, New York; Departments of;8
Epidemiology;9
Environmental Health Sciences, University of Michigan School of Public Health and Comprehensive Cancer Center, University of Michigan, Ann Arbor;10
Brown University, Providence;11
Boston University School of Public Health, Boston;12
UCLA School of Public Health, Los Angeles, USA;13
Imperial College London, London, UK;14
The Tisch Cancer Institute and Institute for Translational Epidemiology, Mount Sinai School of Medicine, New York, USA;15
International Prevention Research Institute, Lyon, France;16
Unit of Medical Statistics, Biometry and Bioinformatics, Fondazione IRCSS Istituto Nazionale Tumori di Milano, Milan, Italy
Received 27 May 2011; accepted 12 October 2011
Background:The association between dietary patterns and head and neck cancer has rarely been addressed.
Patients and methods:We used individual-level pooled data fromfive case–control studies (2452 cases and 5013 controls) participating in the International Head and Neck Cancer Epidemiology consortium. A posteriori dietary patterns were identified through a principal component factor analysis carried out on 24 nutrients derived from
study-*Correspondence to: Dr V. Edefonti, Section of Medical Statistics and Biometry, `Giulio A. Maccacaro', Department of Occupational and Environmental Health, University of
Annals of Oncology
original articles
© The Author 2011. Published by Oxford University Press on behalf of the European Society for Medical Oncology. All rights reserved. For permissions, please email: [email protected]
specific food-frequency questionnaires. Odds ratios (ORs) and corresponding 95% confidence intervals (CIs) were estimated using unconditional logistic regression models on quintiles of factor scores.
Results:We identified three major dietary patterns named ‘animal products and cereals’, ‘antioxidant vitamins and fiber’, and ‘fats’. The ‘antioxidant vitamins and fiber’ pattern was inversely related to oral and pharyngeal cancer (OR = 0.57, 95% CI 0.43–0.76 for the highest versus the lowest score quintile). The ‘animal products and cereals’ pattern was positively associated with laryngeal cancer (OR = 1.54, 95% CI 1.12–2.11), whereas the ‘fats’ pattern was inversely associated with oral and pharyngeal cancer (OR = 0.78, 95% CI 0.63–0.97) and positively associated with laryngeal cancer (OR = 1.69, 95% CI 1.22–2.34).
Conclusions:Thesefindings suggest that diets rich in animal products, cereals, and fats are positively related to laryngeal cancer, and those rich in fruit and vegetables inversely related to oral and pharyngeal cancer.
Key words: diet, dietary patterns, factor analysis, head and neck cancer, INHANCE, nutrients
introduction
Tobacco smoking and alcohol drinking are the two major risk factors for cancers of the oral cavity, pharynx, and larynx [head and neck cancer (HNC)] [1,2], and together account for ∼65% to 90% of cases of both sexes diagnosed in Europe, North, and South America [3–5].
Among other factors, diet has been associated with HNC risk. Although the strength of the evidence concerning fruits and vegetables has recently been downgraded for most cancers and for overall cancer risk [6], high intakes of non-starchy vegetables, foods containing carotenoids, and fruits in general have been reported to be inversely associated with HNC risk [7–9], especially for heavy smokers and/or drinkers.
The assessment of dietary information has long been a source of both conceptual and methodological concerns, mainly because of interdependencies among foods and nutrients and corresponding multicollinearity problems in multiple regression models [10,11]. In the last 20 years, attempts have been made to take advantage of these issues to give a broader picture of food and nutrient consumption in epidemiological studies. Dietary pattern analysis has emerged as a complementary approach to individual nutrients/foods for examining the relation between diet and the risk of chronic diseases [12,13].
The International Head and Neck Cancer Epidemiology (INHANCE) consortium [14] was established in 2004 to contribute in elucidating the etiology of HNC by providing opportunities for pooled analyses of individual-level data on HNC on a large scale. The specific goals of this analysis were (i) to identify a posteriori dietary patterns representing the overall dietary habits of the population under examination through a tested and robust statistical approach, (ii) to investigate the association between these exposures and the risks of two HNC outcomes—oral and pharyngeal cancer and laryngeal cancer, (iii) to explore whether effect estimates differ by cancer subsites or in subgroups of subjects.
materials and methods
design and participants
Within the version 1.2 of the INHANCE consortium pooled dataset, seven studies [3,15–22] provided information on nutrient intakes at the individual level. Five of these studies [15–21] shared information on a minimal set of major micro- and macronutrients and were included in this analysis.
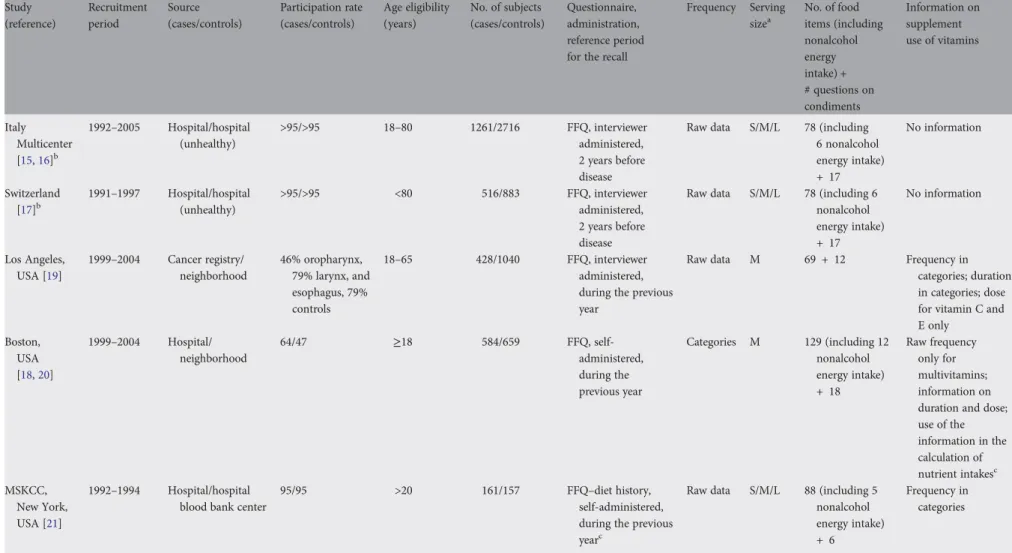
Characteristics of the individual case–control studies, including information on their food-frequency questionnaire (FFQ) [23–35], are presented in Table1and in supplementary material 1 (available at Annals
of Oncology online). Briefly, two of the selected studies were from Europe and three were from the United States. Three were hospital-based and two were population-based studies. The Italy Multicenter and Switzerland studies were based on the same FFQ. The total number of FFQ items varied from 81 to 147, but three questionnaires showed a comparable number of items. Wording of the questions differed across studies as well, but, overall, number and wording of FFQ items allow for the calculation of intakes of several nutrients. Three FFQs included a section on the use of vitamin supplements, but only for the Boston study, this information was reported to be used in the calculation of nutrient intakes. Appropriate food composition sources [26–30] were used in each study to calculate intakes of total energy and various nutrients from the FFQ items.
Written informed consent was obtained from study subjects, and the investigations were approved by the institutional review boards at each of the institutes involved.
selection of subjects
Cases were included if their tumor had been classified as an invasive tumor of oral cavity, oropharynx, hypopharynx, oral cavity or pharynx not otherwise specified, larynx, or HNC unspecified. Subjects with cancers of the salivary glands or of the nasal cavity/ear/paranasal sinuses were excluded [31].
Subjects with missing information on all the selected nutrients (492 subjects, from Los Angeles and Boston studies) were removed from the original data. Subjects having an implausible (<500 or >5500 kcal) nonalcohol energy intake (170 subjects) or those having missing values (257 subjects) on nonalcohol energy intake were excluded from the analysis. Cases with missing information on the site of origin of their cancer (22 subjects, mostly from the Memorial Sloan– Kettering Cancer Center study) were also removed.
Thus, the present analyses included a total of 7465 subjects, with 2452 HNC cases and 5013 controls. There were a total of 478 oral cavity cancer cases, 770 oropharyngeal and 281 hypopharyngeal cancer cases (1051 pharyngeal cancer cases), 206 unspecified oral cavity/pharynx cases (giving a total of 1735 oral and pharyngeal cancer cases), and 717 laryngeal cancer cases.
selection of variables
We selected 24 major macro- and micronutrients (see Table3) to provide a comprehensive representation of the dietary habits of a general Western population and to assess their potential joint role in HNC risk.
original articles
Annals of OncologyTable 1. Characteristics of individual studies in the International Head and Neck Cancer Epidemiology (INHANCE) consortium pooled data including information on dietary questionnaires Study (reference) Recruitment period Source (cases/controls) Participation rate (cases/controls) Age eligibility (years) No. of subjects (cases/controls) Questionnaire, administration, reference period for the recall
Frequency Serving sizea No. of food items (including nonalcohol energy intake) + # questions on condiments Information on supplement use of vitamins Italy Multicenter [15,16]b 1992–2005 Hospital/hospital (unhealthy) >95/>95 18–80 1261/2716 FFQ, interviewer administered, 2 years before disease
Raw data S/M/L 78 (including
6 nonalcohol energy intake) + 17 No information Switzerland [17]b 1991–1997 Hospital/hospital (unhealthy) >95/>95 <80 516/883 FFQ, interviewer administered, 2 years before disease
Raw data S/M/L 78 (including 6
nonalcohol energy intake) + 17 No information Los Angeles, USA [19] 1999–2004 Cancer registry/ neighborhood 46% oropharynx, 79% larynx, and esophagus, 79% controls 18–65 428/1040 FFQ, interviewer administered, during the previous year
Raw data M 69 + 12 Frequency in
categories; duration in categories; dose for vitamin C and E only Boston, USA [18,20] 1999–2004 Hospital/ neighborhood 64/47 ≥18 584/659 FFQ, self-administered, during the previous year Categories M 129 (including 12 nonalcohol energy intake) + 18 Raw frequency only for multivitamins; information on duration and dose; use of the information in the calculation of nutrient intakesc MSKCC, New York, USA [21] 1992–1994 Hospital/hospital blood bank center
95/95 >20 161/157 FFQ–diet history,
self-administered, during the previous yearc
Raw data S/M/L 88 (including 5
nonalcohol energy intake) + 6
Frequency in categories
aA quantification of the medium serving size was provided in all the studies. b
Italy Multicenter and Switzerland studies were based on the same FFQ.
cBoston’s FFQ assessed the use of multivitamins and specific vitamins in different ways.
FFQ, food-frequency questionnaire; L, large; M, medium; MSKCC, Memorial Sloan–Kettering Cancer Center; S, small.
Annals of Oncology
original
articles
V olume 23 | No. 7 | July 2012 doi:10.1093/annonc/mdr548 |We carried out preliminary checks on nutrient definitions, reference periods of intake and measurement units across studies, and increased comparability when possible (supplementary material1, available at Annals of Oncology online). As the Boston study only computed and provided nutrient intakes by both including and excluding the
contribution of supplements and fortified foods, we carried out the analyses based on nutrient intakes calculated excluding supplements or fortified foods for the Boston study. All the nutrient intakes were expressed on a daily base.
To assess the effective comparability of daily nutrient intakes across studies, we checked nutrient-specific kernel density estimation plots [32] representing the study-specific empirical distributions of each nutrient. As nutrient-specific densities were systematically different across studies, we decided to standardize nutrients within the single studies.
statistical analysis
factorability of the within-study standardized matrix We evaluated the correlation matrix of the within-study standardized data to determine whether it was factorable [33] (supplementary material 2, available at Annals of Oncology online). Given the reassuring results obtained, we carried out a factor analysis to identify a posteriori dietary patterns for the overall set of HNC cases and controls.
identi
fication of dietary patterns
Exploratory principal component factor analysis (PCFA) [34] was carried out on the correlation matrix of the within-study standardized data to describe the variance–covariance structure among the selected nutrients in terms of a few underlying unobservable and randomly varying factors that are known as dietary patterns. We chose the number of factors to retain based on the following criteria: factor eigenvalue >1, scree plot construction, and factor interpretability [34]. We applied a varimax rotation to the factor loading matrix to achieve a better-defined loading structure. Nutrients having rotated factor loading≥0.60 in absolute value on a given factor were used to name the factors and are indicated as‘dominant nutrients’ hereafter [35]. We calculated factor scores following the weighted least squares method. They indicate the degree to which each subject’s diet conforms to one of the identified patterns. Extra details on methods for assessing robustness [36], reliability [37], and internal reproducibility of the identified dietary patterns were provided in supplementary material 2 (available at Annals of Oncology online).
effect estimates
For each factor, participants were grouped intofive categories according to quintiles of factor scores among the controls.
We estimated the odds ratios (ORs) and the corresponding 95% confidence intervals (CIs) of oral cancer (including oral, oropharynx, hypopharynx, unspecified oral and pharyngeal cancer) and laryngeal cancer, separately, for each quintile category using unconditional multiple logistic regression models [38]. Wefitted both separate models for each factor
and a composite model including all factors simultaneously, together with relevant matching factors and other potential confounders. Tests for linear trend were also computed for all models.
We tested for the presence of heterogeneity between studies for the effect of quintile categories of dietary patterns by calculating likelihood ratio tests comparing composite models including versus excluding the interaction terms between each dietary pattern and study. When the P value for heterogeneity among studies was <0.01, we also used a mixed-effects modeling approach [39,40] and provided the corresponding mixed-effects ORs and CIs. We derived those estimates specifying generalized linear mixed models (GLMMs) with logit link function and binomial family that add to the
correspondingfixed-effects models twelve random-effects terms (one for each dietary pattern and quintile category included, except for the reference one). We carried out model selection on the described mixed-effects models using a backward approach (supplementary material 2, available at Annals of Oncology online).
For oral and pharyngeal cancer, separate analyses were conducted by anatomical subsite (categories shown in Table5) using a polytomous logistic regression model [38]. For both cancers, stratified analyses were conducted by age, sex, education, geographic region, body mass index at time of interview, tobacco smoking, and alcohol drinking. Details are given in supplementary material2 (available at Annals of Oncology online).
All statistical tests were two-sided. Calculations were carried out using SAS software (version 9; SAS Institute Inc., Cary, NC) and the open-source statistical computing environment R [41,42], with its libraries‘corpcor’ [43],‘psych’ [36],‘lme4’ [44],‘nnet’ [45], and‘ltm’ [46].
results
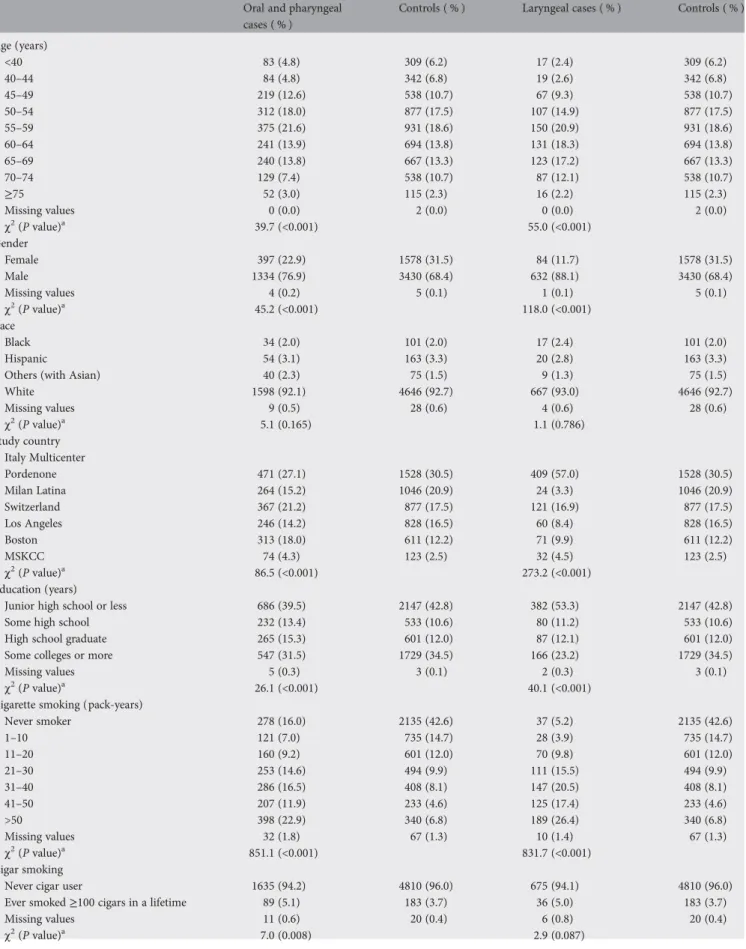
Selected characteristics of cases and controls are shown in Table2, separately for oral and pharyngeal and for laryngeal cancer cases. A brief comment is provided in supplementary material3 (available at Annals of Oncology online).
Correlations among individual nutrients were strong enough to suggest that the correlation matrix was factorable: the Kaiser–Meyer–Olkin statistic was equal to 0.90, and the individual measures of sampling adequacy were >0.70 for all the nutrients (supplementary material3, available at Annals of Oncology online).
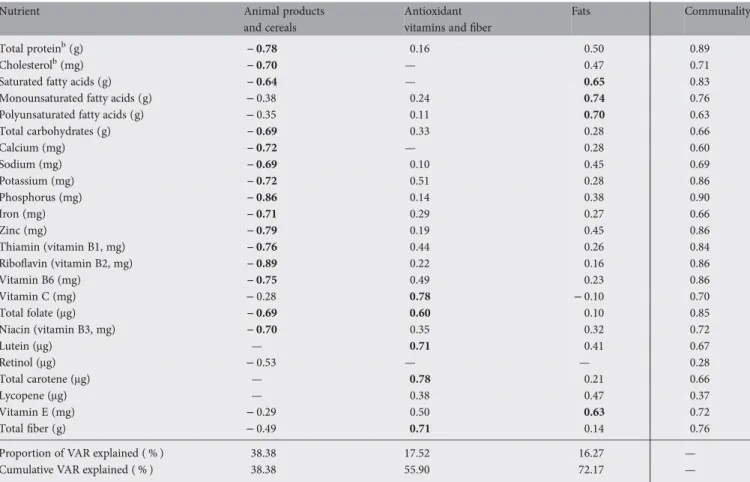
Table3presents the factor loading matrix for the three retained factors. These factors explained 72 % of the total variance in the original dataset. The rotation had the effect of making loadings generally negative for thefirst factor and positive for the remaining two, in such a way that only the magnitude (≥|0.60|) of each loading (and not its sign) was used to name the factors. Thefirst factor, named ‘animal products and cereals’, had the greatest loadings on riboflavin, phosphorus, zinc, total protein, thiamin, vitamin B6, calcium, potassium, iron, cholesterol, niacin, total carbohydrates, sodium, total folate, and saturated fatty acids. The second factor, named‘antioxidant vitamins and fiber’, had the greatest loadings on vitamin C and total carotene, lutein, totalfiber,
original articles
Annals of OncologyTable 2. Distribution of cases of oral and pharyngeal and laryngeal cancers and controls according to selected variables Oral and pharyngeal
cases ( % )
Controls ( % ) Laryngeal cases ( % ) Controls ( % )
Age (years) <40 83 (4.8) 309 (6.2) 17 (2.4) 309 (6.2) 40–44 84 (4.8) 342 (6.8) 19 (2.6) 342 (6.8) 45–49 219 (12.6) 538 (10.7) 67 (9.3) 538 (10.7) 50–54 312 (18.0) 877 (17.5) 107 (14.9) 877 (17.5) 55–59 375 (21.6) 931 (18.6) 150 (20.9) 931 (18.6) 60–64 241 (13.9) 694 (13.8) 131 (18.3) 694 (13.8) 65–69 240 (13.8) 667 (13.3) 123 (17.2) 667 (13.3) 70–74 129 (7.4) 538 (10.7) 87 (12.1) 538 (10.7) ≥75 52 (3.0) 115 (2.3) 16 (2.2) 115 (2.3) Missing values 0 (0.0) 2 (0.0) 0 (0.0) 2 (0.0) χ2 (P value)a 39.7 (<0.001) 55.0 (<0.001) Gender Female 397 (22.9) 1578 (31.5) 84 (11.7) 1578 (31.5) Male 1334 (76.9) 3430 (68.4) 632 (88.1) 3430 (68.4) Missing values 4 (0.2) 5 (0.1) 1 (0.1) 5 (0.1) χ2(P value)a 45.2 (<0.001) 118.0 (<0.001) Race Black 34 (2.0) 101 (2.0) 17 (2.4) 101 (2.0) Hispanic 54 (3.1) 163 (3.3) 20 (2.8) 163 (3.3)
Others (with Asian) 40 (2.3) 75 (1.5) 9 (1.3) 75 (1.5)
White 1598 (92.1) 4646 (92.7) 667 (93.0) 4646 (92.7) Missing values 9 (0.5) 28 (0.6) 4 (0.6) 28 (0.6) χ2 (P value)a 5.1 (0.165) 1.1 (0.786) Study country Italy Multicenter Pordenone 471 (27.1) 1528 (30.5) 409 (57.0) 1528 (30.5) Milan Latina 264 (15.2) 1046 (20.9) 24 (3.3) 1046 (20.9) Switzerland 367 (21.2) 877 (17.5) 121 (16.9) 877 (17.5) Los Angeles 246 (14.2) 828 (16.5) 60 (8.4) 828 (16.5) Boston 313 (18.0) 611 (12.2) 71 (9.9) 611 (12.2) MSKCC 74 (4.3) 123 (2.5) 32 (4.5) 123 (2.5) χ2(P value)a 86.5 (<0.001) 273.2 (<0.001) Education (years)
Junior high school or less 686 (39.5) 2147 (42.8) 382 (53.3) 2147 (42.8)
Some high school 232 (13.4) 533 (10.6) 80 (11.2) 533 (10.6)
High school graduate 265 (15.3) 601 (12.0) 87 (12.1) 601 (12.0)
Some colleges or more 547 (31.5) 1729 (34.5) 166 (23.2) 1729 (34.5)
Missing values 5 (0.3) 3 (0.1) 2 (0.3) 3 (0.1)
χ2
(P value)a 26.1 (<0.001) 40.1 (<0.001)
Cigarette smoking (pack-years)
Never smoker 278 (16.0) 2135 (42.6) 37 (5.2) 2135 (42.6) 1–10 121 (7.0) 735 (14.7) 28 (3.9) 735 (14.7) 11–20 160 (9.2) 601 (12.0) 70 (9.8) 601 (12.0) 21–30 253 (14.6) 494 (9.9) 111 (15.5) 494 (9.9) 31–40 286 (16.5) 408 (8.1) 147 (20.5) 408 (8.1) 41–50 207 (11.9) 233 (4.6) 125 (17.4) 233 (4.6) >50 398 (22.9) 340 (6.8) 189 (26.4) 340 (6.8) Missing values 32 (1.8) 67 (1.3) 10 (1.4) 67 (1.3) χ2 (P value)a 851.1 (<0.001) 831.7 (<0.001) Cigar smoking
Never cigar user 1635 (94.2) 4810 (96.0) 675 (94.1) 4810 (96.0)
Ever smoked≥100 cigars in a lifetime 89 (5.1) 183 (3.7) 36 (5.0) 183 (3.7)
Missing values 11 (0.6) 20 (0.4) 6 (0.8) 20 (0.4)
χ2(P value)a 7.0 (0.008) 2.9 (0.087)
Continued
Annals of Oncology
original articles
and total folate. The third factor, named‘fats’, had the greatest loadings on monounsaturated, polyunsaturated and saturated fatty acids, and vitamin E. Nutrient communalities were generally satisfactory, with portions of the nutrient variances contributed by the retained factors≥0.60, except for retinol and lycopene.
Standardized Cronbach’s coefficient alphas indicated that most of the nutrients are contributing to high reliability and further confirmed the choice of the selected nutrients. The internal reproducibility of the sets of patterns identified in the two split samples was also reassuring (supplementary material3, available at Annals of Oncology online).
Table4gives separate ORs and the corresponding CIs for oral and pharyngeal and laryngeal cancer by quintiles of factor scores for the retained dietary patterns. Results refer to the composite models including all the three factors
simultaneously, together with potential confounders. Mixed-effects estimates are provided together with the corresponding fixed-effects ones to account for the detected heterogeneity between studies. After model selection through backward elimination, the selected mixed-effects models included random-effects terms for the `antioxidant vitamins andfiber' pattern only, for both cancers. In mixed-effects models, the ‘animal products and cereals’ pattern was positively associated with laryngeal cancer (OR = 1.54, 95 % CI 1.12–2.11 for the highest versus the lowest score quintile), whereas no significant association emerged for oral and pharyngeal cancer (OR = 1.09, 95 % CI 0.89–1.34). High intakes of the dominant nutrients for antioxidant vitamins andfiber pattern were inversely related to oral and pharyngeal cancer risk (OR = 0.57, 95 % CI 0.43–0.76) and to laryngeal cancer risk, for which a significant protection emerged from the second quintile category onward, except for the last quintile category (OR = 0.66, 95 % CI 0.36–1.22). The ‘fats’ pattern was inversely associated with oral and pharyngeal cancer and positively associated with laryngeal cancer: the ORs were 0.78 (95 % CI 0.63–0.97) and 1.69 (95 % CI 1.22–2.34), respectively. Fixed-effects estimates and corresponding CIs were very similar to
the mixed-effects ones, with the main difference being the significant OR of 0.52 (95 % CI 0.38–0.70) for laryngeal cancer in the last quintile category of the‘antioxidant vitamins and fiber’ pattern. Consistent results were observed for the three models including each factor separately, for both cancers.
Table5shows the ORs of oral and pharyngeal cancer for the identified dietary patterns in strata of anatomical subsite. As heterogeneity between studies was not appreciable, we present estimates from thefixed-effects polytomous logistic regression model. All identified dietary patterns were characterized by consistent associations across subsites, with the main result being the inverse association of the‘antioxidant vitamins and fiber’ pattern in all three subsites. The overall protection associated with the‘fats’ pattern emerged as being mainly accounted for by the unspecified oral/pharynx subsite.
Supplementary material3 (available at Annals of Oncology online) shows the ORs of oral and pharyngeal cancer, and of laryngeal cancer, respectively, for the identified dietary patterns in strata of selected variables. Briefly, for the ‘antioxidant vitamins andfiber’ pattern, heterogeneity between studies emerged for oral and pharyngeal cancer only for the age <55 stratum. In the association with laryngeal cancer, heterogeneity between studies emerged infive strata: the corresponding mixed-effects estimates were still similar to thefixed-effects ones, although some CIs were wider. Consistent inverse associations with the‘antioxidant vitamins and fiber’ pattern emerged for subjects living in Europe or for moderate drinkers, for both cancers.
discussion
The present analysis identified three major dietary patterns that explained >70 % of the total variance in the nutrient intakes of this population. They were named‘animal products and cereals’, ‘antioxidant vitamins and fiber’, and ‘fats’ and were associated with HNC in various degrees.
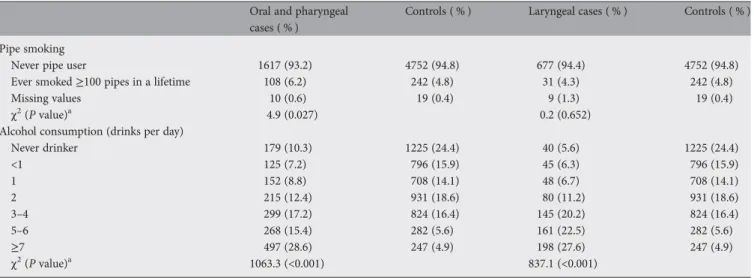
The major strength of our pooled analysis was assembly of a very large series of HNC patients and control subjects, which Table 2. Continued
Oral and pharyngeal cases ( % )
Controls ( % ) Laryngeal cases ( % ) Controls ( % )
Pipe smoking
Never pipe user 1617 (93.2) 4752 (94.8) 677 (94.4) 4752 (94.8)
Ever smoked≥100 pipes in a lifetime 108 (6.2) 242 (4.8) 31 (4.3) 242 (4.8)
Missing values 10 (0.6) 19 (0.4) 9 (1.3) 19 (0.4)
χ2(P value)a 4.9 (0.027) 0.2 (0.652)
Alcohol consumption (drinks per day)
Never drinker 179 (10.3) 1225 (24.4) 40 (5.6) 1225 (24.4) <1 125 (7.2) 796 (15.9) 45 (6.3) 796 (15.9) 1 152 (8.8) 708 (14.1) 48 (6.7) 708 (14.1) 2 215 (12.4) 931 (18.6) 80 (11.2) 931 (18.6) 3–4 299 (17.2) 824 (16.4) 145 (20.2) 824 (16.4) 5–6 268 (15.4) 282 (5.6) 161 (22.5) 282 (5.6) ≥7 497 (28.6) 247 (4.9) 198 (27.6) 247 (4.9) χ2 (P value)a 1063.3 (<0.001) 837.1 (<0.001)
Missing values were not considered in the calculation of theχ2test.
MSKCC, Memorial Sloan–Kettering Cancer Center.
original articles
Annals of Oncologyallowed us to identify common dietary patterns across populations, to examine HNC risks in detail, and to explore differences in risks by cancer subsite, geographic region, alcohol, and tobacco consumption.
However, pooled analyses on dietary data pose several challenges. Afirst issue involves the choice of the type of dietary data to work on. In general, the identification of a common list of dietary components is difficult as type, length of the questionnaires, and wording of the questions differ across questionnaires, and questionnaires include several country-specific dishes. Compared with food groups, nutrients offer the advantage to be directly involved in the biological processes and to be less country specific, although they are derived from the questionnaires through the extra step of country-specific food composition databases. From the statistical standpoint, they are more amenable to factor analysis as they are continuous variables. Food groups offer the important advantage of a more immediate interpretation of the results; however, they are country specific and not directly amenable to factor analysis as they end up in sums of numbers of portions consumed and then they are discrete variables. Keeping in mind these difficulties, we decided to carry out a factor analysis based on nutrient intakes.
A second issue is the comparability of nutrient intakes across studies. In our scenario, the analysis included only case–control studies, the selected studies were all based on FFQs, the FFQs showed a sufficient level of detail, and we checked for consistency of nutrient definitions and measurement units. However, differences existed in the wording and design of the questions and in the food composition databases used to derive nutrient intakes. These differences may have created discrepancies in the study-specific empirical distributions of individual nutrients. To assess the burden of the problem, we carried out kernel density estimation plots comparing the study-specific empirical distributions of each nutrient. We detected systematic discrepancies in the nutrient empirical distributions across studies in both location and scale dimensions. To partially overcome the problem, we standardized single nutrients within each study before carrying out factor analysis, and we reduced the original discrepancies.
A third issue involves the number of nutrients selected for factor analysis. Factor analysis requires that a shared set of nutrients is identified across all the selected studies. Studies with poorer information on nutrient intakes determined the Table 3. Factor loading matrixa, communalities, and explained variances (VAR) for the three major dietary patterns identified by factor analysis
Nutrient Animal products
and cereals
Antioxidant vitamins andfiber
Fats Communality
Total proteinb(g) − 0.78 0.16 0.50 0.89
Cholesterolb(mg) − 0.70 — 0.47 0.71
Saturated fatty acids (g) − 0.64 — 0.65 0.83
Monounsaturated fatty acids (g) − 0.38 0.24 0.74 0.76
Polyunsaturated fatty acids (g) − 0.35 0.11 0.70 0.63
Total carbohydrates (g) − 0.69 0.33 0.28 0.66 Calcium (mg) − 0.72 — 0.28 0.60 Sodium (mg) − 0.69 0.10 0.45 0.69 Potassium (mg) − 0.72 0.51 0.28 0.86 Phosphorus (mg) − 0.86 0.14 0.38 0.90 Iron (mg) − 0.71 0.29 0.27 0.66 Zinc (mg) − 0.79 0.19 0.45 0.86 Thiamin (vitamin B1, mg) − 0.76 0.44 0.26 0.84 Riboflavin (vitamin B2, mg) − 0.89 0.22 0.16 0.86 Vitamin B6 (mg) − 0.75 0.49 0.23 0.86 Vitamin C (mg) − 0.28 0.78 − 0.10 0.70 Total folate (μg) − 0.69 0.60 0.10 0.85 Niacin (vitamin B3, mg) − 0.70 0.35 0.32 0.72 Lutein (μg) — 0.71 0.41 0.67 Retinol (μg) − 0.53 — — 0.28 Total carotene (μg) — 0.78 0.21 0.66 Lycopene (μg) — 0.38 0.47 0.37 Vitamin E (mg) − 0.29 0.50 0.63 0.72 Totalfiber (g) − 0.49 0.71 0.14 0.76
Proportion of VAR explained ( % ) 38.38 17.52 16.27 —
Cumulative VAR explained ( % ) 38.38 55.90 72.17 —
a
Estimated from a principal component factor analysis carried out on 24 nutrients. The magnitude of each loading measures the importance of the corresponding nutrient to the factor.
b
Loadings≥0.60 in absolute value define the dominant nutrients for each factor and were shown in bold typeface; loadings <0.1 in absolute value were suppressed.
Annals of Oncology
original articles
Table 4. Odds ratios (ORs)afor oral cavity and pharyngeal cancer and laryngeal cancer and 95 % corresponding confidence intervals (CIs) on factor scores quintiles
Oral and pharyngeal cases Controls OR (95 % CI) P studiesb OR (95 % CI)c Laryngeal cases Controls OR (95 % CI) P studiesb OR (95 % CI)c
Fixed-effects model Mixed-effects model Fixed-effects model Mixed-effects model
Animal products and cereals
Quintile V 276 974 1d 0.366 1d 80 974 1d 0.008 1d Quintile IV 280 983 0.91 (0.74–1.13) 0.91 (0.74–1.13) 89 983 0.97 (0.68–1.39) 0.95 (0.66–1.36) Quintile III 291 979 0.85 (0.69–1.05) 0.85 (0.69–1.06) 118 979 1.08 (0.77–1.52) 1.08 (0.76–1.52) Quintile II 367 978 1.01 (0.82–1.24) 1.01 (0.82–1.24) 151 978 1.20 (0.86–1.67) 1.19 (0.85–1.66) Quintile I 459 983 1.09 (0.89–1.34) 1.09 (0.89–1.34) 253 983 1.57 (1.15–2.15) 1.54 (1.12–2.11) P for trende 0.221 0.227 <0.001 <0.001
Antioxidant vitamins andfiber
Quintile I 510 981 1d 0.003 1d 260 981 1d <0.001 1d Quintile II 370 976 0.84 (0.70–1.01) 0.84 (0.70–1.01) 121 976 0.58 (0.44–0.76) 0.58 (0.44–0.77) Quintile III 314 982 0.74 (0.61–0.90) 0.74 (0.61–0.90) 123 982 0.53 (0.40–0.70) 0.52 (0.39–0.69) Quintile IV 260 981 0.63 (0.51–0.77) 0.63 (0.51–0.78) 102 981 0.51 (0.38–0.69) 0.54 (0.35–0.85) Quintile V 219 977 0.56 (0.45–0.69) 0.57 (0.43–0.76) 85 977 0.52 (0.38–0.70) 0.66 (0.36–1.22) P for trende <0.001 0.005 <0.001 0.206 Fats Quintile I 303 981 1d 0.012 1d 81 981 1d <0.001 1d Quintile II 316 978 1.00 (0.81–1.24) 1.01 (0.81–1.24) 100 978 1.29 (0.90–1.86) 1.27 (0.89–1.83) Quintile III 351 986 1.07 (0.87–1.32) 1.07 (0.87–1.32) 128 986 1.74 (1.22–2.47) 1.72 (1.21–2.45) Quintile IV 356 971 0.94 (0.76–1.16) 0.94 (0.76–1.16) 172 971 1.84 (1.32–2.57) 1.82 (1.30–2.54) Quintile V 347 981 0.78 (0.63–0.96) 0.78 (0.63–0.97) 210 981 1.70 (1.23–2.36) 1.69 (1.22–2.34) P for trende 0.015 0.020 <0.001 <0.001
Estimated from multiple logistic regression models adjusted for age, sex, education, race/ethnicity, study center, pack-years of cigarette smoking, cigar smoking, pipe smoking, and alcohol drinking. Results refer to the composite models including all the three factors simultaneously. As the‘animal products’ and cereals pattern showed negative loadings, the Quintile V corresponded to the lowest level of intake of the dominant nutrients for this pattern and was chosen as the reference category for comparability with the other patterns.
b
P value for heterogeneity between studies.
cWhen heterogeneity between studies was detected (P< 0.01), we presentedfixed-effects and random-effects estimates from the corresponding mixed-effects models including random-effects terms for the ‘antioxidant vitamins and fiber’ pattern.
dReference category. e
P value for linear trend.
original
articles
Annals of Oncology | Edefonti et al. V olume 23 | No. 7 | July 2012length of the list of selected nutrients to use in factor analysis. This has effects in terms of identified dietary patterns and corresponding associations. A shorter list results in less opportunity to distinguish different patterns and their independent contribution to cancer risk. In our dataset, information on single components of total carbohydrates or protein (i.e. starch and soluble carbohydrates or animal and vegetable protein) is available only in some studies, and those nutrients were not considered from the original list. When we carried out a similar PCFA analysis on the Italian data included in the INHANCE consortium [47,48], we identified a‘starch-rich’ pattern based on starch, vegetable protein, and sodium, whereas animal protein and soluble carbohydrates loaded highly on the‘animal products’ and ‘vitamins and fiber’ patterns, respectively. In both data sets, the ‘animal products’ and the `starch-rich' patterns explained ∼25 % and 15 % of the total variance, respectively. The‘animal products’ pattern was positively associated with oral and pharyngeal and laryngeal cancer; the‘starch-rich’ pattern was protective for oral and pharyngeal cancer and at risk, with a borderline significance, for laryngeal cancer. In the current analysis, we were not able to distinguish a‘starch-rich’ pattern, and total carbohydrates and protein loaded highly on the‘animal products and cereals’ pattern. Accordingly, this pattern explained a greater proportion of total variance, 38 % , which is almost equal to the sum of the explained variances from
the‘animal products’ and the ‘starch-rich’ patterns from our previous analyses. The‘animal products and cereals’ pattern was not associated with oral and pharyngeal cancer, taking into account the simultaneous protective effect of the carbohydrates components and the deleterious effect of the animal components. The significant risk of laryngeal cancer associated to the‘animal products and cereals’ pattern reflects the consistent risks of carbohydrates and animal components.
Given the mentioned difficulties in pooling dietary data, together with the different characteristics of the various populations, including variable exposure to alcohol and tobacco, a degree of heterogeneity across studies is to be expected. In our analysis, heterogeneity between studies emerged in thefixed-effects models for the three retained patterns and was confirmed through model selection in the mixed-effects models for the‘antioxidant vitamins and fiber’ pattern. Our inspection of study-specific findings, influence analyses, and subgroup analyses stratifying by study pointed to the presence of heterogeneity between European and American studies, especially for laryngeal cancer. To further elucidate this issue, we carried out separate factor analyses by study center. In all the study-specific analyses, a minimum of three patterns emerged explaining >70 % of the total variance, with a consistent‘antioxidant vitamins and fiber’ pattern inversely related to both cancers.
Table 5. Odds ratios (ORs)afor oral cavity and pharyngeal cancer and corresponding 95 % confidence intervals (CIs) on factor scores quintiles, according
to anatomical subsite
Oral cavity Oropharynx/
Hypopharynx
Oral cavity or pharynx not otherwise specified P studiesb Controls (n = 4897) Cases (n = 453) OR (95% CI) Cases (n = 1023) OR (95% CI) Cases (n = 197) OR (95% CI) Animal products and cereals
V quintile 974 87 1c 155 1c 34 1c 0.820
IV quintile 983 87 0.95 (0.68–1.33) 161 0.95 (0.73–1.23) 32 0.72 (0.43–1.20) III quintile 979 85 0.85 (0.61–1.20) 174 0.88 (0.68–1.14) 32 0.72 (0.43–1.20) II quintile 978 93 0.92 (0.66–1.29) 230 1.05 (0.81–1.35) 44 1.05 (0.64–1.71) I quintile 983 101 0.91 (0.65–1.28) 303 1.16 (0.91–1.49) 55 1.25 (0.76–2.05) Antioxidant vitamins andfiber
I quintile 981 120 1c 329 1c 61 1c 0.025 II quintile 976 103 0.95 (0.70–1.28) 220 0.80 (0.65–1.00) 47 0.82 (0.55–1.24) III quintile 982 96 0.85 (0.62–1.16) 185 0.71 (0.57–0.89) 33 0.65 (0.41–1.02) IV quintile 981 71 0.69 (0.50–0.96) 158 0.61 (0.48–0.77) 31 0.58 (0.36–0.92) V quintile 977 63 0.64 (0.45–0.90) 131 0.56 (0.43–0.72) 25 0.43 (0.26–0.72) Fats I quintile 981 85 1c 171 1c 47 1c 0.114 II quintile 978 90 1.06 (0.76–1.48) 198 1.13 (0.88–1.46) 28 0.56 (0.34–0.93) III quintile 986 80 0.90 (0.64–1.27) 222 1.20 (0.93–1.54) 49 0.97 (0.63–1.50) IV quintile 971 108 1.12 (0.81–1.55) 212 0.98 (0.76–1.26) 36 0.60 (0.37–0.96) V quintile 981 90 0.85 (0.60–1.19) 220 0.81 (0.63–1.04) 37 0.57 (0.36–0.92)
aEstimated from a multiple polytomous logistic regression model adjusted for age, sex, education, race/ethnicity, study center, pack-years of cigarette
smoking, cigar smoking, pipe smoking, and alcohol drinking. Results refer to the composite model including all the three factors simultaneously. As the ‘animal products and cereals’ pattern showed negative loadings, the Quintile V corresponded to the lowest level of intake of the dominant nutrients for this pattern and was chosen as the reference category for comparability with the other patterns.
bP value for heterogeneity between studies. As no heterogeneity between studies was detected (P < 0.01), we presented estimates from thefixed-effects model
only.
cReference category.
Annals of Oncology
original articles
Factor analysis is the most common statistical method used today in the identification of a posteriori dietary patterns in studies on diet and cancer. Factor analysis may take care of multicollinearity problems in studies centered on dietary exposures and offer advantages over adjustment for selected individual nutrients to model residual confounding
phenomena in studies centered on nondietary exposures [49]. Although subjective decisions are involved at each stage of this process [12,50], we applied adhoc procedures for checking these decisions and limiting the effects of potential biases due to them [51].
A two-stage method [52] is a simple, valid, and practical alternative to GLMM for the analysis of pooled binary data, lending itself toflexibility with respect to differences in design, confounders, and data collection across studies. However, it is unclear how well the two-stage method would perform if individual studies were smaller, especially when there are a few of them, as in our case. For this reason, and also because covariates had already been uniformly defined and coded, we preferred tofit joint GLMMs directly.
At least 13 papers have been reported in the literature to assess the association between dietary patterns and HNC and/or its subsites: eight identified a posteriori dietary patterns [47,48,53–58], four identified a priori dietary patterns [15,59–61], and one applied both the approaches [62]. Six of these papers were based on companion case– control studies conducted in Brazil [53, 54,58] and Uruguay [55, 56, 62], andfive were based on companion case–control studies conducted in Italy [15,47,48,59,60]. A posteriori dietary patterns support our evidence in favor of a protective effect of fruit and vegetables alone, in the form of‘vitamins andfiber’ [47,48] or ‘vegetables and fruits’ [62] patterns, or in combination withfish, poultry, and/or dairy products, in the form of ‘healthy’ [55] or ‘prudent’ patterns [54, 56, 58], although for the latter type of patterns, the association with HNC was not always significant [54,55]. Moreover, the effects of the‘fats’ pattern are consistent with those of the ‘unsaturated fats’ and ‘animal unsaturated fatty acids’ patterns, which were protective for oral and pharyngeal cancer, and detrimental for laryngeal cancer, respectively [47, 48]. A similar indication of a negative effect of animal fats comes from the `Western patterns', based on red and processed meats and eggs, for both laryngeal cancer and upper aerodigestive tract cancer (UADTC), overall and among men only [55, 56]; however, a‘high-fat’ pattern, based on high-fat dairy products and eggs, was positively associated with laryngeal cancer risk in former smokers only [55]. The animal components loading highly on the‘animal products and cereals’ pattern may also be partly responsible for the positive association with laryngeal cancer identified in our study for this pattern. A priori dietary patterns confirmed the general protective effect of Mediterranean-type dietary habits for HNC, UADTC, and their subsites [15,61,62] and of diversity in food consumption, especially of diversity within vegetables and fruits [59, 60], except for a detrimental effect of meat diversity for laryngeal cancer [60].
Thesefindings are consistent with the evidence coming from a recent review on diet and oral and pharyngeal cancer [9] and from the largest European case–control study on diet and
UADTC [63], where red meat was positively related, and vegetable, fruit, and olive oil inversely related to it. This confirms the relevance of the dietary pattern approach, which tends to be more general than the single-food one while providing overlapping conclusions.
acknowledgements
VE was supported by an Environmental Cancer Risk, Nutrition and Individual Susceptibility training fellowship.
funding
The International Head and Neck Cancer Epidemiology consortium was supported by a grant from the US National Institutes of Health, National Cancer Institute (R03CA113157). Individual studies were funded by the following grants: (i) Italy Multicenter study: Italian Association for Research on Cancer, Italian League Against Cancer, and Italian Ministry of University and Research; (ii) Swiss study: Swiss League against Cancer and the Swiss Research against Cancer/Oncosuisse (KFS-700 and OCS-1633); (iii) Los Angeles study: National Institutes of Health (P50CA90388, R01DA11386,
R03CA77954, T32CA09142, U01CA96134, and R21ES011667) and the Alper Research Program for Environmental Genomics of the UCLA Jonsson Comprehensive Cancer Center; (iv) Boston study: National Institutes of Health, National Cancer Institute (CA100679, CA78609); (v) Memorial Sloan–Kettering Cancer Center study: NIH (R01CA51845).
disclosure
The authors declare no conflicts of interest.
references
1. IARC Working Group on the Evaluation of Carcinogenic Risks to Humans. Tobacco smoke and involuntary smoking. IARC Monogr Eval Carcinog Risk Hum 2004; 83. Lyon, France: IARC Press.
2. IARC Working Group on the Evaluation of Carcinogenic Risks to Humans. Alcohol drinking. IARC Monogr Eval Carcinog Risks Hum 1988; 44. Lyon, France: IARC Press
3. Blot WJ, McLaughlin JK, Winn DM et al.. Smoking and drinking in relation to oral and pharyngeal cancer. Cancer Res 1988; 48: 3282–3287.
4. Negri E, La Vecchia C, Franceschi S, Tavani A Attributable risk for oral cancer in northern Italy. Cancer Epidemiol Biomarkers Prev 1993; 2: 189–193.
5. Hashibe M, Brennan P, Chuang SC et al.. Interaction between tobacco and alcohol use and the risk of head and neck cancer: pooled analysis in the International Head and Neck Cancer Epidemiology Consortium. Cancer Epidemiol Biomarkers Prev 2009; 18: 541–550.
6. Boffetta P, Couto E, Wichmann J et al.. Fruit and vegetable intake and overall cancer risk in the European Prospective Investigation into Cancer and Nutrition (EPIC). J Natl Cancer Inst 2010; 102: 529–537.
7. World Cancer Research Fund/American Institute for Cancer ResearchFood, Nutrition, Physical Activity and the Prevention of Cancer: A Global Perspective 2007 Washington, DC: AICR
8. Pavia M, Pileggi C, Nobile CG, Angelillo IF Association between fruit and vegetable consumption and oral cancer: a meta-analysis of observational studies. Am J Clin Nutr 2006; 83: 1126–1134.
9. Lucenteforte E, Garavello W, Bosetti C, La Vecchia C Dietary factors and oral and pharyngeal cancer risk. Oral Oncol 2009; 45: 461–467.
original articles
Annals of Oncology10. Hu FB Dietary pattern analysis: a new direction in nutritional epidemiology. Curr Opin Lipidol 2002; 13: 3–9.
11. Trichopoulou A, Kouris-Blazos A, Wahlqvist ML et al.. Diet and overall survival in elderly people. BMJ 1995; 311: 1457–1460.
12. Newby PK, Tucker KL Empirically derived eating patterns using factor or cluster analysis: a review. Nutr Rev 2004; 62: 177–203.
13. Kant AK Dietary patterns and health outcomes. J Am Diet Assoc 2004; 104: 615–635.
14. Conway DI, Hashibe M, Boffetta P et al.. Enhancing epidemiologic research on head and neck cancer: INHANCE—The international head and neck cancer epidemiology consortium. Oral Oncol 2009; 45: 743–746.
15. Bosetti C, Gallus S, Trichopoulou A et al.. Influence of the Mediterranean diet on the risk of cancers of the upper aerodigestive tract. Cancer Epidemiol Biomarkers Prev 2003; 12: 1091–1094.
16. Rossi M, Garavello W, Talamini R et al.. Flavonoids and the risk of oral and pharyngeal cancer: a case-control study from Italy. Cancer Epidemiol Biomarkers Prev 2007; 16: 1621–1625.
17. Levi F, Pasche C, La Vecchia C et al.. Food groups and risk of oral and pharyngeal cancer. Int J Cancer 1998; 77: 705–709.
18. Peters ES, Luckett BG, Applebaum KM et al.. Dairy products, leanness, and head and neck squamous cell carcinoma. Head Neck 2008; 30: 1193–1195.
19. Cui Y, Morgenstern H, Greenland S et al.. Polymorphism of Xeroderma Pigmentosum group G and the risk of lung cancer and squamous cell carcinomas of the oropharynx, larynx and esophagus. Int J Cancer 2006; 118: 714–720.
20. Peters ES, McClean MD, Liu M et al.. The ADH1C polymorphism modifies the risk of squamous cell carcinoma of the head and neck associated with alcohol and tobacco use. Cancer Epidemiol Biomarkers Prev 2005; 14: 476–482.
21. Schantz SP, Zhang ZF, Spitz MS et al.. Genetic susceptibility to head and neck cancer: interaction between nutrition and mutagen sensitivity. Laryngoscope 1997; 107: 765–771.
22. Hayes RB, Bravo-Otero E, Kleinman DV et al.. Tobacco and alcohol use and oral cancer in Puerto Rico. Cancer Causes Control 1999; 10: 27–33.
23. Decarli A, Franceschi S, Ferraroni M et al.. Validation of a food-frequency questionnaire to assess dietary intakes in cancer studies in Italy. Results for specific nutrients. Ann Epidemiol 1996; 6: 110–118.
24. Franceschi S, Barbone F, Negri E et al.. Reproducibility of an Italian food frequency questionnaire for cancer studies. Results for specific nutrients. Ann Epidemiol 1995; 5: 69–75.
25. Rimm EB, Giovannucci EL, Stampfer MJ et al.. Reproducibility and validity of an expanded self-administered semiquantitative food frequency questionnaire among male health professionals. Am J Epidemiol 1992; 135: 1114–1116.
26. Gnagnarella P, Parpinel M, Salvini S et al.. The update of the Italian Food Composition Database. J Food Comp Anal 2004; 17: 509–522.
27. Salvini S, Parpinel M, Gnagnarella P et al.. Banca Dati di Composizione degli Alimenti per Studi Epidemiologici in Italia 1998 Milano, Italy: Istituto Europeo di Oncologia
28. Public Use Data Tape Documentation: Model Gram and Nutrient Composition (Computer Tape 5702 and 5703) 1982 Hyattsville, MD: National Center for Health Statistics
29. HHHQ-DietSys Analysis Software, Version 4.02 1999 Bethesda, MD: National Cancer Institutehttp://appliedresearch.cancer.gov/DietSys/materials.html (23 November 2011, date last accessed)
30. USDA. U.S. Department of Agriculture Nutrient Database for Standard Reference 1993 Washington, DC: U.S. Government Printing Office
31. Hashibe M, Brennan P, Benhamou S et al.. Alcohol drinking in never users of tobacco, cigarette smoking in never drinkers, and the risk of head and neck cancer: pooled analysis in the International Head and Neck Cancer Epidemiology Consortium. J Natl Cancer Inst 2007; 99: 777–779.
32. Scott DWMultivariate Density Estimation: Theory, Practice and Visualization 2005 New York: Wiley
33. Pett MA, Lackey NR, Sullivan JJMaking Sense of Factor Analysis: The Use of Factor Analysis for Instrument Development in Health Care Research 2003 Thousand Oaks, CA: Sage Publications
34. Johnson RA, Wichern DWApplied Multivariate Statistical Analysis 20076th editionUpper Saddle River, NJ: Prentice-Hall
35. Comrey AL, Lee HBA First Course in Factor Analysis 19922nd editionHillsdale, NJ: Lawrence Erlbaum Associates, Publishers
36. Revelle WPsych: Procedures for Psychological, Psychometric, and Personality Research 2009http://cran.r-project.org/web/packages/psych/index.html R package version 1.0-85 (23 November 2011, date last accessed)
37. Cronbach LJ Coefficient alpha and the internal structure of tests. Psychometrika 1951; 18: 297–334.
38. Hosmer DW, Lemeshow SApplied Logistic Regression 20002nd editionNew York: John Wiley & Sons, Inc.
39. Pinheiro JC, Bates DMMixed-Effects Models in S and S-PLUS 2000 New York: Springer-Verlag
40. Bates DMlme4: Mixed-Effects Modeling with R in press New York: Food and Agriculture Organization of the United Nations,http://lme4.R-forge.R-project.org/ book/ (23 November 2011, date last accessed)
41. R Development Core Team. R: A Language and Environment for Statistical Computing 2010 Vienna, Austria: R Foundation for Statistical Computinghttp:// www.R-project.org (23 November 2011, date last accessed)
42. Ihaka R, Gentleman R R: a language for data analysis and graphics. J Comput Graph Statist 1996; 5: 299–314.
43. Schaefer J, Opgen-Rhein R, Strimmer KCorpcor: Efficient Estimation of Covariance and (Partial) Correlation 2007http://www.strimmerlab.org/software/ corpcor/. R package version 1.4.7 (23 November 2011, date last accessed) 44. Bates D, Maechler Mlme4: Linear Mixed-Effects Models Using S4 Classes
2009http://cran.r-project.org/web/packages/lme4/lme4.pdf R package version 0.999375-32 (23 November 2011, date last accessed)
45. Venables WN, Ripley BDModern Applied Statistics With S 20024th editionNew York: Springerhttp://www.stats.ox.ac.uk/pub/MASS4 (23 November 2011, date last accessed)
46. Rizopoulos D ltm: an R package for latent variable modelling and item response theory analyses. J Stat Softw 2006; 17: 1–25. http://www.jstatsoft.org/v17/i05. R package version 0.8.4 (23 November 2011, date last accessed)
47. Edefonti V, Bravi F, La Vecchia C et al.. Nutrient-based dietary patterns and the risk of oral and pharyngeal cancer. Oral Oncol 2010; 46: 343– 348.
48. Edefonti V, Bravi F, Garavello W et al.. Nutrient-based dietary patterns and laryngeal cancer: evidence from an exploratory factor analysis. Cancer Epidemiol Biomarkers Prev 2010; 19: 18–27.
49. Imamura F, Lichtenstein AH, Dallal GE et al.. Confounding by dietary patterns of the inverse association between alcohol consumption and type 2 diabetes risk. Am J Epidemiol 2009; 170: 37–45.
50. Edefonti V, Randi G, La Vecchia C et al.. Dietary patterns and breast cancer: a review with focus on methodological issues. Nutr Rev 2009; 67: 297–314. 51. Bravi F, Edefonti V, Bosetti C et al.. Nutrient dietary patterns and the risk of
colorectal cancer: a case-control study from Italy. Cancer Causes Control 2010; 2111: 1911–1918.
52. Stukel TA, Demidenko E, Dykes J et al.. Two-stage methods for the analysis of pooled data. Stat Med 2001; 20: 2115–2120.
53. Marchioni DM, Latorre Mdo R, Eluf-Neto J et al.. Identification of dietary patterns using factor analysis in an epidemiological study in Sao Paulo. Sao Paulo Med J 2005; 123: 124–127.
54. Marchioni DM, Fisberg RM, Francisco de Gois Filho J et al.. Dietary patterns and risk of oral cancer: a case-control study in Sao Paulo, Brazil. Rev Saude Publica 2007; 41: 19–26.
55. De Stefani E, Boffetta P, Ronco AL et al.. Dietary patterns and risk of laryngeal cancer: an exploratory factor analysis in Uruguayan men. Int J Cancer 2007; 121: 1086–1091.
56. De Stefani E, Deneo-Pellegrini H, Boffetta P et al.. Dietary patterns and risk of cancer: a factor analysis in Uruguay. Int J Cancer 2009; 124: 1391–1397. 57. Amtha R, Zain R, Razak IA et al.. Dietary patterns and risk of oral cancer: a factor
analysis study of a population in Jakarta, Indonesia. Oral Oncol 2009; 45: e49–e53. 58. Toledo AL, Koifman RJ, Koifman S, Marchioni DM Dietary patterns and risk of
oral and pharyngeal cancer: a case-control study in Rio de Janeiro, Brazil. Cad Saude Publica 2010; 26: 135–142.
Annals of Oncology
original articles
59. Garavello W, Giordano L, Bosetti C et al.. Diet diversity and the risk of oral and pharyngeal cancer. Eur J Nutr 2008; 47: 280–284.
60. Garavello W, Lucenteforte E, Bosetti C et al.. Diet diversity and the risk of laryngeal cancer: a case-control study from Italy and Switzerland. Oral Oncol 2009; 45: 85–89.
61. Samoli E, Lagiou A, Nikolopoulos E et al.. Mediterranean diet and upper aerodigestive tract cancer: the Greek segment of the Alcohol-Related Cancers
and Genetic Susceptibility in Europe study. Br J Nutr 2010; 1049: 1369–1374.
62. De Stefani E, Boffetta P, Ronco AL et al.. Dietary patterns and risk of cancer of the oral cavity and pharynx in Uruguay. Nutr Cancer 2005; 51: 132–139. 63. Lagiou P, Talamini R, Samoli E et al.. Diet and upper-aerodigestive tract cancer
in Europe: the ARCAGE study. Int J Cancer 2009; 124: 2671–2676.
Annals of Oncology 23: 1880–1888, 2012 doi:10.1093/annonc/mdr541 Published online 21 November 2011
Cigarette smoking and pancreatic cancer: an analysis
from the International Pancreatic Cancer Case-Control
Consortium (Panc4)
C. Bosetti
1,2*, E. Lucenteforte
1,3,4, D. T. Silverman
5, G. Petersen
6, P. M. Bracci
7, B. T. Ji
5,
E. Negri
1, D. Li
8, H. A. Risch
9, S. H. Olson
10, S. Gallinger
11, A. B. Miller
12, H. B.
Bueno-de-Mesquita
13,14, R. Talamini
15, J. Polesel
15, P. Ghadirian
16, P. A. Baghurst
17, W. Zatonski
18,
E. Fontham
19, W. R. Bamlet
6, E. A. Holly
7, P. Bertuccio
1,3, Y. T. Gao
20, M. Hassan
8, H. Yu
10,
R. C. Kurtz
21, M. Cotterchio
12,22, J. Su
5, P. Maisonneuve
23, E. J. Duell
24, P. Boffetta
25,26& C. La
Vecchia
1,3,261
Department of Epidemiology, Istituto di Ricerche Farmacologiche“Mario Negri”, Milan, Italy;2
Department of Complex Genetics, Cluster of Genetics and Cell Biology, NUTRIM School for Nutrition, Toxicology and Metabolism, Maastricht University Medical Centre, Maastricht, The Netherlands;3
Department of Occupational Health, University of Milan, Milan;4
Department of Preclinical and Clinical Pharmacology“Mario Aiazzi Mancini”, Università degli Studi di Firenze, Florence, Italy;5
National Cancer Institute, Bethesda;6
Mayo Clinic, Rochester;7
University of California, San Francisco, San Francisco;8
The University of Texas M. D. Anderson Cancer Center, Houston;
9
Department of Epidemiology and Public Health, Yale University School of Medicine, New Haven;10
Department of Epidemiology and Biostatistics, Memorial Sloan– Kettering Cancer Center, New York, USA;11
Toronto General Hospital, Toronto;12
Dalla Lana School of Public Health, University of Toronto, Toronto, Canada;13
National Institute for Public Health and the Environment (RIVM), Bilthoven;14
Department of Gastroenterology and Hepatology, University Medical Center Utrecht, Utrecht, The Netherlands;15
Unit of Epidemiology and Biostatistics, Centro di Riferimento Oncologico—National Cancer Institute, Aviano, Italy;16
Epidemiology Research Unit, Research Centre (CRCHUM), Montréal, Canada;17
Public Health, Women’s and Children’s Hospital, Adelaide, Australia;18
Cancer Center and Institute of Oncology, Warsaw, Poland;19
Louisiana State University School of Public Health, New Orleans, USA;20
Shanghai Cancer Institute, Shanghai, China;21
Department of Medicine, Memorial Sloan–Kettering Cancer Center, New York, USA;22
Cancer Care Ontario, Toronto, Canada;23
European Institute of Oncology, Milan, Italy;24
Catalan Institute of Oncology, Barcelona, Spain;25
The Tisch Cancer Institute and Institute for Translational Epidemiology, Mount Sinai School of Medicine, New York, USA;26
International Prevention Research Institute, Lyon, France
Received 5 April 2011; revised 6 October 2011; accepted 10 October 2011
Background:To evaluate the dose–response relationship between cigarette smoking and pancreatic cancer and to examine the effects of temporal variables.
Methods:We analyzed data from 12 case–control studies within the International Pancreatic Cancer Case–Control Consortium (PanC4), including 6507 pancreatic cases and 12 890 controls. We estimated summary odds ratios (ORs) by pooling study-specific ORs using random-effects models.
Results:Compared with never smokers, the OR was 1.2 (95% confidence interval [CI] 1.0–1.3) for former smokers and 2.2 (95% CI 1.7–2.8) for current cigarette smokers, with a significant increasing trend in risk with increasing number of cigarettes among current smokers (OR = 3.4 for≥35 cigarettes per day, P for trend <0.0001). Risk increased in relation to duration of cigarette smoking up to 40 years of smoking (OR = 2.4). No trend in risk was observed for age at starting cigarette smoking, whereas risk decreased with increasing time since cigarette cessation, the OR being 0.98 after 20 years.
Conclusions:This uniquely large pooled analysis confirms that current cigarette smoking is associated with a twofold increased risk of pancreatic cancer and that the risk increases with the number of cigarettes smoked and duration of
*Correspondence to: Dr C. Bosetti, Department of Epidemiology, Istituto di Ricerche Farmacologiche“Mario Negri”, Via La Masa 19, Milan 2056, Italy. Tel +39-0239014526; Fax: +39-33200231; E-mail: [email protected]
original articles
Annals of Oncology© The Author 2011. Published by Oxford University Press on behalf of the European Society for Medical Oncology. All rights reserved. For permissions, please email: [email protected].