Anal Bioanal Chem (2006) 386: 169–179 DOI 10.1007/s00216-006-0515-1
S P E C I A L I S S U E PA P E R
Daniel Fliegel . Katrin Fuhrer . Marc Gonin . Detlef Günther
Evaluation of a pulsed glow discharge time-of-flight mass
spectrometer as a detector for gas chromatography
and the influence of the glow discharge source parameters
on the information volume in chemical speciation analysis
Received: 7 March 2006 / Revised: 19 April 2006 / Accepted: 26 April 2006 / Published online: 14 June 2006
# Springer-Verlag 2006
Abstract The figures of merit of a pulsed glow discharge time-of-flight mass spectrometer (GD-TOFMS) as a detector for gas chromatography (GC) analysis were evaluated. The mass resolution for the GD-TOFMS was determined on FWHM in the high mass range (208Pb+) as high as 5,500. Precision of 400 subsequent analyses was calculated on 63Cu+ to be better than 1% RSD with no significant drift over the time of the analysis. Isotope precision based on the63Cu+/65Cu+ratio over 400 analyses was 1.5% RSD. The limits of detection for gaseous analytes (toluene in methanol as solvent) were determined to be as low as several hundred ppb or several hundred pg absolute without using any pre-concentration technique. Furthermore, the different GD source parameters like capillary distance, cathode–anode spacing, and GD source pressure with regards to the accessible elemental, structur-al, and molecular information were evaluated. It was demonstrated that each of these parameters has severe influence on the ratio of elemental, structural, and parent molecular information in chemical speciation analysis.
Keywords Pulsed glow discharge time-of-flight mass spectrometry . Gas chromatography . Mass resolution . Signal stability . Isotope ratios . Speciation analysis
Introduction
The evaluation of the speciation of an analyte is one of the most challenging and active research areas in analytical and
environmental chemistry [1–5]. Studies investigating the speciation of an analyte often involve hyphenated techniques such as gas chromatography coupled to mass spectrometry (GC-MS) or liquid chromatography coupled to mass spectrometry (LC-MS). Ionization sources used are either hard ionization sources like inductively coupled plasmas (ICP) [3, 5] or soft ionization sources such as electrospray ionization (ESI) or matrix-assisted laser desorption and ionization (MALDI) [6, 7]. In the case of the ICP, the elemental limits of detection are excellent [8]. However, the speciation of the analyte is solely based on the retention time of the coupled separation technique. The softer ionization sources such as ESI or MALDI thus provide molecular and structural information, but they provide insufficient limits of detection for elemental analysis [4]. This means that for the acquisition of elemental and structural information, the sample has to be split up and two instruments have to be involved in the analysis.
One possible solution is the use of one dynamic plasma as an ionization source instead of two ‘static’ ionization sources [9–13]. A possible dynamic plasma source is the pulsed glow discharge [14,15]. The dynamic plasma results in a transient ionization regime. Ionization moves from hard ionization during the plasma breakdown (termed prepeak) by electron impact ionization, over intermediate ionization in the plateau region to soft ionization by Penning ionization in the afterpeak. Dynamic glow discharge plasmas are generated by applying a dc or rf high voltage pulse to a cathode in a low pressure noble gas. Pulsed voltages are in the range of some hundred volts to kilo volts with discharge gas pressures normally in the millibar region with pulse widths of microseconds to milliseconds. Such a concept has been used by Majidi and co-workers [15–18]. In their pioneering work, they coupled a pulsed glow discharge ion source and a time-of-flight mass spectrometer (GD-TOFMS) to a GC. With this setup the quasi-simultaneous acquisition of elemental, structural, and molecular information was possible [14]. Even quantifica-tion of an analyte based on the most abundant fragment has D. Fliegel . D. Günther (*)
Laboratory of Inorganic Chemistry, ETH Zürich, 8093 Zürich, Switzerland e-mail: [email protected] Fax: +41-44-6331071 K. Fuhrer . M. Gonin Tofwerk, 3602 Thun, Switzerland
been reported recently [19]. However, to be competitive with state of the art GC detectors, limits of detection in the region of femptograms to picograms is a paramount requirement [20,21]. Moreover, the simultaneous acquisi-tion of the complete mass spectra in TOFMS for the entire GD pulse during the GC run requires a high speed data acquisition system with the capabilities of processing huge amounts of data in real time [19]. Up to now, the accessible hardware allowed no continuous mapping of the GD pulse during a GC run. Additionally the maximum data acqui-sition speed has been only as high as 3 Hz [19]. This implies that mapping transient analyte signals leads to mismatch of the GC elution and the acquisition; even the use of a TOFMS results in poor data precision [19].
Therefore, to take full advantage of hyphenated GD-TOFMS for speciation analysis, an instrument combining low limits of detection with a high data throughput acquisition system is needed.
This study, thus, focuses on the characterization of a new pulsed GD orthogonal-TOFMS coupled to GC for the analysis of gaseous analytes. Furthermore, the discharge parameters such as GD source pressure, GC capillary position, and cathode–anode spacing were evaluated with respect to the acquired elemental, structural, and molecular information. In this study the optimum conditions for speciation analysis are evaluated, and the figures of merit of the new system are compared to those reported previously [14–16,19,22].
Experimental
Instrumentation
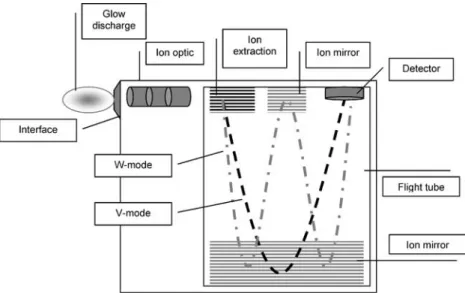
An orthogonal extracting TOFMS (Tofwerk AG, Thun, Switzerland, Fig.1) was used for this study. This TOFMS offers two different modes of operation, a high mass resolving W-mode and a high-sensitivity V-mode. In the first mode a W-shaped ion flight path is used (multi ion reflection), whereas in the high-sensitivity mode the ion
flight path is V-shaped (single reflection). The TOFMS is equipped with an MCP-PMT hybrid ion detector (Burle Technologies, Lancaster, PA, USA) in order to defer detector saturation. An in-house build glow discharge chamber was coupled to the TOFMS via a sampler and a skimmer orifice with differential pumping (Fig.2). A flat cathode glow discharge configuration with a pure copper (Goodfellow Cambridge Limited, UK, Copper 99.99+%) cathode was used, if not otherwise stated. The cathode with a diameter of 5 mm was mounted on a direct insertion probe, similar to that described by Lewis et al. [14]. To avoid a pin-type glow discharge the cathode was insulated with a macor housing. The glow discharge chamber was furthermore equipped with a vacuum-tight inlet for the gas capillary column. The capillary column was adjusted within the glow discharge chamber using an x/y translation stage. The transfer line from the GC to the glow discharge plasma was heated by using electrical heat tape. A Carlos Erba (HRGC 5160) gas chromatograph with a non-polar Fig. 1 Schematic drawing of
the TOFMS. In the high mass resolution mode the ions fly on a W-shaped path; in the high-sensitivity mode (achieved by switching an ion mirror) the ion path describes a V shape
Fig. 2 Design of the glow discharge source with a direct insertion probe for the cathode, the GC capillary interface, and the sampler for the TOFMS
glass capillary (Zebron ZB-5, 30 m×0.32 mm×25μm) was used in all GC experiments. The GC was operated in isothermal mode with split injection. A detailed list of the GC parameters is given in Table1.
The glow discharge was operated in dc pulsed mode, using a pulse period of 10 ms and pulse duration of typically 5 ms, if not otherwise stated. The GD plasma was powered by a dc pulse generator (GBS, RUP 3–3A, Grosserkmannsdorf, Germany) which was triggered by the TOFMS timing controller. A detailed view of the glow discharge pulsing scheme and the TOFMS parameters used for the different experiments is given in Table1.
Table 1 Experimental parameters
Parameter Value
Mass resolution
Cathode Brass, in-house
standard
Pulse duration 3 ms
Pulse cycle 24.6 ms
Cathode–anode spacing 10 mm
Discharge voltage −800 V dc
Discharge pressure 0.73 mbar Ar
Summed spectra 450 spectra
TOF extraction period 100μm
MCP voltage 730 V
Scintillator voltage 2,800 V
Ion transmission
Cathode Cu, Goodfellow
Discharge pressure 0.73 mbar Ar
TOF parameters similar to calibration experiments
GC parameters for all experiments
Inlet Split, 1-mL volume
Inlet temperature 180 °C
Column Zebron, ZB-5,
30 m×32 mm× 25μm
Temperature program 60 °C, isothermal
Calibration experiments
Injected volume 2μL
Cathode Cu, Goodfellow
Pulse duration 2 ms
Pulse cycle 10 ms1, 20.4 ms2
Cathode–anode spacing 8 mm
Discharge voltage −1.3 kV dc
Discharge pressure 0.8 mbar Ar
Summed spectra 100
Number of writes 130
Samples per spectra 25,000
Background threshold Active
TOF extraction period 100μs
TOF pulse width 2μs
MCP voltage 800 V1, 700 V2 Scintillator voltage 2,800 V Skimmer 350 V Drift tube 3,400 V1, 3,800 V2 Lens 3,200 V1, 1,300 V2 Reflector grid 816 V1, 670 V2 Reflector backplane 670 V Hard mirror 670 V1, 0 V2 1 W-mode,2V-mode Signal stability study
Cathode Brass, in-house
standard
Pulse duration 5 ms
Parameter Value
Pulse cycle 10 ms
Discharge voltage −0.75 kV dc
Discharge pressure 0.75 mbar Ar
Summed spectra 400
Number of writes 500, first 100 trashed
Samples per spectra 25,000
Background threshold Active
TOF extraction period 100μs
TOF pulse width 2μs
MCP voltage 800 V Scintillator voltage 2,800 V Skimmer 350 V Drift tube 3,400 V Lens 3,200 V Reflector grid 816 V Reflector backplane 670 V Hard mirror 670 V Optimization study Injected volume 2μL
Cathode Cu, Goodfellow
Pulse duration 5 ms
Pulse cycle 10 ms
Discharge voltage −1 kV dc
Summed spectra 100
Number of writes 130
Samples per spectra 52,000
Background threshold Active
TOF extraction period 100μs
TOF pulse width 2μs
MCP voltage 800 V Scintillator voltage 2,800 V Skimmer 350 V Drift tube 3,400 V Lens 3,200 V Reflector grid 816 V Reflector backplane 670 V Hard mirror 670 V Table 1 (continued)
Reagents
Toluene and methanol (HPLC grade) were used as reagent. For each analysis a 2-μL aliquot was injected by using a 5-μL syringe (Hamilton, Bonaduz, Switzerland).
Toluene was used because of the relatively low boiling point, and the related short GC run times. Owing to the distinct fractionation pattern of toluene in the plateau and in the after peak, a direct comparison of the performance to recently published results was possible [19].
Data acquisition
The TOFMS operates using an extraction period of typically 200 μs. This means that a 10-ms GD pulse period can be monitored with a series of up to several tens of TOF extractions which are recorded into a data block. The data blocks of several GD pulses can be accumulated (averaged). For each GC data point several blocks were accumulated and the peaks in the mass spectra were integrated. If not stated otherwise, the data shown in the prepeak spectra were acquired at 0.09 ms after pulse ignition, the plateau at 2.990 ms after pulse ignition. The
afterpeak was recorded for all experiments at 0.59 ms after pulse termination.
Results and discussion
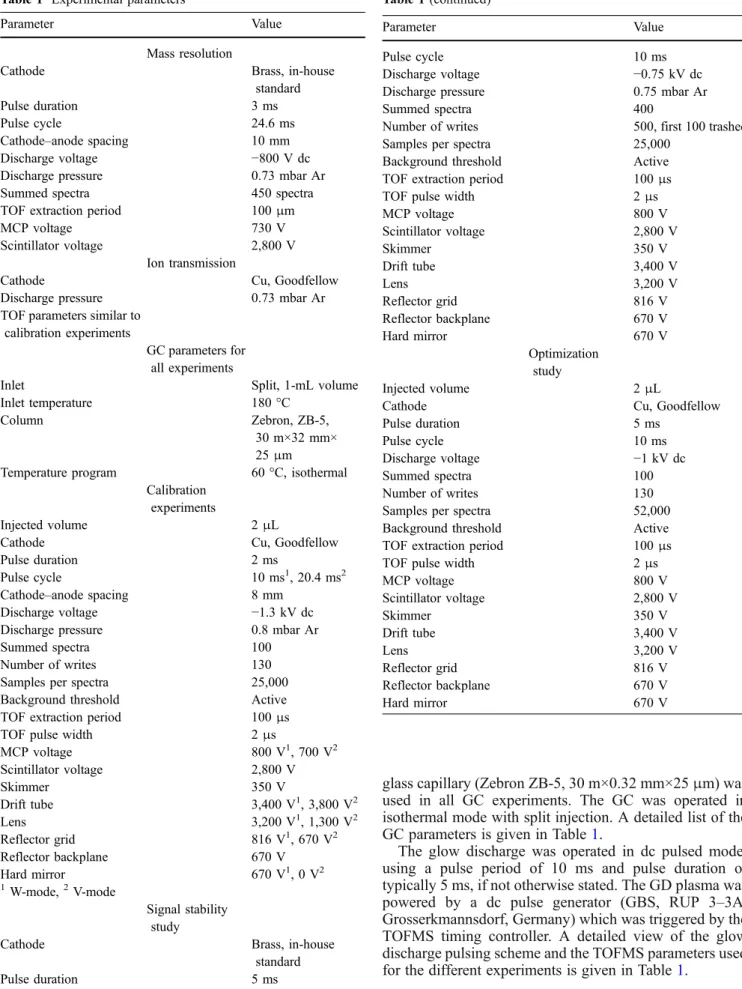
Electrical characteristics of the pulse voltage supply Figure 3a illustrates the transient voltage and current profile of the pulse generator. The voltage was recorded using a voltage divider and an oscilloscope (Tektronix Inc., TDS 5104B). Current was evaluated using a current probe (Tektronix Inc., AM 503) attached to the oscilloscope.
As can be seen the voltage and current follow a nearly square wave behavior. Therefore it is expected that about 3 ms after the pulse ignition the plasma is in a quasi-steady-state condition. Furthermore the discharging of the pulse generator is also very fast, any ion signal in the afterpeak therefore has to be based on long-lived plasma species.
Figure3b demonstrates the transient power regime. With increasing voltage the power increases and reaches values of around 1 W at pressures of approximately 0.5 mbar. Further voltage increase leads to arcing of the discharge.
Fig. 3 Current–voltage–pressure plots of the pulsed glow discharge with a, b constant pressure 0.46 mbar and c, d constant voltage −780 V dc. Each data point represents an average of 500 pulses
Figure 3c and d illustrate the increase in current with increased pressure, which results from a higher amount of possible charge carriers in the denser gas.
The spikes in Fig. 3 are attributed to displacement current. This capacity current always appears if a capacity load has to be induced to the cathode, chamber, and cables. It should be noted that the HV pulse generator used in this study was always operated in voltage-controlled mode and not in current-limited mode.
Mass resolving power
In TOFMS the mass resolving power can be either calculated based on the equation R=m/Δm, or based on the flight times. The flight times (t) are proportional to the mass (m) of an ion: t=(m/2qV)1/2d, where q is the charge, V the accelerating field, and d the length of the ion drift path; substituting this relationship into the equation for the mass resolving power it yields to R=m/Δm=t/2Δt.
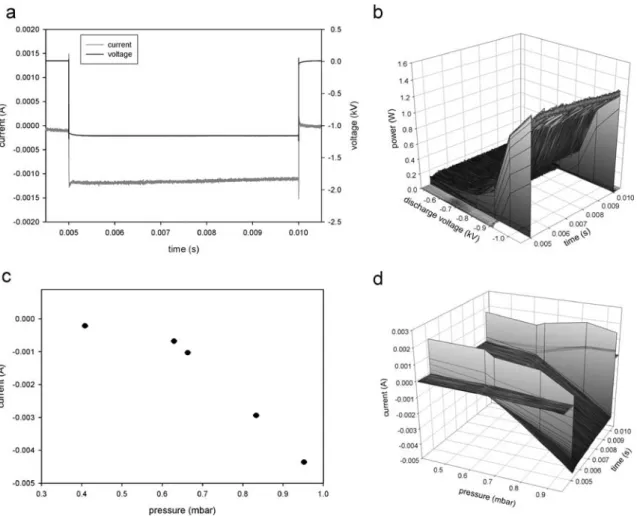
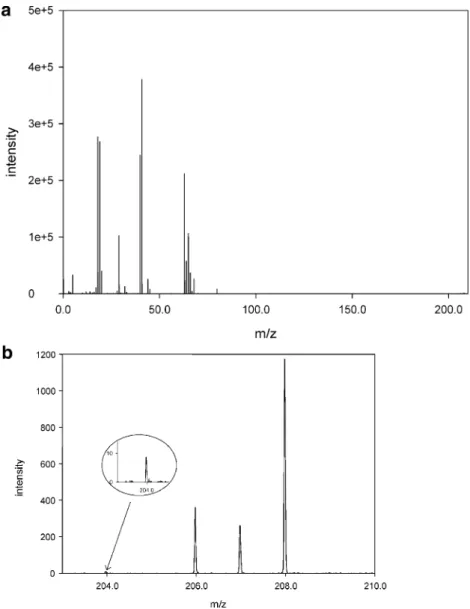
The mass resolving power of the TOFMS was evaluated using an in-house standard brass cathode. The resolving power was determined in W- and V-mode based on FWHM (50% criteria) and on the 10% criteria. As shown in Fig. 4, the FWHM mass resolving power is more than 5,500 for 208Pb+(W-mode) which is significantly higher than the resolving power reported for a modified commercial TOFMS system equipped with an in-house-built glow discharge source [23, 24]. The mass resolving power obtained in W-mode is in excess of 2,000 (10%) even in the mid-mass range. This demonstrates that resolution of some prominent interfer-ence in the mid-mass range such as 40Ar16O+/56Fe+ (required R=2,500) or 16O16O+/32S+ (required R=1,800) is possible when the system is optimized in terms of the resolving power.
Furthermore, the comparison of W-mode and V-mode mass resolving power reveals that the width Δt of a specific mass peak remains the same for both modes and that the increase in mass resolving power can be
attributed to the doubling of the flight time t. In this case, the mass resolution should double when the flight path is doubled. As demonstrated in Fig. 4 the mass resolution on every investigated mass on W-mode is indeed double compared to the mass resolving power in the V-mode. A mass spectrum of brass is shown in Fig. 5. The mass spectrum indicates that TOFMS pro-vides a dynamic range of at least 5 orders of magnitude, which was evaluated based on the ion signals for 204Pb+ and 40Ar1H+.
It is important to note that the instrument parameters for the TOFMS (MCP and scintillator voltage) and for the GD (frequency) are modified to avoid detector damage due to high ion current in V-Mode compared to the W-mode (Table 1). Data was recorded in the afterpeak due to the highest ion signal for the sputtered cathode material.
Ion transmission
Investigation of the 63Cu+ signal on switching from W- to V- mode results in an increased sensitivity of at least 1 order of magnitude for the V-mode (Fig.6). The reduced ion transmission in W-mode is caused by additional passages through grids and increased ion dispersion in the longer flight path. High mass resolving power is normally associated with lower sensitivity due to discrimination of ions with broader energy distribution.
Signal stability and isotope precision
The signal stability of the GD-TOFMS was evaluated based on 400 subsequent summed spectra, each of which in turn represents the integrated intensity of 400 summed spectra. The measurement was started after a pre-sputtering time of 100 times 400 spectra to avoid any surface effects (Fig.7). The relative standard deviation (RSD) of the63Cu+ signal was 0.91%, and the RSD of the 65Cu+ signal was calculated as 1.51%. The precision measured on the GD-TOFMS system was significantly better than those obtained by Pisonero and co-workers on a modified axial Grimm-GD-TOFMS [25]. In addition, no significant drift of the63Cu+and65Cu+ ion signal was observed over an analysis time of approximately 30 min. This precision was achieved by integrating over a time of 80 ms (400 times 200μs), whereas the data by Pisonero et al. were achieved by using an integration time of 1 s, leading to RSDs in brass samples of 10–15% [25].
The signal precision as a function of the signal intensity is in good agreement with the theoretical predictions for TOFMS [26]. When the achieved precision is primarily counting-statistic-limited, the precision should improve with 1/(N)1/2, where N represents the intensity or number of accumulated spectra. As shown in Fig.8, the RSD matches the 1/(N)1/2law closely. Thus, it is expected that the precision of the system is primarily limited by counting statistics. Fig. 4 Mass resolution in W- and V-modes calculated on FHWM
and on 10% criteria. Resolution was determined by using an in-house-built standard brass cathode
The 63Cu+/65Cu+ isotope ratio was determined to be 2.228±0.033 and this value is statistically not significant different from the expected value (2.247). Isotope precision (RSD) was determined as 1.50% over 400 measurements
(Fig. 7). The precision of the isotope ratio agrees with values obtained by an axial GD-TOFMS for direct solid analysis [25] and gas sampling [27].
Data was acquired in the afterpeak to obtain the highest ion signal for the sputtered material.
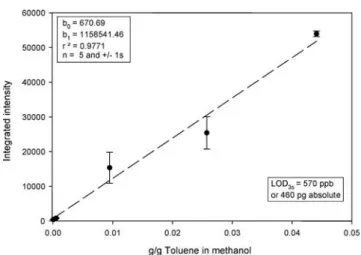
Calibration experiments: LODs for gaseous analytes Limits of detection (LODs) for gaseous analytes were calculated using the 91toluene+ (12C71H7+) peak in the plateau region. The toluene was injected as a toluene/ methanol mixture into a gas chromatograph coupled to the glow discharge chamber. The LOD was calculated on the basis of three times the standard deviation versus the slope of the calibration plot. It is known that increased analyte concentration in the discharge quenches the Ar metastable population, especially in the afterpeak. Furthermore, the sensitivity in the prepeak is significantly lower than the sensitivity on the most abundant fragment in the plateau [19]. Hence, only the plateau ion intensity of the most abundant fragment of toluene in the plateau time regime Fig. 5 a Mass spectrum of
brass (an in-house standard) used for mass resolution calcu-lations. b Enlargement of the mass spectrum shown in Fig.4a for the lead isotopes204Pb, 206
Pb,207Pb, and208Pb. Note that the dynamic range (40Ar1H+ vs.204Pb+) exceeds 5 orders of magnitude and the isotopic ratio of206Pb,207Pb, and208Pb is in agreement with the natural abundance of the lead isotopes
Fig. 6 Ion transmission in W-mode and V-mode based on the63Cu+ intensity
(91toluene+) was investigated here. Results show signifi-cant improvement in terms of limits of detection compared to similar experiments reported for an in-house-built linear TOFMS [19] (Figs.9and10). In agreement with the above discussed63Cu+intensities in W- and V-mode, the LOD in V-mode was approximately 1 order of magnitude im-proved. The observed improvement results from an increased spectral frequency on this system (100 Hz) and from increased ion transmission compared to the system previously reported [19]. LODs are still significantly higher than those published for toluene in GC analysis [20, 21]. However, it must be mentioned that no pre-concentration was used for these experiments. Further-more, the design of the glow discharge chamber allows a free expansion of the analyte at the end of the capillary. This most likely leads to an increased dilution in the glow
discharge chamber and, therefore, contributes to a reduc-tion in sensitivity.
The reproducibility in the GC mode shows some mismatch between the GD-TOFMS acquisition and the GC elution due to the fact that the GC was not triggered by the TOFMS. The TOFMS itself has to store the acquired data after each summed event. Yet, it should be noted that this data acquisition system nevertheless allows a complete mapping of a single GD pulse without any data storage in between. This storage of the data after a summed GD pulse needs, depending on the amount of data, between 0.1 and 0.6 s. Therefore, during this time no data can be acquired and transient information can be lost. In contrast, this is less significant for stable or continuous signals. The temporal resolution of the data acquisition system is as high as 1 ns and allows one to resolve each m/z peak This leads to better reproducibility, at least for the W-mode (RSD 9–12%) [19].
Fig. 7 Long-term stability of the ion signal of sputtered cath-ode material (cathcath-ode=in-house standard brass). Stability over 400 measurements shows RSD values between 1 and 1.5% with no significant drift over time. The63Cu+/65Cu+isotope ratio remains stable within a precision of 1.5% RSD. The mean of the isotope ratio matches within the uncertainty (1σ) the natural abundance of the copper isotopes
Fig. 8 RSD versus mean integrated intensity of different isotopes of a series of 400 measurements. The regression shows good correlation between the counting-statistic-related limitation of the precision (1/(N)1/2) and the measured data
Fig. 9 Calibration curve for gaseous analyte introduction via GC. Analyte was a toluene/methanol mixture. TOFMS was operated in W-mode
Optimization of GD source parameters Influence of cathode–anode spacing
For the evaluation of the influence of the cathode-anode spacing the GC capillary was placed directly in front of the sampler orifice and the pressure was kept constant. As known from the literature, the spacing between the cathode and the anode influences the spatial distribution of regions of the glow, [22] such as the cathode dark space, negative glow, Faraday dark space, and the positive column [28,29]. A shorter distance leads to compression of the glow. This compression of the glow squeezes not only the glow proportionally, but may also alter the structure of the glow. Regions may disappear until only the cathode dark space is left [28], after which the discharge will no longer be self-sustaining. The threshold condition for a self-sustaining
discharge is known as Paschen’s law. The most important region in the glow discharge for ionization and excitation is the negative glow. This region has the highest density of Ar cations, which are necessary for charge exchange and as precursors for the formation of the metastable population. The metastable population itself may ionize the analyte via the Penning process. Electron impact ionization is important in the boundary layer between cathode dark space and negative glow, where electrons are not fully thermalized yet and may still have sufficient energy at the boundary to fragment and ionize analytes. Even further away from the cathode, the electrons are thermalized. Excited and ionized species such as Ar+, Ar*, or M+/* may become de-excited by collision with neutral species. This implies that the cathode–anode spacing has an important influence.
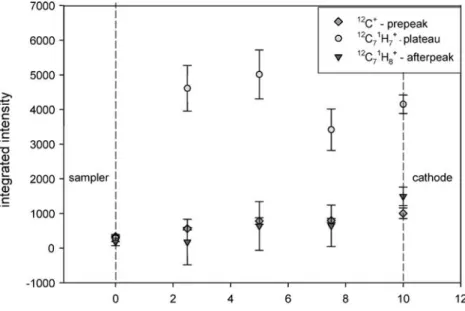
As demonstrated in Fig. 11, the signal intensity of the 12C71H7+ peaks at intermediate distances (ca. 5-mm distance). The highest intensity of the 12C71H7+ peak could be attributed to an increased proportion of electron impact ionization near the cathode by non thermalized electrons [30]. The secondary maximum of 12C71H7+ in the plateau is consistent with the reported optical investigations of sputtered excited and ionized copper in the plateau [16].
In addition, the data show a decrease of the parent molecular ion (12C71H8+) in the afterpeak with increasing distance, which is not accompanied by a secondary maximum compared to the 12C71H7+ ion in the plateau. This could be explained by a decrease of the Ar metastable population with increased distance and is in good agreement with the theoretical model of the Ar metastable population in the afterpeak reported by Bogaerts and co-workers [31] and from other experimental findings [16,22,
32]. The other possibility could be de-excitation of the parent molecular ion by ion-neutral collision during the diffusion through the glow discharge chamber to the Fig. 10 Calibration curve for gaseous analyte introduction via GC.
Analyte was a toluene/methanol mixture. TOFMS was operated in V-mode
Fig. 11 Influence of the cath-ode–anode spacing on the ion intensity of the elemental, structural, and molecular re-sponse. Analyte was toluene, injected as a toluene/methanol mixture via GC. All other parameters like pressure, capillary distance, or GC conditions were kept constant
sampler orifice. Moreover the analyte also can get lost to the chamber wall during the travel trough the chamber.
Influence of capillary position
The GC capillary position relative to the sample orifice at a fixed cathode–anode distance of 10 mm was investigated with respect to the signal intensity of the12C+,12C71H7+, and12C71H8+ions. Close to the sampler orifice, the analyte has little time to interact with the reactive plasma species like Ar+, e−fast, or Ar*.
If Penning ionization is one of the major pathways for ionization of analytes in the glow discharge [31], the signal intensity should drop with decreased metastable popula-tion. Hoppstock and Harrison demonstrated that the metastable population peaks at distances near the cathode [33], and theoretical modeling also shows a maximum of the Ar metastable population near the cathode at the beginning of the afterpeak [31]. When the capillary is moved closer to the cathode, the residence time for the analyte in the glow rises. However, the potential diffusion of the analyte is also increased. With a longer residence time in the plasma, the probability on increased fraction-ation should be also pronounced. Moreover, at distances very close to the cathode, the analyte might be fractionated even more due to electron impact ionization by primary electrons emitted from the cathode and accelerated in the cathode dark space.
Interestingly, the ion distribution shows some similarity between the capillary position (Fig. 12) and the ion distribution obtained during the cathode–anode spacing experiments (Fig.11). In both experiments the ion intensity of 91toluene+ peaks at intermediate conditions. This is in agreement with the theoretical calculated Cu+intensity in a pulsed glow discharge. For the copper, the maximum intensity was found in the intermediate distance region,
where a secondary maximum peaks near the cathode during the plateau. This behavior is also correlated with the Ar+distribution [31]. The similarity of the maximum could be based on similar analyte introduction areas into the glow. Either the capillary is moved into the different regions of the glow or the cathode is moved and the best discharge region for effective ionization is matched with the capillary outlet. The spatial distribution of the parent molecular ion (12C71H8+) agrees with the theoretical calculations by Bogaerts et al. [31]. In these studies the time window for the observation of the afterpeak ion was short after the pulse termination. Therefore, a maximum in the parent molecular ion intensity should be expected at capillary distances close to the cathode and an intermediate intensity should be observed at intermediate distances. These theoretical calculations could be proved by the experiment.92Toluene+peaks at capillary distances close to the cathode and drops to low intensity far away from the cathode (Fig.12).
The40Ar+is not shown for this particular experiment in Fig.12since with constant pressure and constant cathode– anode distance no change was observed in the discharge species like Ar+.
Influence of GD pressure
To investigate the influence of the source pressure, the GC flow settings were kept constant and additional discharge gas was added to the GD chamber via a needle valve. Capillary position and cathode–anode spacing were also kept constant.
The pressure of the glow discharge influences not only the structure of the glow discharge (at higher pressures the glow gets compressed) but also changes the fundamental plasma properties. These can be electron temperature or the population of the different discharge species. It is well
Fig. 12 Influence of the capil-lary position on the ion intensity of the elemental, structural, and molecular response. Analyte was toluene, injected as a toluene/methanol mixture via GC. All other parameters like cathode–anode spacing, pressure, and GC conditions were kept constant
known that the Ar metastable population peaks at intermediate pressures (0.8–1 mbar) [34, 35], whereas at lower pressures the electron impact ionization gets more important.
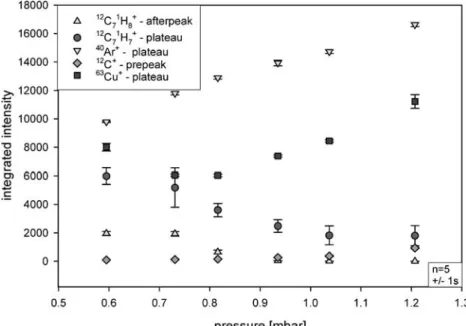
The optimization study shows that the sensitivity decreases with increasing pressure, especially for the 91
toluene+ fragment. This is consistent with previously published data [22]. An increased dilution of the analyte by additional discharge gas has been given as explanation. However, de-excitation by analyte+–neutral collisions might be also possible. Moreover the data show that tuning the discharge to maximum sensitivity of species such as 40
Ar+or the maximum sensitivity for the sputtered cathode material (here 63Cu+) does not necessary reflect the maximum sensitivity for transient organic analytes. As shown in Fig.13the intensity of40Ar+and63Cu+increases with increased pressure. Therefore it can be assumed that the denser gas leads to a higher production of 40Ar+. The increased copper intensity is then caused by increased sputtering of Ar0fast, Cu+, and Ar+ bombardment of the cathode. The decrease of the parent molecular fragment (12C71H8+), furthermore indicates a decrease in the Penning ionization with increased pressure due to a reduced metastable population [34,35].
The decrease of the structural information and the strong increase of the 40Ar+intensity points out that the charge exchange between 40Ar+and the analyte might not be a dominant process, even at high pressure conditions.
Interestingly, the intensity of the elemental information increases with increased pressure. However, it has been reported that significant carbon deposition on the cathode and the cathode housing occurs after several analyses [14]. The increased12C+intensity could, thus, either be based on an increased fractionation of the analyte or also on increased sputtering of deposited carbon from cathode.
The best sensitivity of the most abundant fragment can be expected at low pressures and intermediate capillary and
cathode–anode distances. Under these conditions, the diffusion and de-excitation of the analyte is minimized and the analyte is introduced in the negative glow, having enough time to interact with the important plasma species like Ar* and Ar+. At the same time, low pressures will favor a high Ar metastable population and therefore the parent molecular information, providing the molecular mass of the analyte, will be maximized as well. However for primary elemental information a higher pressure might be appropriate.
Conclusion
The capabilities of an orthogonal TOFMS coupled to a millisecond pulsed glow discharge as a detector for gas chromatography have been studied. The mass resolution shows a significant improvement compared to previously reported data. The mass resolution indicates that some of the prominent interferences in the mid-mass range can be eliminated.
Based on 63Cu+ it was demonstrated that the stability over 400 measurements is approximately 1% RSD, and the precision of the GD-TOFMS system follows the expected behavior and seems to be primarily counting-statistic-limited when using long integration times. This allows the possibility of precise multi-isotope detection for continu-ous sample introduction systems.
Sensitivity of the instrument in GC mode demonstrates improved LODs for gaseous analytes. LODs are still higher than those obtained by state of the art GC detectors; however, by carefully designing a GD source with different cathode geometry and limited analyte diffusion one could further improve the LODs.
In addition, the influence of the source parameters such as GD working pressure, cathode–anode spacing, and GC capillary position on the obtained elemental, structural, and
Fig. 13 Influence of the source pressure on the ion intensity of the elemental, structural, and molecular response. Analyte was toluene, injected as a toluene/methanol mixture via GC. All other parameters like cathode–anode spacing, capillary distance, or GC conditions were kept constant
parent molecular information in GC-GD-TOFMS was demonstrated. It was shown that each of these parameters significantly influenced the ratio of elemental, structural, and parent molecular information. Furthermore these findings comply very well with theoretical calculations on ion distributions in pulsed GD. This study also implies that a simple tuning on non-transient species like Ar+or Cu+will not automatically provide to the highest sensi-tivity for transient analytes on the structural and parent molecular information level. Therefore, a careful optimiza-tion of the source parameters is required to gain full advantage of pulsed GD as an ionization source for speciation analysis. Further work will focus on the improvement of the system with respect to sensitivity and resolution.
Acknowledgements This research project was supported by ETH Zurich research grant (TH-16/04-3). The authors like to thank P. Trüssel (ETH workshop) for building the GD source. Many fruitful discussions with J. Pisonero and support from V. Majidi and C. Lewis helping to design the new system are greatly acknowledged. Thanks to EMPA Dübendorf for the loan of the GC.
References
1. Lobinski R, Adams FC (1997) Spectrochim Acta Part B 52:1865–1903
2. Szpunar J, McSheehy S, Polec K, Vacchina V, Mounicou S, Rodriguez I, Lobinski R (2000) Spectrochim Acta Part B 55:779–793
3. Caruso JA, Wuilloud RG, Altamirano JC, Harris WR (2006) J Toxicol Environ Health 9:41–61
4. Feldmann J (2005) TrAC Trends Anal Chem 24:228–242 5. Waddell R, Lewis C, Hang W, Hassell C, Majidi V (2005) Appl
Spectrosc 40:33–69
6. Cristoni S, Bernardi LR (2004) Expert Rev Proteomics 1:469–483
7. Siuzdak G (1994) Proc Natl Acad Sci USA 91:11290–11297 8. Heumann KG, Gallus SM, Radlinger G, Vogl J (1998) J Anal
At Spectrom 13:1001–1008
9. Ray SJ, Andrade F, Gamez G, McClenathan D, Rogers D, Schilling G, Wetzel W, Hieftje GM (2004) J Chromatogr A1050:3–34
10. Guzowski JP, Hieftje GM (2000) Anal Chem 72:3812–3820
11. McClenathan DM, Hieftje GM (2005) J Anal At Spectrom 20:1318–1325
12. Waggoner JW, Milstein LS, Belkin M, Sutton KL, Caruso JA, Fannin HB (1999) J Anal At Spectrom 15:13–18
13. O’Connor G, Ebdon L, Evans EH (1999) J Anal At Spectrom 14:1303–1306
14. Lewis CL, Moser MA, Dale DE, Hang W, Hassell C, King FL, Majidi V (2003) Anal Chem 75:1983–1996
15. Majidi V, Moser M, Lewis C, Hang W, King FL (1999) J Anal At Spectrom 15:19–25
16. Lewis CL, Jackson GP, Doorn SK, Majidi V, King FL (2001) Spectrochim Acta Part B 56:487–501
17. Steiner RE, Lewis CL, Majidi V (1999) J Anal At Spectrom 14:1537–1541
18. Steiner RE, Lewis CL, King FL (1997) Anal Chem 69:1715–1721
19. Fliegel D, Waddell R, Majidi V, Günther D, Lewis CL (2005) Anal Chem 77:1847–1852
20. Kubinec R, Adamuscin J, Jurdakova H, Foltin M, Ostrovsky I, Kraus A, Sojak L (2005) J Chromatogr A 1084:90–94 21. Shin HS, Kwon OS (2000) Bull Korean Chem Soc
21:1101–1105
22. Lewis CL, Moser MA, Hang W, Dale DE, Hassell DC, Majidi V (2003) J Anal At Spectrom 18:629–636
23. Pisonero-Castro J, Costa-Fernandez JM, Pereiro R, Bordel N, Sanz-Medel A (2002) J Anal At Spectrom 17:786–789 24. Hang W, Baker C, Smith BW, Winefordner JD, and Harrison
WW (1997) J Anal At Spectrom 12:143–149
25. Pisonero J, Costa JM, Pereiro R, Bordel N, Sanz-Medel A (2001) J Anal At Spectrom 16:1253–1258
26. Mahoney PP, Ray SJ, Hieftje GM (1997) Appl Spectrosc 51: A16–A28
27. Guzowski JP, Broekaert JAC, Hieftje GM (2000) Spectrochim Acta, Part B 55:1295–1314
28. Marcus, RK Broekaert, JAC (2003) Glow dicharge plasmas in analytical spectroscopy. Wiley, Chichester
29. Chapmann, B (1980) Glow discharge processes. Wiley, New York
30. Bogaerts A, Gijbels R, Goedheer WJ (1996) Anal Chem 68:2296–2303
31. Bogaerts A, Gijbels R, Jackson GP (2003) J Anal At Spectrom 18:533–548
32. Lewis CL, Oxley ES, Ban CK, Steiner RE, King FL (1999) Anal Chem 71:230–234
33. Hoppstock K, Harrison WW (1995) Anal Chem 67:3167–3171 34. Hardy KA, Sheldon JW (1982) J Appl Phys 53:8532–8536 35. Levy MK, Serxner D, Angstadt AD, Smith RL, Hess KR