JOURNAL OF FINANCIAL AND QUANTITATIVE ANALYSIS Vol. 48, No. 3, June 2013, pp. 729–760
COPYRIGHT 2013, MICHAEL G. FOSTER SCHOOL OF BUSINESS, UNIVERSITY OF WASHINGTON, SEATTLE, WA 98195
doi:10.1017/S0022109013000252
The Shareholder Base and Payout Policy
Andriy Bodnaruk and Per Östberg
∗Abstract
We examine the relation between the shareholder base and payout policy. Consistent with the idea that the shareholder base is related to the cost of external financing, we find that firms with small shareholder bases have lower payout levels and maintain higher cash holdings. We show that undertaking an open market repurchase results in a significant reduction in the size of the shareholder base. Consequently, we find that firms with small shareholder bases are less likely to undertake a repurchase (reduce the shareholder base even further) and are more likely to pay special dividends.
I.
Introduction
Finance practitioners acknowledge that having a broad shareholder base is an important factor for many corporate decisions. For example, in a recent study of firm payout policy, Brav, Graham, Harvey, and Michaely ((2005), p. 523) survey financial executives and conclude, “With respect to payout policy, the rules of the game include . . . [to] have a broad and diverse investor base.” In practice, the acquisition and management of the shareholder base is the task of the investor relations department or an investor relations firm.1 Wolfe Axelrod Weinberger Associates LLC, an investor relations firm, states in its company
∗Bodnaruk, abodnaru@nd.edu, Department of Finance, University of Notre Dame, 238 Mendoza College of Business, Notre Dame, IN 46556; ¨Ostberg, per.oestberg@bf.uzh.ch, Department of Bank-ing and Finance, University of Z¨urich, Plattenstrasse 14, 8032, Z¨urich, Switzerland. Insightful com-ments and suggestions were received from an anonymous referee, Liam Brunt (a discussant), Shane Corwin, Magnus Dahlquist, Franc¸ois Degeorge, Mara Faccio (a discussant), Miguel Ferreira (a discus-sant), Francesco Franzoni, Gustavo Grullon (a discusdiscus-sant), Paul Malatesta (the editor), Kjell Nyborg, Raghu Rau, Peter Schotman, Paul Schultz, Andrei Simonov, Andrew Winton, and seminar participants at the 2009 American Finance Association meetings in San Francisco, the 2008 CEPR Symposium in Financial Markets in Gerzensee, the 2009 European Finance Association meetings in Bergen, the 2008 European Winter Finance Summit, the 2008 State of Indiana Conference, Michigan State University, the University of Lugano, the University of Maastricht, and the Norwegian School of Economics. Financial support from Bankforskningsinstitutet, the Jan Wallander och Tom Hedelius Foundation, and the National Centre of Competence in Research “Financial Valuation and Risk Management” (NCCR FINRISK) is gratefully acknowledged.
1Brennan and Tamarowski (2000) and Bushee and Miller (2008) discuss the role of the investor relations department.
729
terms of use, available at https:/www.cambridge.org/core/terms. https://doi.org/10.1017/S0022109013000252
profile, “Our efforts culminate in a broader shareholder base, increased liquid-ity, a lower future cost of capital, and a better valuation relative to the client’s peer group.”2
Despite the apparent importance of the shareholder base, there is little academic evidence documenting the impact of the shareholder base on corpo-rate decisions. In this paper we investigate the effect of the shareholder base on the level and method of payout. There are several arguments that imply that ex-ternal financing is costly for firms with small shareholder bases, either due to asymmetric information or lack of visibility. First, the investor base may proxy for the amount of external financing that is available. Merton (1987) argues that the shareholder base measures the recognition of the firm. He develops an incom-plete risk sharing model where the size of the firm’s investor base is negatively related to the required return on the firm and hence its cost of capital.3 In this setting, a small shareholder base implies that a limited fraction of the market is informed about the stock, and hence the firm has a limited number of investors from whom to raise capital. Merton argues that the shareholder base can be ex-panded (allowing more funds to be raised), but at an increasing cost.4
Second, having a large number of shareholders may reduce asymmetric in-formation between insiders and outsiders through more inin-formation production. The intuition behind this argument is captured in the model of Holmstr¨om and Tirole (1993). In their model, an increase in liquidity trading (the investor base) leads to an increase in stock price informativeness through more information acquisition by speculators. Additionally, empirically it has been documented that analysts tend to follow firms that have more investors.5,6So a large investor base leads to greater analyst coverage and more information production overall, which ultimately implies less asymmetric information about the firm.
Both of the above arguments imply that external financing is costly for firms with small shareholder bases. Effectively, for firms with limited shareholder bases there is a wedge between the internal and external costs of funds.7
We develop and test 3 hypotheses concerning the relation between the share-holder base and payout policy using a sample of firms on NYSE, NASDAQ, and AMEX between 1984 and 2004. First, a negative relation between the cost of external financing and the shareholder base implies that we expect firms with small shareholder bases to maintain higher cash reserves and pay out less to their
2See http://www.wolfeaxelrod.com/profile.htm
3There is a growing literature that documents a relationship between investor recognition and the value of the firm. Kadlec and McConnell (1994), Foerster and Karolyi (1999), and King and Segal (2009) consider the effect of listing decisions on the shareholder base and their implications for firm valuation. Additionally, Lehavy and Sloan (2008), Bodnaruk and ¨Ostberg (2009), and Fang and Peress (2009) document that there is a cross-sectional relationship between investor recognition and returns and therefore the cost of capital.
4Grullon, Kanatas, and Weston (2004) find that firms that have higher advertising expenditure also have a larger number of shareholders, implying that the shareholder base can be expanded at a cost.
5See Bhushan and O’Brien (1990).
6Additionally, Bjerring, Lakonishok, and Vermaelen (1993), Dimson and Marsh (1984), and Womack (1996) document that analyst forecasts are informative.
7Kaplan and Zingales (1997) define a financial constraint as a wedge between the internal and external costs of capital.
Bodnaruk and Östberg 731
shareholders. We find that small shareholder base firms have lower payout levels and larger cash reserves. Firms at the 25th percentile of the shareholder base hold between 4.75% and 6.38% more in cash reserves and pay out between 12.32% and 23.37% less of their total assets (all relative to the unconditional mean) than firms at the 75th percentile. We corroborate the above results on payout and cash holdings in an experimental setting by considering the introduction of decimal quotes on the NYSE, NASDAQ, and AMEX in 2001. Decimalization significantly lowered trading costs and thereby raised the demand for shares by retail investors and resulted in larger shareholder bases. This increase in the shareholder base is associated with increased payout and decreased cash holdings.
Second, given that there is a relation between the shareholder base and the cost of external financing, this has a potential implication for the method of pay-out. A firm considering making a special distribution can do it either in the form of a share repurchase or through a special dividend. However, an open market repurchase program may result in a smaller shareholder base if some sharehold-ers tender all of their shares. We verify this conjecture by demonstrating that a share repurchase program reduces the shareholder base of the firm by at least 3.70% over the year of repurchase and the subsequent year. In contrast, non-repurchasing firms experience, on average, a 3.69% increase in the shareholder base over a 2-year period. Additionally, we find that special dividends either have a neutral or even a positive effect on the shareholder base. Hence, we argue that while repurchases are more tax efficient, they come at a cost of reduction in the shareholder base and therefore higher costs of external financing.
Third, given that a repurchase reduces the size of the shareholder base, we examine whether firms with already limited shareholder bases are less likely to use a repurchase as a payout method and thereby reduce the size of the share-holder base even further. We find that the shareshare-holder base significantly affects the decision to undertake one-time distributions to shareholders and the method of distribution (special dividend or share repurchase). Small shareholder base com-panies are more likely to pay special dividends. Conditional on undertaking a spe-cial distribution, companies with small shareholder bases choose to use a spespe-cial dividend (rather than repurchase stock) in 9.05% of cases, while 6.49% of special distributions of large shareholder base firms are special dividends.
This paper is most closely related to the literature on investor recognition and investor relations. This literature (see footnote 3) documents the effect of the shareholder base on firm value and returns. The finding that the size of the shareholder base is negatively related to returns implies that small shareholder base firms have high costs of financing. We contribute to this literature by showing that the shareholder base is also related to payout policy.
A number of papers consider the effect of investor composition on payout policy. For example, Grinstein and Michaely (2005) examine the relation be-tween institutional holdings and payout policy. Among other things, they find that institutions prefer dividend-paying to nondividend-paying firms and firms that repurchase shares. Instead of considering the composition of the firm’s in-vestor base, we examine the size of the shareholder base. In fact, our measure of the shareholder base is weakly negatively related to the degree of institutional holdings (the correlation is−8.8%), which makes intuitive sense if institutional terms of use, available at https:/www.cambridge.org/core/terms. https://doi.org/10.1017/S0022109013000252
investors hold larger positions. Nonetheless, we control for institutional holdings in our estimations, and this does not affect our results qualitatively. Addition-ally, in a robustness section, we demonstrate that our results are independent of investor composition. In essence, the clientele literature considers stock demand by certain investor groups and relates that to payout policy, whereas we consider the relation between total investor demand and payout policy.
Our paper is related to the extensive literature on the level and method of payout. One of the central and most cited determinants of the level of payout is agency costs (Easterbrook (1984), Jensen (1986)). Early work by Rozeff (1982) uses the shareholder base as a proxy for the degree to which the firm is exposed to agency costs. In Rozeff’s setting, a firm that has a large shareholder base is also more exposed to agency problems and therefore pays out more as dividends. Rozeff documents a positive correlation between the shareholder base and div-idend payout, which is what we find (except that we consider Total Payout). Although the size of the shareholder base may be related to the agency costs of the firm, studies that examine the effect of exogenous increases in the shareholder base (Amihud, Mendelson, and Uno (1999), Sec. IV.C) document that increases in the shareholder base are also associated with price increases.8 If the shareholder base only is a proxy for agency costs, then we would expect a price decrease fol-lowing an exogenous increase in the shareholder base as the agency problem has been aggravated. In our regressions we include a host of control variables that capture agency costs.
Another strand of literature relates financial constraints to the level of payout (e.g., Kaplan and Zingales (1997), Cleary (1999), and Whited and Wu (2006)). This literature uses a set of variables (including whether a firm has a positive dividend payout) to construct measures of the cost of external financing. In con-trast, this paper provides evidence that the shareholder base influences the cost of external financing and therefore is related to payout and cash holdings of firms.
Finally, this paper is related to the literature that examines the determinants of the method of payout.9To our knowledge, we are the first to demonstrate that a repurchase adversely affects the shareholder base and that this adverse impact is a possible explanation for why firms pay dividends even though repurchases are more tax efficient. Other potential reasons for undertaking a repurchase rather than a dividend include trading gains by insiders (Barclay and Smith (1988)), improved stock liquidity (Barclay and Smith), flexibility (Stephens and Weisbach (1998)), and maintaining the earnings per share (EPS) in the presence of stock option exercise (Kahle (2002)).10
8See footnote 3.
9Black (1976) coined the term “dividend puzzle,” which refers to the fact that dividends represent a substantial proportion of total payout even though repurchases are more tax efficient. To explain this puzzle there has to be some drawback to using a repurchase as a payout method instead of dividends. As we have shown, one difference between repurchases and dividends is that a repurchase reduces the shareholder base while a dividend does not. Therefore, a possible explanation to the dividend puzzle is that firms are reluctant to reduce their shareholder base.
10It is noteworthy that the improved liquidity, flexibility, and EPS motives for undertaking a repur-chase cannot explain the extensive use of dividends, since they all present advantages of repurrepur-chases over dividends.
Bodnaruk and Östberg 733
The remainder of this paper is organized as follows: In Section II, we present testable hypotheses, and we describe our data in Section III. In Section IV, we present empirical findings. We consider the robustness of our results in Section V, and in Section VI we conclude.
II.
Testable Hypotheses
Our testable hypotheses come from the tenet that there is a negative relation between the size of the shareholder base and the cost of external financing. For example, the model of Holmstr¨om and Tirole (1993) can be used to justify why price informativeness is related to the size of the shareholder base.11 If a larger shareholder base implies more liquidity traders, then this creates incentives for speculators to acquire more information. This in turn leads to lower asymmetric information and therefore to a lower cost of external financing. Since the share-holder base is related to price informativeness, the wedge between the cost of internal and external funds is decreasing in the size of the shareholder base.
Merton (1987) argues that a good measure of the recognition of a firm is the size of its shareholder base. Likewise, the recognition of a firm is related to the availability of external financing. So a firm with a large shareholder base is widely recognized and therefore has a large pool of investors from whom to raise financing. Merton argues that increasing the shareholder base may be possible, but at a cost that is increasing. Therefore, it is costly for a firm with a limited shareholder base to raise external financing, since this requires a costly increase in the shareholder base (the firm requires more recognition).
The above arguments imply that the wedge between the cost of internal and external financing is negatively related to the size of the shareholder base. Therefore, we expect firms with small shareholder bases to rely more on internal financing. As a result, these firms are expected to pay out less to their shareholders and maintain higher cash reserves. Stated formally,
Hypothesis 1. Firms with small shareholder bases pay out less and hold larger
cash reserves.
Since the shareholder base and the cost of external financing are negatively related, a reduction in the shareholder base will make external financing even more expensive, which leads to a lower firm value. Indeed, Brav et al. ((2005), p. 515) report, “Many firms feel that their stock price would fall if they had a less diverse investor base.”
The method of payout may have implications for the size of the shareholder base. For example, when a firm undertakes a repurchase, there are two counter-vailing effects on the size of the shareholder base. On the one hand, the firm generates attention by announcing a repurchase, but on the other hand, if a sub-stantial proportion of shareholders tender their entire stake, then the shareholder
11Harris ((2003), p. 238) writes: “Informed trading is most profitable in markets with many unin-formed traders. In such markets, many inunin-formed traders compete to acquire information and act on it. These markets therefore have very informative prices.”
terms of use, available at https:/www.cambridge.org/core/terms. https://doi.org/10.1017/S0022109013000252
base will fall as a result of a repurchase. We anticipate the 2nd effect to dominate. Hence our 2nd hypothesis:
Hypothesis 2. Share repurchases reduce the size of the shareholder base.
If a repurchase results in a smaller shareholder base, we expect that firms will try to avoid undertaking a repurchase if the shareholder base is already lim-ited (and external financing is expensive). In contrast, a special dividend has no adverse impact on the shareholder base. This leads to the following testable hypothesis:
Hypothesis 3. Firms with small shareholder bases are more likely to pay a special
dividend and less likely to undertake a repurchase.
III.
Sample and Variable Construction
A. DataOur sample includes firms listed on NYSE, AMEX, and NASDAQ. Data on returns, prices, repurchases, and shares outstanding of stocks are obtained from the Center for Research in Security Prices (CRSP)-Compustat Merged Indus-trial Database (CCM). We only consider firms with CRSP share codes 10 or 11. Therefore, we exclude American depositary receipts, closed-end funds, real es-tate investment trusts, and shares of firms incorporated outside the United Ses-tates. Our main variable of interest is the number of common shareholders of record (Shareholder Base, CCM data 100), hence we exclude firms for which this vari-able is missing.
We consider the period from 1984 to 2004. The choice of this period is motivated by the introduction of Securities and Exchange Commission (SEC) Rule 10b-18 in 1982, which provides a legal safe harbor for companies repur-chasing their shares, greatly reducing the ambiguity associated with this activity. Furthermore, since 1984, firms have been required to report the value of their re-purchases in their cash flow statements, and this item can be found in the CCM database as data item 115.
Our dependent variables are measures of firm cash holdings and payout. We follow Opler, Pinkowitz, Stulz, and Williamson (1999) and define Cash as the ratio of cash to total assets net of cash. Total Payout is defined as the sum of total dividends and repurchases over total assets. We construct our measure of repurchases using the CCM data item Purchase of Common and Preferred Stock (item 115), which reports the amount of money a company spends on repurchas-ing its own securities.12,13To construct our variable Fraction Repurchased, we di-vide the dollar value of shares repurchased by market capitalization. We further
12As a robustness test, we remove repurchases of preferred stock from our measure of repurchases (like in Dittmar (2000) and Weisbenner (2004)). The results are not affected.
13Banyi, Dyl, and Kahle (2008) compare the accuracy of different sources of repurchase data and conclude that Compustat purchases of common stock is the most accurate.
Bodnaruk and Östberg 735
screen stock repurchases by setting repurchases equal to 0 for any firm that does not repurchase at least 1% of its market value of equity (as in Dittmar (2000)).
We draw from DeAngelo, DeAngelo, and Skinner (2000) in identifying spe-cial dividends. We classify a cash distribution as a spespe-cial dividend if it carries distribution code of 1262 or 1272. These codes are used by CRSP if dividends are labeled year-end, final, extra, or special. We do not include “interim” div-idends (code 1282), since they are relatively uncommon in our sample period. We also exclude dividends with distribution code 1292, defined as “nonrecurring, or proceeds from sale of rights,” because they generally are not pure cash payouts to stockholders. We set a special dividend dummy (Special Dividend) to 1 if a company has paid a special dividend in a particular year, and 0 otherwise.
In selecting our sample, we omit firms with missing or negative values of
Market Capitalization and Book-to-Market (BM). We winsorize all of our
vari-ables at the 1st and 99th percentiles. We also remove companies with values of
Cash above 0.8. This leaves us with 52,679 firm-year observations, which are the
basis for our analysis.14
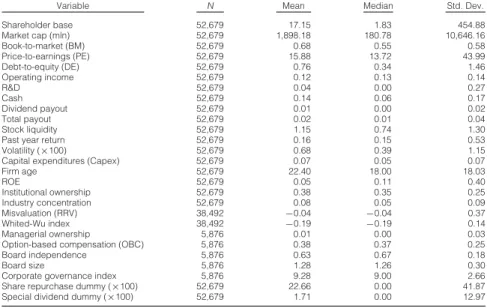
Table 1 presents descriptive statistics of our data. In our sample, firm cash holdings (Cash) are on average 14.62% of total assets. This is in line with Opler et al. (1999). The average total payout (Total Payout) in our sample is 2.40% of total assets. The average firm in our sample has 17,150 shareholders of record
TABLE 1
Descriptive Statistics of the Data
In Table 1, we present descriptive statistics on the variables used in our study. The shareholder base is given in 1,000s. All variables are described in the Appendix. All variables are winsorized at 1% and 99% of the distribution.
Variable N Mean Median Std. Dev.
Shareholder base 52,679 17.15 1.83 454.88 Market cap (mln) 52,679 1,898.18 180.78 10,646.16 Book-to-market (BM) 52,679 0.68 0.55 0.58 Price-to-earnings (PE) 52,679 15.88 13.72 43.99 Debt-to-equity (DE) 52,679 0.76 0.34 1.46 Operating income 52,679 0.12 0.13 0.14 R&D 52,679 0.04 0.00 0.27 Cash 52,679 0.14 0.06 0.17 Dividend payout 52,679 0.01 0.00 0.02 Total payout 52,679 0.02 0.01 0.04 Stock liquidity 52,679 1.15 0.74 1.30
Past year return 52,679 0.16 0.15 0.53
Volatility (×100) 52,679 0.68 0.39 1.15
Capital expenditures (Capex) 52,679 0.07 0.05 0.07
Firm age 52,679 22.40 18.00 18.03 ROE 52,679 0.05 0.11 0.40 Institutional ownership 52,679 0.38 0.35 0.25 Industry concentration 52,679 0.08 0.05 0.09 Misvaluation (RRV) 38,492 −0.04 −0.04 0.37 Whited-Wu index 38,492 −0.19 −0.19 0.14 Managerial ownership 5,876 0.01 0.00 0.03
Option-based compensation (OBC) 5,876 0.38 0.37 0.25
Board independence 5,876 0.63 0.67 0.18
Board size 5,876 1.28 1.26 0.30
Corporate governance index 5,876 9.28 9.00 2.66
Share repurchase dummy (×100) 52,679 22.66 0.00 41.87
Special dividend dummy (×100) 52,679 1.71 0.00 12.97
14As a robustness test, we removed all financial and regulated firms from our sample without affecting our results qualitatively.
terms of use, available at https:/www.cambridge.org/core/terms. https://doi.org/10.1017/S0022109013000252
(Shareholder Base). However, the median firm has only 1,830 shareholders. To correct for skewness, we use the logarithm of Shareholder Base. Additionally, a repurchase is undertaken in 22.66% of all firm years. A special dividend is undertaken in 1.71% of all firm years. In unreported analysis we document a declining trend in the frequency of special dividends. DeAngelo et al. (2000) con-clude that this is because firms that undertake special dividends frequently relabel these as regular dividends. However, like DeAngelo et al., we also find that the frequency of “large” specials does not decrease over our sample period.
There are a number of alternative stories that we need to control for. First, Grinstein and Michaely (2005) document that institutions avoid firms that do not pay dividends. However, among dividend payers they prefer firms that pay lower dividends. Institutions also prefer repurchasers and those firms that repurchase regularly. To that end, we include among our control variables the fraction of out-standing equity held by institutions (Institutional Ownership), which we calculate from 13F filings that are included in the CDA/Spectrum database.
Second, several papers document that undervaluation is an important motive for undertaking a repurchase (e.g., Ikenberry, Lakonishok, and Vermaelen (1995), (2000)). It could well be that firms with large shareholder bases are undervalued and therefore repurchase more often. We control for the undervaluation motive by including the book-to-market ratio, the stock performance during the previous year, and the Rhodes-Kropf, Robinson, and Viswanathan (RRV) (2007) measure of misvaluation in our estimations.
Third, since we argue that a small shareholder base creates a wedge between the costs of internal and external funds, our paper is related to the literature on financial constraints. To control for traditional measures of financial constraints, we include the Whited and Wu (2006) index (Whited-Wu) in our regressions.15
Fourth, Barclay and Smith (1988) argue that one reason to avoid undertaking a repurchase is that this may harm stock liquidity. They find that the bid-ask spread widens around repurchase announcements.16 Using detailed buyback data from Hong Kong, Brockman and Chung (2001) find that the bid-ask spread widens and the depth narrows during repurchase periods. However, they also find that the spread and the depth return to benchmark levels once managers disclose that they are the source of the trading.17,18Nevertheless, we control for liquidity by considering the volume of shares traded over the past year divided by the number of shares outstanding (Stock Liquidity).
Fifth, a large shareholder base may indicate that ownership is dispersed and therefore firms with large shareholder bases might be more exposed to agency problems. If large shareholder base firms are more exposed to agency problems,
15In unreported results, we have also included the Kaplan and Zingales (1997) index in our estima-tions without affecting our results qualitatively.
16Miller and McConnell (1995) find no evidence of a widening in bid-ask spread when considering a different sample and methodology.
17Grullon and Ikenberry (2000) find that firms that are actively repurchasing are less sensitive to market movements in a bearish market.
18In a study of U.S. repurchases, Cook, Krigman, and Leach (2004) find that liquidity increases after a repurchase, and they attribute this result to the difference in the disclosure environment between Hong Kong and the United States.
Bodnaruk and Östberg 737
we would expect them to pay out less to investors. To control for differences in agency costs across firms, we consider the fraction of shares owned by the top 5 company executives (Managerial Ownership). Additionally, we control for differences in incentives provided to executives by including the proportion of total compensation to the management of the firm paid in the form of stock options (Option-Based Compensation). Including this variable in our analysis also ensures that our results are not driven by repurchases that are undertaken to offset stock grants and option exercises by firm managers. These measures are calculated from the Thompson/Reuters Insider Database. A number of studies examine the relation between firm governance and cash holdings (e.g., Dittmar and Mahrt-Smith (2007), Harford, Mansi, and Maxwell (2008)). We therefore in-clude the Gompers, Ishii, and Metrick (2003) governance index (G) as a control variable. We also include Board Size and Board Independence as controls. The board controls as well as the Gompers et al. index are obtained from the Investor Responsibility Research Center (IRRC).
Last, Hovakimian, Opler, and Titman (2001) document that one motive for undertaking a repurchase is to alter the firm’s capital structure. To that end, we include the Debt-to-Equity (DE) ratio when determining the factors that influence the decision of undertaking a repurchase or paying a special dividend.
We provide a detailed description of the variables in the Appendix. B. Excess Shareholder Base
Grullon et al. (2004) note that there is a strong relation between the Number
of Common Shareholders and variables such as Market Capitalization and Age.
In order to ensure that our results are not driven by other firm characteristics that are not directly related to the recognition of the firm, we remove the effect of a number of variables on the Number of Common Shareholders. In all subsequent analysis we use the residuals from this regression, which we call Excess
Share-holder Base (ExShBase), as our measure of the shareShare-holder base.19In a different context, Hong, Kubik, and Stein (2009) estimate a similar regression and use the residuals as a measure of firm visibility.
Table 2 presents our regression results. For each of the 22 years in our sample, we estimate a cross-sectional regression where the dependent variable is the logarithm of the Number of Common Shareholders, and then we report the average of all the estimates. We follow Grullon et al. (2004) and include Age,
Return on Equity, Market Capitalization, 1/Share Price, Stock Liquidity, Past Year Return, and Volatility as explanatory variables. It is important to account
for size, since even though larger firms have more press coverage and larger an-alyst following, which is associated with larger recognition, they also have more shares available to buy. Illiquid stocks might have fewer shareholders due to the large transaction costs associated with trading them and not due to recognition. Therefore, to control for transaction costs we include both 1/Share Price and the volume-based liquidity measure Stock Liquidity. Both Age and Volatility control 19Bodnaruk and ¨Ostberg (2009) document that the residual shareholder base is negatively related to returns.
terms of use, available at https:/www.cambridge.org/core/terms. https://doi.org/10.1017/S0022109013000252
for total risk of the firm. Firms that have performed well recently might have a lot of investors, but this does not necessarily represent a permanent firm charac-teristic. To that end, we include Return on Equity and Past Year Return to control for the effect of recent performance on the shareholder base.20 Certain investors might only invest in “value” or “glamour” stocks, and therefore we include BM into our specifications as a control for firm type.
TABLE 2
Determinants of Shareholder Base
In Table 2, we present the results of a Fama-MacBeth (1973) regression relating the shareholder base to its determinants. The dependent variable is the logarithm of common shareholders of record (CCM data 100). All variables are described in the Appendix. We include trading exchange and industry (SIC2) fixed effects. Standard errors are clustered by industry (SIC2).p-values are in parentheses.
log(Shareholder Base) Estimate p-Value
log(Firm age) 0.40 (0.01) ROE −0.17 (0.01) log(Market cap) 0.63 (0.01) log(BM) 0.23 (0.01) 1/Share price 1.49 (0.01) Stock liquidity 0.01 (0.72)
Past year return −0.07 (0.01)
Volatility 5.01 (0.01)
Exchange dummies Yes
Industry dummies Yes
Clustering SIC2
Adj.R2 0.431
N 22
The regression results are qualitatively similar to what Grullon et al. (2004) find. Large, value, and older firms have more shareholders. Additionally, firms that are cheap to trade (that have a high 1/Share Price) also have more sharehold-ers. Firms with good recent performance (both in terms of Return on Equity and
Past Year Return) have fewer shareholders. Grullon et al. point out that this
find-ing is consistent with the “disposition effect” whereby investors hold on to past losers and sell winners.
We define ExShBase as the residual from this regression and employ it as our measure of recognition throughout the rest of our study. A firm that has a positive
ExShBase (residual) has a larger shareholder base than expected according to its
fundamentals. Using ExShBase instead of Number of Common Shareholders does not alter the direction of the effects that we measure, but in general it reduces the economic magnitude of the effects measured.
For the shareholder base to be related to the cost of external financing, it is important that having a small shareholder base is a persistent characteris-tic. If this is not the case, then a firm with a small shareholder base can just wait until its shareholder base returns to normal levels.
To examine whether the shareholder base is persistent, we split firms into quartiles on the basis of ExShBase. Firms in quartile 4 have the largest shareholder bases, adjusting for their fundamentals. We identify when a firm enters the largest 20Unlike Grullon et al. (2004), we do not include advertising expenditure in our regressions. First, it is likely to be highly related to the recognition that the firms have by individual investors. Second, including a measure of advertising expenditure would result in a tenfold decrease in sample size.
Bodnaruk and Östberg 739
quartile for the first time, and we record which quartile these firms belong to over the subsequent 5-year period.21The results are provided in Table 3. After 5 years, 56.5% of firms originally falling into the quartile with the largest share-holder bases still belong to this quartile. Another 31.1% have migrated to quartile 3, which implies that 87.6% of firms originally in quartile 4 still have a share-holder base that is larger than what is expected according to their fundamentals. The results are similar for firms that have the smallest shareholder bases (quartile 1). After 5 years, 51.9% of quartile 1 firms still belong to quartile 1. In total, 82.8% of quartile 1 firms still belong to quartile 1 or 2 after 5 years. Thus, having a small or large shareholder base seems to be a persistent firm characteristic.
TABLE 3
Persistence of Excess Shareholder Base
In Table 3, we report the results on the persistence of excess shareholder base for firms that are selected when they enter the highest (lowest) quartile of excess shareholder base for the first time. Excess shareholder base is the residual of the regression reported in Table 2. Firms are followed for 5 years to determine which quartile they belong in the subsequent year. Quartile 4 represents the highest excess shareholder base quartile, and Year 0 is the measurement year. Numbers shown are percentages. The number of firms is in square brackets. We require companies to have nonmissing excess shareholder base for the years –1 to +5 relative to the measurement year.
Quartile
Year 4 3 2 1
Panel A. Persistence of Excess Shareholder Base for Firms That Are in the Highest Quartile of Excess Shareholder Base in Year 0 0 1.00 [563] 1 0.68 0.29 0.02 0.01 [383] [162] [13] [5] 2 0.61 0.32 0.05 0.02 [346] [179] [27] [11] 3 0.57 0.34 0.06 0.03 [322] [192] [32] [17] 4 0.58 0.32 0.07 0.03 [326] [179] [38] [20] 5 0.57 0.31 0.08 0.04 [318] [175] [45] [25]
Panel B. Persistence of Excess Shareholder Base for Firms That Are in the Lowest Quartile of Excess Shareholder Base in Year 0 0 1.00 [592] 1 0.02 0.03 0.30 0.65 [12] [17] [179] [384] 2 0.04 0.05 0.34 0.57 [24] [31] [199] [338] 3 0.04 0.07 0.30 0.59 [23] [43] [177] [349] 4 0.06 0.08 0.31 0.55 [34] [45] [186] [327] 5 0.06 0.11 0.31 0.52 [37] [65] [183] [307]
21We restrict our analysis to firms with at least 5 years of uninterrupted values of ExShBase fol-lowing entering the highest (lowest) quartile of ExShBase. This restriction does not affect our results in any significant way.
terms of use, available at https:/www.cambridge.org/core/terms. https://doi.org/10.1017/S0022109013000252
IV.
Results
A. The Shareholder Base and Payout
Firms with negative values of ExShBase have smaller shareholder bases than implied by their fundamental characteristics. Following Hypothesis 1, we expect these firms to have high costs of external financing and therefore to pay out less. In Panel A of Table 4 we provide univariate evidence on the relation between
ExShBase and Total Payout. Companies with negative values of ExShBase pay
out on average 2.21%, while firms with positive values pay out on average 2.59% (or 17.19% more) of their total assets. Additionally, when we only consider firms with positive values of Total Payout, small shareholder base firms pay out on average 3.50% and large shareholder base firms pay out 3.89% (or 11.14% more) of their total assets. These differences are statistically significant at the 1% level.
In Panel B of Table 4 we restrict the Total Payout to be between 0%–100% of net income. This selection reduces the average payout significantly. Firms with positive values of ExShBase pay out 1.55% of total assets, whereas firms with negative values pay out 1.41% (positive ExShBase firms payout 9.93% more). The difference is statistically significant.
Panel C of Table 4 reports the results from our multivariate analysis with Total Payout as the dependent variable. Specifications 1 and 2 are
TABLE 4
Shareholder Base and Total Payout
In Table 4, we investigate the relation between the excess shareholder base and total payout. We utilize the residuals from the regression reported in Table 2 as our measure of the shareholder base. The dependent variable is next year total payout, defined as the sum of dividends and repurchases divided by total assets. All variables are described in the Appendix. Panel A reports the results of univariate analysis both for the full sample and for the sample of companies with positive total payout. In Panel B we report the results of univariate analysis restricting total payout to be within 0% and 100% of net income. Panel C reports the results of Tobit regressions. Specifications 1 and 2 are Fama-MacBeth (1973) regressions with industry fixed effects. For each year we estimate a Tobit regression with Total Payout as a dependent variable. We report average regression coefficients. The reportedp-values (in parentheses) are based on Newey-West (1987) (2 lags) corrected standard errors of the estimated average regression coefficients. Specifications 3–7 are panel regressions with industry (SIC2) and time fixed effects with standard errors clustered at industry level. All estimates are multiplied by 100. Panel A. Univariate Analysis: All Payouts
Total Payout Total Payout (> 0)
Excess Shareholder Base N Mean Median N Mean Median
High (positive) 26,506 2.59% 0.91% 17,688 3.89% 2.20%
Low (negative) 26,173 2.21% 0.64% 16,506 3.50% 1.91%
t-Stat/ Wilcoxon/ t-Stat/ Wilcoxon/
p-Value p-Value p-Value p-Value
10.16 12.09 7.23 8.69
(0.01) (0.01) (0.01) (0.01)
Panel B. Univariate Analysis: Payout between 0% and 100% of Net Income
Total Payout Total Payout (> 0)
Excess Shareholder Base N Mean Median N Mean Median
High (positive) 20,580 1.55% 0.38% 11,763 2.70% 1.86%
Low (negative) 21,578 1.41% 0.25% 11,914 2.56% 1.69%
t-Stat/ Wilcoxon/ t-Stat/ Wilcoxon/
p-Value p-Value p-Value p-Value
5.27 5.97 3.75 5.35
(0.01) (0.01) (0.01) (0.01)
Bodnaruk
and
Östberg
741
TABLE 4 (continued) Shareholder Base and Total Payout
Panel C. Multivariate Regressions
Fama-MacBeth Pooled Panel
1 2 3 4 5 6 7
Total Payout Estimate p-Value Estimate p-Value Estimate p-Value Estimate p-Value Estimate p-Value Estimate p-Value Estimate p-Value ExShBase 0.29 (0.01) 0.43 (0.01) 0.43 (0.01) 0.31 (0.01) 0.20 (0.05)
ExShBase2 −0.13 (0.01)
× Need external financing 0.18 (0.01) 0.28 (0.01)
× No need external financing 0.34 (0.01) 0.50 (0.01)
log(Market cap) 0.15 (0.01) 0.14 (0.01) 0.49 (0.01) 0.50 (0.01) 0.49 (0.01) 0.04 (0.70) 0.42 (0.01) log(BM) −1.14 (0.01) −1.14 (0.01) −0.75 (0.01) −0.75 (0.01) −0.75 (0.01) −1.47 (0.01) −2.24 (0.01) DE −0.32 (0.01) −0.32 (0.01) −0.36 (0.01) −0.36 (0.01) −0.36 (0.01) −0.28 (0.01) −0.42 (0.01) PE −0.00 (0.01) −0.00 (0.01) −0.00 (0.01) −0.00 (0.01) −0.00 (0.01) −0.00 (0.01) −0.00 (0.01) Operating income 7.75 (0.01) 7.76 (0.01) 13.73 (0.01) 13.71 (0.01) 13.82 (0.01) 11.36 (0.01) 24.33 (0.01) R&D 0.89 (0.01) 0.89 (0.01) 0.92 (0.01) 0.92 (0.01) 0.92 (0.01) 0.85 (0.01) 4.86 (0.01) Cash 1.38 (0.01) 1.37 (0.01) 2.11 (0.01) 2.13 (0.01) 2.11 (0.01) 2.43 (0.01) 4.03 (0.01) Past year return −0.95 (0.01) −0.95 (0.01) −1.28 (0.01) −1.29 (0.01) −1.28 (0.01) −1.36 (0.01) −1.91 (0.01) Volatility −16.73 (0.01) 16.80 (0.01) −57.09 (0.01) −56.32 (0.01) −57.16 (0.01) −45.21 (0.01) −94.36 (0.01) Capex −4.76 (0.01) −4.76 (0.01) −8.38 (0.01) −8.43 (0.01) −8.37 (0.01) −10.05 (0.01) −19.03 (0.01) Institutional ownership 0.20 (0.41) 0.19 (0.44) 0.37 (0.37) 0.28 (0.62) 0.36 (0.38) 0.63 (0.08) −1.32 (0.01) Industry concentration −1.94 (0.31) −1.52 (0.42) −0.08 (0.95) −0.02 (0.99) −0.01 (0.94) −0.10 (0.50) −0.98 (0.68) Stock liquidity −0.40 (0.01) −0.40 (0.01) −0.64 (0.01) −0.62 (0.01) −0.64 (0.01) −0.55 (0.01) −0.41 (0.01) Misvaluation (RRV) −1.28 (0.01) −0.35 (0.30) Whited-Wu index −12.53 (0.01) −11.36 (0.01) Managerial ownership −8.39 (0.01) OBC 0.37 (0.47) Board independence 0.37 (0.46) Board size 0.77 (0.06) G-index 0.00 (0.99)
Industry dummies Yes Yes Yes Yes Yes Yes Yes
Time dummies Yes Yes Yes Yes Yes
Clustering SIC2 SIC2 SIC2 SIC2 SIC2
Adj.R2 0.189 0.191 0.189 0.238 0.229
N 21 21 52,679 52,679 52,679 38,492 5,876
terms of use, available at
https:/www.cambridge.org/core/terms
.
https://doi.org/10.1017/S0022109013000252
Downloaded from
https:/www.cambridge.org/core
. University of Basel Library
, on
30 May 2017 at 13:49:33
Fama-MacBeth (1973) regressions with industry fixed effects. For each year we estimate a Tobit regression with Total Payout as a dependent variable. We report average regression coefficients. The reported p-values (in parentheses) are based on Newey-West (1987) (2 lags) corrected standard errors of the estimated average regressions coefficients.
The rest of the specifications are pooled panel Tobit regressions with time and industry fixed effects with standard errors that are clustered at industry (SIC2) level. Neyman and Scott (1948) document that maximum likelihood estimation with fixed effects results in an “incidental parameter problem.” In a recent contri-bution Greene (2004a) documents that in Tobit regressions the incidental param-eter problem is small when T is 5. Given that in our case T is equal to 21, and that univariate and Fama-MacBeth (1973) results corroborate our Tobit results, we are comfortable that our results are not driven by econometric errors.22
Specification 3 includes ExShBase2in order to capture nonlinearities in the relation between the shareholder base and payout. In all of our specifications
ExShBase is significantly positively related to Total Payout.
In terms of relative economic impact, considering specification 3 the impact of ExShBase is roughly 53% the impact of Market Capitalization and 82% the impact of BM. Specification 6 illustrates that the impact of the shareholder base on payout is greater than that of governance variables like Board Size, Board
Independence, and G-index.
In specification 4, going from the 25th to the 50th percentile of ExShBase increases Total Payout by 0.39%. However, going from the 50th to the 75th per-centile of ExShBase only increases Total Payout by 0.24%. This indicates that the relation between the shareholder base and payout is stronger the smaller the shareholder base is and is consistent with the hypothesis that financial constraints are more binding for firms with smaller shareholder bases.
Arguably, the relation between the shareholder base and payout should be attenuated for firms that have a need for external financing. Fazzari, Hubbard, and Petersen (1988) demonstrate that firms in need of external financing will not pay out any dividend regardless of their degree of financial constraints. Intuitively, a firm that has a need for financing will invest its earnings rather than retain the earnings or distribute them to shareholders irrespective of the size of the share-holder base.
To test this, we estimate the need for external financing as done by Demirg¨uc¸-Kunt and Maksimovic (1998) and Durnev and Kim (2005). We define the external financing need as the difference between the firm’s actual growth rate and the sustainable growth rate. We estimate the actual growth rate as the prior 2-year ge-ometric average of annual growth rate in total assets. We estimate the sustainable growth rate as the 2-year average of ROEt/(1 − ROEt), where ROEt is the firm
return on equity in year t.
We define a dummy variable, Need External Financing, that takes the value of 1 if the growth of total assets is greater than the sustainable growth rate (ROEt/ 22Greene (2004b) documents that the incidental parameter problem is larger for probit regressions (which we use in Section IV.E). However, he benchmarks the fixed effect, pooled, and random ef-fect estimators in a probit setting and concludes (p. 111), “It seems likely based on this and all the preceding results that for T larger than 8, the results will probably favour the fixed-effects estimator.”
Bodnaruk and Östberg 743
(1 − ROEt)) and 0 otherwise.23 In our sample 32.67% of firms are in need of
external financing. Specifications 2 and 5 interact our variable ExShBase with the dummy variable Need External Financing and its complement. In both specifica-tions we find that the effect of the shareholder base is significantly larger for firms that do not need external financing.
Turning to the control variables, as expected, variables that capture the amount of funds available to the firm, such as Cash and Operating Income, are positively related to the payout level. Additionally, variables that capture outflows from the firm, such as the DE ratio and Capex, are negatively related to payout, il-lustrating that there is a trade-off in the use of funds. Companies with higher return volatility and overvalued companies seem to have lower payout levels. Addition-ally, firms that are more financially constrained according to the Whited-Wu index pay out less. The inclusion of the Whited-Wu index, Institutional Ownership, and
Industry Concentration does not affect our results in any significant way. Also,
the inclusion of corporate governance variables G-index, Board Size, and Board
Independence does not affect our conclusion that the shareholder base is
posi-tively related to Total Payout. Overall, these results support the hypothesis that the shareholder base is positively and statistically significantly related to payout. B. The Shareholder Base and Cash Holdings
Panel A of Table 5 presents univariate results of the relation between
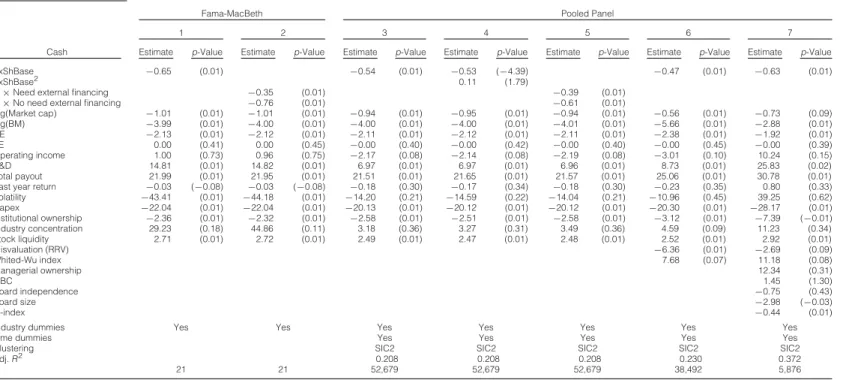
ExSh-Base and Cash. Companies with small shareholder bases (negative ExShExSh-Base) TABLE 5
Shareholder Base and Cash Holdings
In Table 5, we investigate the relation between the excess shareholder base and cash holdings. We utilize the residuals from the regression reported in Table 2 as our measure of the shareholder base. The dependent variable is cash holdings at the end of the next fiscal year divided by total assets net of cash. All variables are described in the Appendix. In Panel A we report the results of univariate analysis. Panel B reports multivariate regression results. Specifications 1 and 2 are Fama-MacBeth (1973) regressions with industry fixed effects. For each year we estimate an ordinary least squares (OLS) regression withCashas a dependent variable. We report average regression coefficients. The reportedp-values (in parentheses) are based on Newey-West (1987) (2 lags) corrected standard errors of the estimated average regression coefficients. Specifications 3–7 are panel regressions with industry (SIC2) and time fixed effects with standard errors clustered at industry level. All estimates are multiplied by 100.
Panel A. Univariate Analysis
Cash Holdings
ExShBase N Mean Median
High (positive) 28,058 12.76% 5.39%
Low (negative) 27,891 16.48% 7.02%
t-Stat/p-Value Wilcoxon/p-Value
14.04 13.92
(0.01) (0.01)
(continued on next page)
23We choose ROE
t/(1 − ROEt) rather than ROLTCt/(1 − ROLTCt) (where ROLTC is the return on long-term capital) or(ROAt× bt)/(1 − ROAt× bt) (where ROA is the return on assets and b is the fraction of earnings retained for investment) since we are interested in the relation between the need for financing and payout to equity holders. See Demirg¨uc¸-Kunt and Maksimovic (1998) for a lengthier description of the alternative measures of the need for financing.
terms of use, available at https:/www.cambridge.org/core/terms. https://doi.org/10.1017/S0022109013000252
744 Journal of Financial and Quantitative Analysis TABLE 5 (continued) Shareholder Base and Cash Holdings
Panel B. Multivariate Regressions
Fama-MacBeth Pooled Panel
1 2 3 4 5 6 7
Cash Estimate p-Value Estimate p-Value Estimate p-Value Estimate p-Value Estimate p-Value Estimate p-Value Estimate p-Value ExShBase −0.65 (0.01) −0.54 (0.01) −0.53 (−4.39) −0.47 (0.01) −0.63 (0.01)
ExShBase2 0.11 (1.79)
× Need external financing −0.35 (0.01) −0.39 (0.01)
× No need external financing −0.76 (0.01) −0.61 (0.01)
log(Market cap) −1.01 (0.01) −1.01 (0.01) −0.94 (0.01) −0.95 (0.01) −0.94 (0.01) −0.56 (0.01) −0.73 (0.09) log(BM) −3.99 (0.01) −4.00 (0.01) −4.00 (0.01) −4.00 (0.01) −4.01 (0.01) −5.66 (0.01) −2.88 (0.01) DE −2.13 (0.01) −2.12 (0.01) −2.11 (0.01) −2.12 (0.01) −2.11 (0.01) −2.38 (0.01) −1.92 (0.01) PE 0.00 (0.41) 0.00 (0.45) −0.00 (0.40) −0.00 (0.42) −0.00 (0.40) −0.00 (0.45) −0.00 (0.39) Operating income 1.00 (0.73) 0.96 (0.75) −2.17 (0.08) −2.14 (0.08) −2.19 (0.08) −3.01 (0.10) 10.24 (0.15) R&D 14.81 (0.01) 14.82 (0.01) 6.97 (0.01) 6.97 (0.01) 6.96 (0.01) 8.73 (0.01) 25.83 (0.02) Total payout 21.99 (0.01) 21.95 (0.01) 21.51 (0.01) 21.65 (0.01) 21.57 (0.01) 25.06 (0.01) 30.78 (0.01) Past year return −0.03 (−0.08) −0.03 (−0.08) −0.18 (0.30) −0.17 (0.34) −0.18 (0.30) −0.23 (0.35) 0.80 (0.33) Volatility −43.41 (0.01) −44.18 (0.01) −14.20 (0.21) −14.59 (0.22) −14.04 (0.21) −10.96 (0.45) 39.25 (0.62) Capex −22.04 (0.01) −22.04 (0.01) −20.13 (0.01) −20.12 (0.01) −20.12 (0.01) −20.30 (0.01) −28.17 (0.01) Institutional ownership −2.36 (0.01) −2.32 (0.01) −2.58 (0.01) −2.51 (0.01) −2.58 (0.01) −3.12 (0.01) −7.39 (−0.01) Industry concentration 29.23 (0.18) 44.86 (0.11) 3.18 (0.36) 3.27 (0.31) 3.49 (0.36) 4.59 (0.09) 11.23 (0.34) Stock liquidity 2.71 (0.01) 2.72 (0.01) 2.49 (0.01) 2.47 (0.01) 2.48 (0.01) 2.52 (0.01) 2.92 (0.01) Misvaluation (RRV) −6.36 (0.01) −2.69 (0.09) Whited-Wu index 7.68 (0.07) 11.18 (0.08) Managerial ownership 12.34 (0.31) OBC 1.45 (1.30) Board independence −0.75 (0.43) Board size −2.98 (−0.03) G-index −0.44 (0.01)
Industry dummies Yes Yes Yes Yes Yes Yes Yes
Time dummies Yes Yes Yes Yes Yes
Clustering SIC2 SIC2 SIC2 SIC2 SIC2
Adj.R2 0.208 0.208 0.208 0.230 0.372 N 21 21 52,679 52,679 52,679 38,492 5,876 https:/www.cambridge.org/core/terms . https://doi.org/10.1017/S0022109013000252 https:/www.cambridge.org/core
. University of Basel Library
, on
30 May 2017 at 13:49:33
Bodnaruk and Östberg 745
on average have a ratio of cash to total assets of 16.48%, while firms with large shareholder bases (positive ExShBase) maintain average cash holdings of 12.76% of total assets (or 29.95% less). The difference is statistically significant at the 1% level. The effect is similar in economic magnitude and statistically significant when we consider median cash holdings.
Panel B of Table 5 displays our regression analysis. Specifications 1 and 2 are cross-sectional Fama-MacBeth (1973) regression, while the other specifica-tions are pooled panel regressions. The coefficient of ExShBase is negative and statistically significant in all specifications, indicating that the shareholder base is negatively related to cash holdings. Inspecting specification 4 that includes a squared term, ExShBase2, we see that going from the 25th to the 75th percentile in terms of ExShBase decreases Cash by 0.75%, which represents 5.26% of the unconditional mean. However, going from the 25th to the 50th percentile of
ExSh-Base decreases Cash by 0.45%, and going from the 50th to the 75th percentile of ExShBase only decreases Cash by 0.30%. Therefore, just as with Total Payout, the
relation between the ExShBase and Cash is nonlinear. The relation is stronger for firms with small shareholder bases. The economic magnitude of the shareholder base is similar across all of our specifications.
The relative impact of the shareholder base on Cash is economically sig-nificant. Considering specification 3, the impact of ExShBase is roughly 35% the impact of Market Capitalization and 19% the impact of BM. Specification 6 illustrates that the impact of the shareholder base on Cash is 84% of G-index, but 2.7 times larger than the impact of Board Size.
Like in the payout case, we investigate whether the need for external financing attenuates the impact of the shareholder base. Specifications 2 and 5 document that the slope coefficient is significantly lower for those firms that have a need for external financing, indicating that for firms that have no surplus earnings to retain, the effect of the shareholder base on cash is weakened.
Concerning the control variables, we find that larger firms have lower Cash ratios. Since large firms consist of more projects that have less than perfectly cor-related cash needs, it makes sense that larger firms maintain smaller cash-to-asset levels. Likewise, value firms (high BM ratio) have lower cash holdings. The lower cash holdings of large firms and firms with high BM ratios has also been docu-mented by Opler et al. (1999) and Dittmar, Mahrt-Smith, and Servaes (2003). Additionally, firms with high levels of Capex have lower Cash ratios. Variables that are related to the amount of cash that is disgorged to investors, such as
Insti-tutional Ownership and DE level, are also associated with lower cash holdings.
Finally, firms that are more financially constrained according to the Whited-Wu index have larger cash holdings.
C. Decimalization, the Shareholder Base, and Payout
So far, we document that there is a relation between the shareholder base, payout, and cash. However, this does not establish that having a large shareholder base leads to higher payout levels and lower cash retention. It could equally well be that the firm’s payout and cash policies attract a larger shareholder base. terms of use, available at https:/www.cambridge.org/core/terms. https://doi.org/10.1017/S0022109013000252
To establish a causal link, we need an exogenous shock that affects the share-holder base but does not alter the firm’s operations and thereby has no direct effect on payout policy or cash holdings. The introduction of decimal quotes on the NYSE, NASDAQ, and AMEX in the middle of 2000 to the end of April 2001 sig-nificantly lowered the transaction costs associated with trading stocks and thereby increased investor demand and therefore also the size of the shareholder base.24 This effectively alters the demand for the firm’s stock without directly affecting the firm’s investment opportunity set. Despite the market collapsing in early to mid 2001, the average firm’s shareholder base increased by 2.56% between the end of 1999 and the end of 2001. Fang, Noe, and Tice (2009) use decimalization to establish a causal link between liquidity and firm performance.25In an earlier contribution, Amihud et al. (1999) consider a very similar experiment. They ex-amine the effect of a reduction in the minimum trading lot in Japan and find that this institutional change is associated with an increase in the shareholder base, liquidity, and stock price.
Like Fang et al. (2009), we consider the change in our dependent variables (Total Payout and Cash) 1 year prior to the event to 1 year after the event. We choose this event window since each market shifted some stocks to decimal trad-ing at earlier dates.26 Our main independent variable is the change in the share-holder base. As a control variable we include ΔEffective Relative Spread to capture the impact of changes in liquidity on payout and cash holdings.27 Addi-tionally, in case decimalization affected the relative incentives of retail investors and institutional investors to hold shares, we have included the change in
Institu-tional Ownership (measured as the change in the fraction of outstanding equity
held by institutional investors) as a control variable. The correlations between Δlog #Shareholders, ΔInstitutional Ownership, and ΔEffective Relative Spread are all below 10% in absolute terms.
Panel A of Table 6 presents our results when we consider the change in
Total Payout as the dependent variable. The main independent variable in
speci-fication 1, the change in the log of the number of shareholders, is positively and statistically significantly (at the 1% level) related toΔTotal Payout. In terms of economic significance, a 1-standard-deviation larger change in the log of number of shareholders leads to a 0.25% larger increase in ΔTotal Payout. This should be compared to mean change in Total Payout of−0.89% over our observation 24On Jan. 29, 2001, NYSE and AMEX switched to decimal quotes while NASDAQ switched on Apr. 9.
25Both Bessembinder (2003) and Furfine (2003) have documented that decimalization had a sig-nificant impact on transaction costs. They also find that the gain is restricted to those stocks that are actively traded.
26Bessembinder (2003) notes that roughly 150 stocks on NYSE were introduced at various dates to decimal trading prior to Jan. 29, 2001. Likewise, roughly 200 stocks on NASDAQ were shifted to decimal trading on 2 dates prior to Apr. 9.
27We use the Effective Relative Spread as opposed to Stock Liquidity, which we use in the rest of the paper, for two reasons. First, we want to make sure that our results are comparable to those of Fang et al. (2009). Second, Stock Liquidity requires the data from the previous year, which would mean having data for the numerator from after the event and data for the denominator from before the event. Nonetheless, our results are not qualitatively altered depending on our choice of liquidity definition.We are grateful to Shane Corwin for sharing with us data on Relative Spreads estimated from TAQ.
Bodnaruk
and
Östberg
747
TABLE 6
Decimalization, Shareholder Base, and Payout
In Table 6, we relate changes in the shareholder base to changes in total payout and cash holdings around the introduction of decimal trading quotes on NYSE, AMEX, and NASDAQ in 2000/2001 (decimalization). Following Fang et al. (2009), changes in all variables are calculated as the difference between the value of the variable at the end of 2001 and at the end of 1999. Panel A reports the effect of changes in the shareholder base on changes in total payout. We consider both the full sample of companies as well as only the companies that had a positive total payout in 1999. Panel B investigates the impact of changes in the shareholder base around decimalization on changes in cash holdings.Relative effective spreadis the trade-weighted average of bid-ask spread adjusted by the midpoint of bid-ask range.Total assetsis the book value of company total assets (Compustat data 6).Residual volatilityis 4-factor-adjusted volatility of company stock returns estimated over a 1-year window from daily data and expressed in yearly terms. All other variables are described in the Appendix. We utilize industry fixed effects. Standard errors are clustered at industry level. All estimates are multiplied by 100.p-values are in parentheses.
Panel A. Change in Shareholder Base and Change in Total Payout
Full Sample If Positive Payout in 1999
1 2 3 4 5 6 7 8
Change in Total Payout Estimate p-Value Estimate p-Value Estimate p-Value Estimate p-Value Estimate p-Value Estimate p-Value Estimate p-Value Estimate p-Value
Δlog(#Shareholders) 0.26 (0.00) 0.37 (0.00) × Price $5–$10 0.38 (0.00) 0.60 (0.06) × Price > $10 0.21 (0.00) 0.36 (0.02) ΔExShBase 0.54 (0.00) 0.66 (0.01) × Price $5–$10 0.73 (0.00) 0.82 (0.01) × Price > $10 0.48 (0.00) 0.62 (0.03) ΔInstitut. ownership 0.15 (0.90) 0.13 (0.91) 0.72 (0.64) 0.69 (0.66) −1.18 (0.50) −1.18 (0.50) −1.13 (0.53) −1.13 (0.52) ΔRelative eff. spread −5.60 (0.29) −4.46 (0.29) −5.28 (0.58) −5.34 (0.58) −13.74 (0.17) −14.01 (0.16) −10.43 (0.26) −10.48 (0.25) Δlog(Total assets) −0.75 (0.01) −0.74 (0.01) −1.20 (0.00) −1.19 (0.00) −1.68 (0.00) −1.68 (0.00) −2.91 (0.00) −2.92 (0.00) ΔResidual volatility −7.95 (0.10) −3.63 (0.11) −17.02 (0.38) −17.56 (0.38) −31.37 (0.00) −30.35 (0.00) −24.67 (0.32) −24.77 (0.31) ΔPast year return −0.52 (0.00) −0.59 (0.00) −0.67 (0.00) −0.68 (0.00) −0.58 (0.01) −0.57 (0.01) −0.75 (0.00) −0.76 (0.00)
Industry fixed effects Yes Yes Yes Yes Yes Yes Yes Yes
Clustering SIC2 SIC2 SIC2 SIC2 SIC2 SIC2 SIC2 SIC2
N 2,724 2,724 1,913 1,913 1,726 1,726 1,779 1,396
Adj.R2 0.023 0.024 0.030 0.030 0.036 0.037 0.055 0.055
(continued on next page)
terms of use, available at
https:/www.cambridge.org/core/terms
.
https://doi.org/10.1017/S0022109013000252
Downloaded from
https:/www.cambridge.org/core
. University of Basel Library
, on
30 May 2017 at 13:49:33
TABLE 6 (continued)
Decimalization, Shareholder Base, and Payout Panel B. Change in Shareholder Base and Change in Cash Holdings
1 2 3 4
Change in Cash Estimate p-Value Estimate p-Value Estimate p-Value Estimate p-Value Δlog(#Shareholders) −0.89 (0.06) × Price $5–$10 −1.11 (0.04) × Price > 10 −0.54 (0.29) ΔExShBase −1.05 (0.03) × Price $5–$10 −1.60 (0.05) × Price > $10 −0.85 (0.04) ΔInstitut. ownership 10.98 (0.00) 10.88 (0.00) 13.08 (0.01) 13.18 (0.01) ΔRelative eff. spread 22.00 (0.06) 22.49 (0.06) 27.47 (0.34) 27.48 (0.34) Δlog(Total assets) 10.77 (0.00) 10.80 (0.00) 11.12 (0.00) 11.10 (0.00) ΔResidual volatility −49.06 (0.06) −49.63 (0.06) −74.45 (0.37) −72.88 (0.38) ΔPast year return 1.64 (0.07) 1.64 (0.05) 1.00 (0.29) 1.01 (0.29)
Industry fixed effects Yes Yes Yes Yes
Clustering SIC2 SIC2 SIC2 SIC2
N 2,724 2,724 1,913 1,913
Adj.R2 0.1284 0.1281 0.1197 0.1194
period. Specification 3 is identical to specification 1 except that we consider the ΔExShBase as the main independent variable. A 1-standard-deviation increase inΔExShBase leads to an increase in ΔTotal Payout of 0.40%, and the effect is statistically significant at the 1% level.
We consider the same control variables as Fang et al. (2009) with the ex-ception of the Standard & Poor’s (S&P) 500 dummy variable that is insignificant in all of their specifications. Interestingly, the change in institutional ownership is never statistically significantly related to the change in Total Payout and the sign of the coefficient changes depending on whether we consider only firms with positive payout.
An equal decline in transaction costs across stocks implies a larger relative impact on stocks with low prices. Therefore it is likely that decimalization was a larger event for low price stocks. To investigate this conjecture we introduce 2 dummy variables: Low Price (High Price), which takes the value 1 if the price is between $5 and $10 (above $10), and 0 otherwise. In our sample, 36.72% of stocks were in the $5–$10 price range at the end of 1999. In specifications 2 and 4 we interact our measure of the shareholder base with dummy variables for the stock price level to examine whether the strength of the relation differs across stock price levels. As expected, in both specifications the economic effect is substantially larger for low price stocks.
To make sure that our results are not in some way influenced by nonpaying firms, we consider only firms that have positive payout levels in the beginning of 1999 in specifications 5–8. Specifications 5 and 6 have as main independent variable the change in the log of the number of shareholders, while specifications 7 and 8 considerΔExShBase. The significance levels and economic impact are very similar to specifications 1–4.
In Panel B of Table 6 we consider ΔCash as dependent variable. Like in Panel A, we consider the change in the log of the number of shareholders in spec-ifications 1 and 2, while specspec-ifications 3 and 4 use ΔExShBase as the main independent variable. In both specifications our proxy for the change in the
share-Bodnaruk and Östberg 749
holder base is negatively related to the change in cash holdings (ΔCash), and the relation is statistically significant at the 1% level. In specification 1, a 1-standard-deviation increase in the change in the number of shareholders results in a reduction of cash holdings of 1.61%. The corresponding impact in specification 3 ofΔExShBase on the change in cash holdings is a reduction of 3.26%. These numbers should be compared to the unconditional mean change in cash holdings of−2.25%. Specifications 2 and 4 interact our dummy variables
Low Price and High Price with our measures of the shareholder base. Similarly
to when we considered payout, the relation between changes in the shareholder base andΔCash is significantly stronger for low price stocks for which decimal-ization was a larger event. Additionally, we find that firms that experience positive changes in Institutional Ownership, Total Assets, and Past Year Return also have positive changes in cash levels. In both panels of Table 6, we include industry fixed effects and cluster standard errors on the industry level.
The results of these panels indicate that when there is an exogenous drop in the transaction costs associated with trading in stocks, firms experience an in-crease in the shareholder base. This relation has been documented by Amihud et al. (1999), who find that reducing trading costs results in an increase in the share-holder base, liquidity, and stock price. We build on this by showing that there is a relation between the increase in the shareholder base and how payout and cash holdings change. A larger change in the shareholder base results in a larger positive change in payout and a smaller change in cash holdings. Both of these results are indicative of the cost of external financing being related to the size of the shareholder base.
Although no event is a perfect natural experiment, we believe that decimal-ization has a number of advantages over other events such as the Jobs and Growth Tax Relief Reconciliation Act of 2003 and state-level tax changes. By altering the relative tax treatment of repurchases and dividend, the Jobs and Growth Tax Relief Reconciliation Act of 2003 altered the incentives for the 2 payout meth-ods. Therefore, this event has implications for clientele effects. State-level tax changes are often endogenous to the performance of firms within the state. So, an increase in state-level taxes might be motivated by low tax revenues from state firms, which then coincide with low firm payouts. In this setting, it would be hard to argue that the lower payout is driven by a reduction in the shareholder base due to an increase in taxes rather than poor firm performance. The advantage with decimalization as an event is that it is most likely unrelated to firm performance.
D. Repurchases and the Shareholder Base
In this section we investigate Hypothesis 2: whether a repurchase reduces the size of the shareholder base. To argue that maintaining the size of the shareholder base is an important consideration when choosing the method of payout, we need to verify that undertaking a share repurchase and paying special dividends affects the shareholder base differently. In particular, for special dividends to have an advantage over repurchases we should observe that the latter reduces the share-holder base (and thus increases the cost of external financing), while the former terms of use, available at https:/www.cambridge.org/core/terms. https://doi.org/10.1017/S0022109013000252
does not. Therefore, we examine the effect of repurchases and special dividends on the size of the shareholder base.
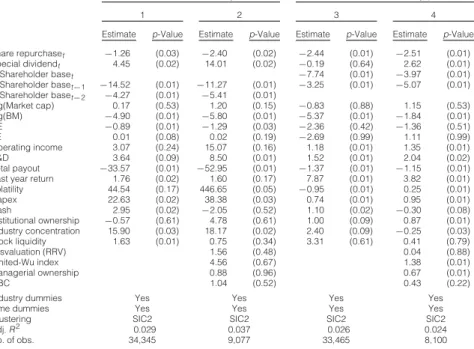
Table 7 presents the results from pooled panel regressions. Our dependent variable is the change in the logarithm of the number of common shareholders (ΔShBase) in year t (and t + 1), where t is the year when the special distribution is made. We present results in terms of changes in the number of common share-holders to facilitate interpretation, but the results in terms of changes in ExShBase are qualitatively equivalent.28Our main variables of interest are Share Repurchase and Special Dividend. Share Repurchase is a dummy variable that takes the value of 1 if the firm has repurchased at least 1% of its outstanding stock in year t.
Special Dividend is a dummy variable that takes the value of 1 if the firm
under-takes a special dividend in year t. We find that undertaking a repurchase leads to a decline in the shareholder base over years t and t + 1. Undertaking a repurchase in year t leads to a reduction in the shareholder base in year t of between 1.26% and 2.41%. This reduction continues in year t + 1, so over 2 years (t and t + 1)
TABLE 7
The Effect of Share Repurchases and Special Dividends on Shareholder Base In Table 7, we present the results of the effect of share repurchases and special dividends on the shareholder base in the year when the special distribution is undertaken and in the subsequent year. The change in shareholder base in yeart is calculated as the difference in the logarithm of the number of common shareholders of record at the end of yeartand yeart− 1. The dependent variable is the change in shareholder base at yeart(t+ 1), where yeartis a year when a special distribution is made. All variables are described in the Appendix. All estimates are multiplied by 100.p-values are in parentheses.
ΔShareholder Baset ΔShareholder Baset+1
1 2 3 4
Estimate p-Value Estimate p-Value Estimate p-Value Estimate p-Value Share repurchaset −1.26 (0.03) −2.40 (0.02) −2.44 (0.01) −2.51 (0.01) Special dividendt 4.45 (0.02) 14.01 (0.02) −0.19 (0.64) 2.62 (0.01) ΔShareholder baset −7.74 (0.01) −3.97 (0.01) ΔShareholder baset−1 −14.52 (0.01) −11.27 (0.01) −3.25 (0.01) −5.07 (0.01) ΔShareholder baset−2 −4.27 (0.01) −5.41 (0.01) log(Market cap) 0.17 (0.53) 1.20 (0.15) −0.83 (0.88) 1.15 (0.53) log(BM) −4.90 (0.01) −5.80 (0.01) −5.37 (0.01) −1.84 (0.01) DE −0.89 (0.01) −1.29 (0.03) −2.36 (0.42) −1.36 (0.51) PE 0.01 (0.08) 0.02 (0.19) −2.69 (0.99) 1.11 (0.99) Operating income 3.07 (0.24) 15.07 (0.16) 1.18 (0.01) 1.35 (0.01) R&D 3.64 (0.09) 8.50 (0.01) 1.52 (0.01) 2.04 (0.02) Total payout −33.57 (0.01) −52.95 (0.01) −1.37 (0.01) −1.15 (0.01) Past year return 1.76 (0.02) 1.60 (0.17) 7.87 (0.01) 3.82 (0.01)
Volatility 44.54 (0.17) 446.65 (0.05) −0.95 (0.01) 0.25 (0.01) Capex 22.63 (0.02) 38.38 (0.03) 0.74 (0.01) 0.95 (0.01) Cash 2.95 (0.02) −2.05 (0.52) 1.10 (0.02) −0.30 (0.08) Institutional ownership −0.57 (0.61) 4.78 (0.61) 1.00 (0.09) 0.87 (0.01) Industry concentration 15.90 (0.03) 18.17 (0.02) 2.40 (0.09) −0.25 (0.03) Stock liquidity 1.63 (0.01) 0.75 (0.34) 3.31 (0.61) 0.41 (0.79) Misvaluation (RRV) 1.56 (0.48) 0.04 (0.88) Whited-Wu index 4.56 (0.67) 1.38 (0.01) Managerial ownership 0.88 (0.96) 0.67 (0.01) OBC 1.04 (0.52) 0.43 (0.22)
Industry dummies Yes Yes Yes Yes
Time dummies Yes Yes Yes Yes
Clustering SIC2 SIC2 SIC2 SIC2
Adj.R2 0.029 0.037 0.026 0.024
No. of obs. 34,345 9,077 33,465 8,100