Cross-Country Study on the Promotion of
New
Pharmaceutical Products
Jayeeta
Kundu
Bachelor of Arts in Physics-Economics Reed College, 2004 Submitted to the Engineering Systems Division in Partial Fulfillment of the Requirements for the Degree of
Master of Science in Technology and Policy at the
Massachusetts Institute of Technology June 2006
02006 Massachusetts Institute of Technology. All rights reserved.
...
...
.-..
.-.Author.
-. .-
-
T .d ~ e c h n o l o g y and Policy Program, Engineering Systems Division May 16,2006
Certified by.. ... .,, ..
v..
....-.
...r...
...
Ernst R. Berndt Louis B. Seley Professor of Applied EconomicsThesis Supervisor
-
... ......'...'..
Accepted by...-
,.
...
... {..i
Dava J. NewmanProfessor of Aeronautics and Astronautics and Engineering Systems Director, Technology and Policy Program
'
MASSACHUSRTS WTIWTE. OF TECHNOLOGY1
1
MAY
3 . 1
2006
1
1
I
LIBRARIES
LCross-Country Study on the Promotion of New Pharmaceutical Products
Jayeeta Kundu
Submitted to the Engineering Systems Division on Mayl6,2006 in Partial Fulfillment of the Requirements for
the Degree of Master of Science in Technology and Policy
Abstract
Detailers are one of the most powerful components of pharmaceutical marketing. Drug manufactures spend a lion's share of their marketing budgets on their detailers, and with direct-to-consumer (DTC) marketing coming under closer scrutiny, it is likely that detailing will receive even more funding in the coming years.
This thesis analyzes how differences in detailing regulations in the United States, United Kingdom, Sweden, Italy, and France lead to differences in the promotion and sales of antinausea, antihypertensive, and antipsychotic medications during the time period of 1992 to 2003. In order to determine if promotional efforts vary across generations of medications in the same therapeutic class, antinausea and antipsychotic medications are classified as new and old generations and antihypertensives are classified as new, middle, and old generations in this study. Qualitative and quantitative methods are used to examine population, economic, price, promotional, regulatory, and cultural factors that contribute to the sales of phanunaceutical products.
The qualitative discussion includes an overview of all five sample countries' health care systems, health care policies, and the prevalence of hypertension, cancer incidence, and psychosis. Econometric tools are used to conduct the quantitative analysis. The effect on pharmaceutical sales and the diffusion of new generation pharmaceutical products is examined. Chow tests are conducted for cross-country differences.
This study fnds that there are significant cross-country differences in the diffusion of the three therapeutic classes in the five sample countries examined in this thesis. The different factors examined contribute to diffusion in varying extents in the five sample countries. Culture is found to play an important role in the sale and use of all three therapeutic classes, but an especially crucial role in the case of antipsychotics. The promotional factors appear to play a significant role in the diffusion of new generation products relative to older generation products, but are not found to have a statistically significant effect on the larger therapeutic level.
Thesis Supervisor: Ernst R Berndt
Acknowledgements
I would like to thank Professor Bemdt for being a wonderful advisor. Not only did he give me support and guidance on my thesis, but in countless other aspects of my academic and professional life. He made my entire MIT experience more enjoyable and my thesis possible. I feel truly honored to have had the opportunity to work to Professor Berndt and will use the skills and insights I gained fiom him well beyond my time at MIT. I would also like to extend my thanks to Mr. Anatonie Vieens and Mr. Hubert Ridolphi for taking the time to help me better understand detailing from the pharmaceutical industry's viewpoint. Finally, I want to thank my family and fiiends for always being there for me. Everything I do is ultimately possible because of them.
Table of Contents
...
Chapter
1 .Introduction
71.1 Motivation and Objective
...
71.2 Background on Health Care Systems in the Five Sample Countries
...
8...
1.3 Comparing the Sample Countries 24.
.
...
1.4 Thesis Organizabon 27...
Chapter 2
-Detailing and Detailing Regulations
28...
2.1 Introduction to Detailing 28 2.2 Detailing Regulations in the Five Sample Countries...
29Chapter 3
-Data and Regression Models
...
34...
3.1 Overview of the Data 34 3.2 Variables and Regression Models...
35Chapter 4
-
Antinausea Medications
...
41...
4.1 Symptoms and Causes of Nausea and Vomiting 41 4.2 Types of Antinausea Drugs...
434.3 The Sale and Use of Antinausea Medications
...
464.4 The Promotion of Antinausea Medications
...
514.5 Econometric Analysis
...
564.6 Summary of the Antinausea Medication Market
...
60Chapter 5
-
Antihypertensive Medications
...
615.1 Symptoms and Causes of Hypertension
...
615.2 Types of Antihypertensives
...
625.3 The Sale and Use of Antihypertensives Medications
...
645.4 The Promotion of Antihypertensive Medications
...
705.5 Econometric Analysis
...
745.6 Summary of the Antihypertensive Medication Markets
...
78Chapter 6
-
Antipsychotic Medications
...
796.1 Symptoms and Causes of Psychosis
...
796.3 The Sale and Use of Antipsychotic Medications
...
826.4 The Promotion of Antipsychotic Medications ... 86
...
6.5 Econometric Analysis 89...
6.6 Summary of the Antipsychotic Medication Markets 92Chapter
7 .
Cross-country Comparison
... 937.1 Cross-country Therapeutic-class-level Regression ... 93
7.2 Cross-country Generation-level Regression ... 103
...
7.3 Summary of Cross-country Comparisons 113 ...Chapter
8
-
Conclusion
114 ... 8.1 Market Overview 114 8.2 Economic and Cultural Factors...
1158.3 Health Care System Factors
...
1158.4 Effects of Detailing
...
1168.5 Cross-country Differences
...
116...
8.6 Policy Recommendations 117Appendix
-
STATA Outputs of the Regression Results
...
119...
Chapter 1
-
Introduction
1.1
-
Motivation and Objective
Prescription drugs are among the most regulated products in all developed countries. Not only is the sale of these products closely monitored, a great deal of regulation also deals with their promotion. While every country regulates the promotion of pharmaceutical products, the regulations themselves vary greatly across countries and therapeutic categories.
In all countries, the lion's share of promotional dollars is spent on a group of semi- professionals called "detailers", who directly interact with physicians on behalf of pharmaceutical companies. Detailers have two main objectives: to educate physicians on the newest medicines and promote their companies' products. Though the one-on-one time detailers spend with physicians is very limited, it has proven to be one of the most, if not the most, effective ways to alter a physician's prescribing behavior. While its effectiveness alone makes detailing worth examining, the fact that detailing is difficult to regulate because it is hard to dictate what a detailer can and cannot say to a doctor behind closed doors, makes it an especially interesting area to examine for a policy study.
In this thesis, I examine modern day detailing and highlight changes that have occurred over the years. I focus on how detailing differs across countries, looking closely at differences in regulation, culture, and incentives of different stakeholders. I will try to assess how variances in these categories alter how risks and benefits of new drugs are conveyed in different countries around the world. In order to narrow the scope of the study, five countries and three therapeutic categories were chosen.
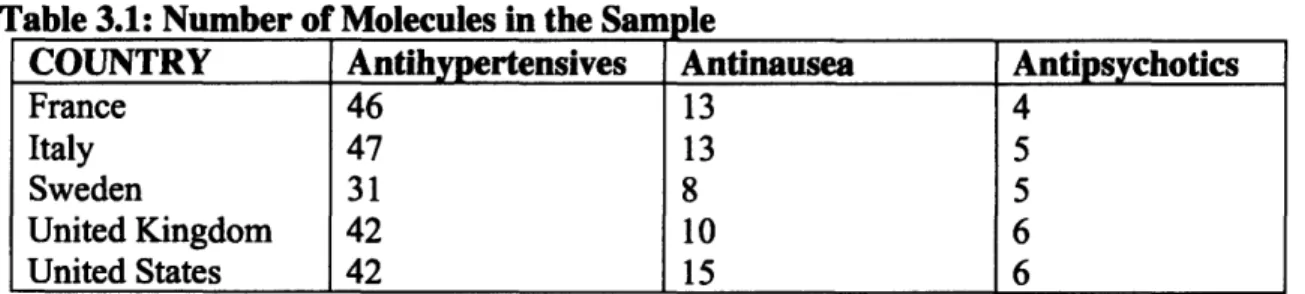
The three therapeutic categories I have chosen are antihypertensives, antinausea, and antipsychotics. The reason for choosing antihypertensives is that they are a "standard" class of drugs, and there is little discrepancy in how they are prescribed. Furthermore, antihypertensives are traditionally under used, making them an interesting category to examine in a study about the promotion of pharmaceutical products. Antinausea drugs are primarily used in the treatment of cancer patients and pregnant women, but what makes these products interesting for this study is that they are predominantly promoted to nurses rather than physicians. Finally, antipsychotics were chosen because they offer a glimpse into the mental health sector. Also, antipsychotics are prescribed more uniformly across countries than other mental health drugs, due to the fact that it is easier to diagnose psychosis than depression. This reduces the noise that is traditionally added when researching mental health products.
The countries in the analysis are the United States, Sweden, France, Italy, and the United Kingdom. The US was chosen because it is the country that spends the most on health care in the world. Sweden serves as a quasi-control because the Swedish government owns all the pharmacies in the country through a national chain, the Apoteket AB. Thus, the government sells all prescription pharmaceutical products in the country. No other
country exerts this level of control on pharmaceutical products. France is interesting because the French use more drugs than do residents of any other country; however, the national health care system negotiates drug prices, and is able to keep the cost of this high prescription drug usage low. Italy is experimenting with an interesting set of regulations with respect to detailers, and is therefore included in this study. Finally, the United Kingdom is included because the national health service of the country pays for most common medical services, but not for pharmaceuticals. Also, health care expenditures on the whole have been lower in the UK than in other Western European countries.
There has been a significant amount of research on the effect of pharmaceutical promotion of pharmaceutical prescribing and use. Bernard McCormick et al. examined the effect on prescribing habits of restricting contact between internal medicine residents and pharmaceutical detailers [I], and Frederick Huang et al. studied the effect of attending pharmaceutical company sponsored conferences on the prescribing behavior of physicians [2]. In addition, Chren and Landefeld studied how the frequency and degree of contact with pharmaceutical companies affects prescribing behavior by examining interactions ranging fi-oin detailer's visits to conference attendance and research collaboration [3]. There is also literature on the effect of promotion and regulation on the sale of pharmaceutical products. For example, Ernst Berndt et al. studied the role of marketing, price competition, and product quality in the antiulcer drug industry of the United States [4], and the study by Ernst Berndt et al. on the price indexes for antidepressant medications [5]. Ling Cui examined cross-country and cross-therapeutic- class differences for antidepressants and antihypertensives in Germany and Japan [6]. This thesis is unique in that it is a broader cross-country and cross-therapeutic-class study on the detailing of pharmaceutical products than most previous research in this area, which have focused on a single country, and usually on a specific therapeutic class within that country. Furthermore, this thesis takes into account many different factors in examining the relationship between detailing and drug sales, such as regulations, culture, and economic factors. It also looks at antinausea medications, which is a therapeutic class that has not been studied extensively in the past. Therefore, this thesis provides a more holistic view of detailing than most of the work done in the past in this area.
1.2
-
Background on Health Care Systems in the Five Sample
Countries
This section describes the health care systems in the five sample countries. It looks at the role government plays in providing healthcare, payment structures, and the cost and use of health care services in each country.
A. United States
of America
The United States spends more on health care than any other nation in the world. There is no single national health care system that provides health insurance to all residents.
Instead, the US health care system is a complex matrix of private and publicly funded programs.
Financing the US Health Care System
The US health care system is the most expensive system in the world, accounting for around 15% of the nation's GDP [7]. The default legal system for health care is "fee-for- service", where patients pay for medical services when they receive them. However, very few Americans actually pay the full cost of health care services themselves.
The majority of Americans rely on private insurance to cover medical expenses. The private insurance market in America is massive, with more than 1,300 separate private health insurance providers [8]. In 2005,70.9% of all Americans had some form of private insurance [9]. In addition, the national and state governments provide health care insurance to the elderly, the poor, and the disabled. The breakdown of health care expenditure is given in Fig. 1.1 below.
Figure 1.1: Makeup of Health Care Funding in the United States in 2003
Source: 2005 OECD Health Database
While there is no universal health care system in the US, the portion of health care covered by public funding has been rising steadily over the years. The large number of people served by the different government funded health insurance programs makes the US government the single largest purchaser of health care services in the country. The Center for Medicare and Medicaid Services projects that, including nursing home expenditures, 33 cents of every dollar spent on health care services in the
U.S.
is paid by Medicare and Medicaid [lo]. The portion of health care provided by private insurance is also increasing, though at a slower rate than public funding. Out-of-pocket health care expenditure has steadily declined over this same period. The graph in Fig.l.2 shows the trend in health care expenditure in the US over four decades.Health Care Spending by Funding Source
5 "
s40 1 I-
30g
i
201
10S
al P 0 1960 1965 1970 1975 1980 1985 1990 1995 2000 2005P u b l i c Funding O u t - o f - P o c k e t
-
Private InsuranceFigure 1.2: Health Care Spending by Funding Sources Source: 2005 OECD Health Database.
Private Health Insurance
There are two main models for private health insurance in the US: the preferred provider organization (PPO) and the health maintenance organization (HMO). Private insurance companies negotiate the price of medical services directly with providers, such as
hospitals, physicians, and pharmaceutical companies. Usually, larger insurance companies can use their size to get larger discounts fiom medical service providers. Under a PPO, there is often a pre-selected group of health care providers that have contracts with the health insurance company to provide services to patients covered under the PPO for a discounted rate. If patients visit health care providers within this "network", then they normally only pay a small co-payment (10-20% of the total fee) for the medical treatment they receive. If patients chose to visit providers outside of the pre- selected group, then the percentage of the cost of services they must cover out-of-pocket typically increases by some percentage.
On the other hand, HMOs are prepaid health insurance plans that "manage" the health of
their client. Like PPOs, HMOs have a network of health service providers; however, the
difference is that in an HMO, patients are required to use providers in the network. If patients visit a provider not associated with the HMO, the HMO will usually not cover the cost of the visit, unless the HMO authorized the visit in advance. In exchange for the additional restrictions on providers patients can use, HMOs charge lower rates than other forms of private health insurance.
Most Americans receive health insurance through benefits programs fiom their employers. Employers establish a contract with private insurance providers (PPO or
HMO) and pay a large portion of the employees' health insurance premium on their behalf In less fie uent cases, employers will hire medical professionals and provide
4
health care directly.
Government Funded Health Insurance
While there are many sources of public fimding for health care in America, the three major ones are managed by the Department of Health and Human Services (HHS) and are Medicare, Medicaid, and State Children's Health Insurance Program (SCHIP).
Medicare
Established in 1965, Medicare is funded by the federal government and provides health care insurance to people age 65 and over, and people with certain disabilities. In 2004, Medicare covered 42.3 million American citizens, and provided assistance to 96% of elderly citizens over the age of 65 [l 11.
Medicare is financed through payroll taxes and the Self-Employment Contributions Act of 1954. The payroll tax is equal to 2.9%, where employers and employees each pay 1.45% of the employee's earnings associated with employment towards the Medicare fund. Self-employed individuals pay 2.9% of net earnings towards financing Medicare. Medicaid
Medicaid was created at the same time as Medicare and is the largest government funded health care program in the country. Medicaid is jointly funded by the states and federal govemment to provide health insurance for individuals and families with low incomes and assets. Though participation in Medicare is voluntary, all states have had a Medicare program since 1982. Since Medicaid programs are run at the state-level, policies on eligibility, services, and payments vary substantially among the states. As long as the state program meets the federal guidelines for Medicaid programs, the federal government pays for a portion of a state's Medicaid costs2, and the state covers the rest [121*
There are a few key differences between Medicare and Medicaid. First, Medicaid is available to legal residents of all ages, so long as they meet the income eligibility criteria set in their state of residence. Secondly, Medicare does not have premiums or deductibles, so it is entirely free to those who receive it. Because of the different eligibility criteria for the two programs, it is possible for people to be enrolled in both Medicare and ~ e d i c a i d ~ .
In 2004, Medicaid covered 52 million Americans and carried a price tag of $305 billion. Medicaid covers a wide range of medical services, ranging from child birth to nursing
'
Google Inc., along with many academic institutes in the US, falls under this category.The percentage of Medicaid expenses covered by the federal government varies by state.
homes. In fact, Medicaid funding accounts for approximately 50% of all nursing home costs and 20% of all health care spending in the US [12]. Table 1.1 shows the number of people covered by Medicare and Medicaid, and the total amount spent on these two programs in 2004.
Table 1.1: Medicare and Medicaid Coverage in 2004 People U.S. Total
Medicare
*The 7 million "dual enrolled" individuals were only counted once to calculate the total number of people covered by Medicare and Medicaid.
Source: Kaiser Commission on Medicaid and Uninsured, 2005.
Money
Medicaid
Medicaid & Medicare
State Children's Health Insurance Program
294 Million
42 Million
Created in 1997, the State Children's Health Insurance Program (SCHIP) is a national program to provide health insurance to children in families with an income too high to qualify for Medicare, but not high enough to be able to afford private health insurance premiums. In 2005, SCHIP provided health care services to over 6 million children.
$1.54 Trillion
$297 Billion
52 Million
87 Million*
Like Medicaid, SCHIP is a state run program, and every state has one. The SCHIP program grants considerable flexibility to the states to determine how to structure the program. States have the fieedom to design SCHIP programs independent fiom Medicaid, use SCHIP funding to expand Medicaid funding, or create a system that is a combination of the previous two. The federal government gives states funding for SCHIP programs at a rate that is higher than the standard Medicaid match. The additional funding provided for SCHIP is helping states improve the health care they can provide to residents.
$305 Billion
$602 Billion
The Uninsured
Even with multiple government and private health insurance programs in the United States, a significant portion of the population is uninsured. In 2005, 41.1 million individuals, or 14.1% of the population, lacked health insurance [13]. The large number of uninsured is not only a problem because health care is a necessity for all people, but because the cost of providing treatment to these individuals raises the cost of health care
for the rest of the nation. Uninsured people tend to receive health care at later stages of an illness when treatment becomes more expensive, and usually in emergency or intensive care units, where the cost is the highest of all settings [14]. The cost of this treatment is then distributed to the rest of the population in the form of higher taxes and health insurance premiums. The breakdown of health insurance coverage is given in the graph in Fig. 1.3. 100% 90% 80% 70% 60% 50% 40% 30% 20% 10% 0% 2000 2001 2002 2003 2004
1.
Job-Based Ins. .Other Pdvate I3 Public Insurance Uninsured/
Figure 13: Health Insurance Coverage in the United States from 2000 to 2004 Source: Center for Disease Control, Nationul Health Survey 2005.
B. Sweden
The Swedish National Health Service (NHS) was started in 1970, and provides health care services for the entire country. The responsibility of providing health care is located at the county level, so the local political leaders of Sweden's 21 geographical areas are in charge of almost all health care services in the country. While no uniform basic care package exists, the county councils are required to use the nationally-stipulated ranked principles of human rights, need or solidarity, and cost-effectiveness in setting health care programs [ 1 51.
Managing and Financing the National Health Care System
The NHS operates under three political and administrative levels: national government, county council and local authority (municipality). At every level, authorities are publicly elected and have the right to levy taxes to finance their activities.
The national government's role is to set the legislation for the health care system and ensure that these laws are followed. The government agency in charge of ensuring that system runs efficiently and pursues its fhdamental objective is the Ministry of Health
and Social Affairs. The county councils are responsible for primary and secondary care, and the municipalities are in charge of elderly care and nursing homes.
The Health and Medical Services Act of 1982 sets the basis for the NHS. The Act stated the peoples' equal right to accessible quality health care, the need to respect the patient's integrity and right to make hislher own decisions, and urged that treatment be performed in consultation with the patient to the maximum degree possible. The Health and Medical Services Act also transferred the responsibility of providing health care services from the national government to the county councils.
The county councils levy income taxes on their constituency. The county councils use the revenue to run hospitals, health centers and other health institutions. Since providing health care is the largest responsibility of the county, health care expenditure accounts for 85% of total county expenditure and 71% of these operations are financed from tax revenues [15]. The other major revenue sources are grants and payments for certain services received from the central government, which the central government collects through the national income tax and indirect taxation.
The umbrella organization of the Swedish local authorities is the Swedish Association of Local Authorities (Svenska Kommunforbundet). In the realm of health care, the 290 municipalities are responsible for the care of the elderly, disabled, and long-term psychiatric patients. Due to their responsibility for the care of the elderly, the municipalities operate public nursing homes and home-care services [16].
While user fees are an integral part to the Swedish health care system, they are "more ideological than financial" [17]. They are used to curb the demand for unnecessary health care, but not be a financial burden on the people. In face, user fees represent only about 2% of the total health care expenditure of the country [15]. The patient fee ceiling is only SEK 900 (about $1 1 7 ~ ) for any twelve-month period, after which point all medical services become free. All treatment for patients under the age of 20 is free as well.
One of the major goals of the Swedish national health care system is price controls. In 2002, the Pharmaceutical Benefits Board (Lakemedelsform~nsnamnden) was established for the purpose of determining which pharmaceutical drugs should be subsidized. The agency also sets the price of prescription drugs via negotiations with pharmaceutical companies. In addition, Sweden bases the allowable price of a medication on the price charged for the drug in other countries, and, in particular, on the price in the manufacturer's home country [18]. Furthermore, a new directive requires that any drug on the Pharmaceutical Benefits Board subsidy list be replaced with the cheapest comparable generic product by the pharmacists [16].
The state-owned National Corporation of Swedish Pharmacies (Apoteket AB) has the sole and exclusive right to retail medicines in Sweden and distributes products through a nationwide chain of 900 pharmacies. Under the social insurance scheme, patients pay the entire cost of prescribed pharmaceutical preparations up to SEK 900. Above this amount,
a rising scale subsidy operates (See Table 1.2), with a ceiling of SEK 4,300 (US $559) for a twelve-month period [IS]. After a patient reaches this ceiling all medications become fkee.
Table 1.2 Patient Out-of-Pocket Expenditure on Prescription PharmaceuticPLP in
In 2002, public fimds accounted for 85.9% of total Swedish health expenditure. The remaining 14.1% was financed through private expenditure, most of which was out-of- pocket payments by individuals. A small portion of the private expenditure came fiom voluntary insurance5, which is mostly purchased by employers and very rare in Sweden. Sweden
Health Care Services
Cost of Pharmaceuticals in SEK (US$) 0-900 ($0- 1 17) 901-1700 ($1 18-221) 1701-3300 ($222-428) 3301-4300 ($429-558) 4301+ (%559+)
The Swedish people pay the highest taxes in the world, the majority of which goes to funding the health care system [17]. When a recession in the early 1990's caused lines to be longer than ever, the public demanded improvements be made to the system. What resulted was a set of reforms that fundamentally restructured the health care system of Sweden.
Patient Out-of-Pocket Expense
100% 50% 25% 10% 0%
In 1992, the Patient Choice and Care Guarantee reforms were created. These reforms allow patients to choose where and by whom they wish to be treated. Furthermore, the reform guarantees that a patient will be offered help by a primary care facility on the same day that they ask for help, and a medical consultation must be given within eight days. If the primary care physician determines that a specialist is need, the patient is guaranteed the right to within three months if the diagnosis is clear, or within one month if the diagnosis still needs to be determined. These reforms have reduced the waiting times significantly over the last decade [17].
Another major change that occurred during the same period was the shift in emphasis from in-patient to outpatient care. Increasingly more medical visits are occurring outside of hospitals, and the number of day surgeries is rising [19]. These changes are helping alleviate the pressure on the hospitals and increase accessibility to care, which is a primary tenant of the NHS.
Finally, during the later part of the 19903, most county councils shifted from a purchaser-provider model to a purchaser-provider split. The move was made in an effort to increase the efficiency of the health care system and control costs, since under a
%ue to the fact that less than 1% of Sweden's population has voluntary i n s m c e , the exact b r d u p of the private expenditure is not known.
purchaser-provider split, public and private institutions competed more intensely for patients. Studies done on the Swedish health care system have found that the move to the purchaser-provider spilt has in fact increased the efficiency of health care services in the country [17]. From 1990 to 2000, the percentage of care provided by private hospitals rose from negligible levels to 9% of total county council expenditure, and over 29% of all visits to a doctor occur at private medical establishments [19]. This shift to the private sector is occumng because private hospitals are run more cost-effectively than public ones [17], and the purchaser-provider split rewards this efficiency.
C. France
The French national health care insurance system was founded in 1928. In 2000, the World Health Organization (WHO) classified it as the "best health system in the world". The national health care insurance system in France serves two major functions: providing health care to French residents and controlling the cost of medical care in the country.
Providing Health Care Insurance to French Citizens
The national health care insurance system in France is open to all French citizens and currently covers 99.8% of the population. A wide range of medical services is covered under the program, including physician visits, prescription medications, hospitalization fees, medical tests and surgical procedures. Also, unlike many other countries with national health insurance programs, there are no waiting lists for surgeries in France [20]. While most medical services require co-payments, the size of the co-payment varies depending on the treatment, and ranges from 25-45% of the total cost. In certain circumstances no co-payments are required6. Prescription drugs are separated into three classes based on the urgency with which they are needed. Drugs in the first category are reimbursed 100 %, the second 70 %, and the third, or least essential category of drugs, are reimbursed 24 % [2 1 1.
Health insurance falls under a branch of the Social Security system in France and is funded by a collection of regional and local national health care funds called Sickness Insurance Funds (SIFs). The Ministry of Social Affairs and the Ministry of Finance oversee the administration of these funds, which are the main organizational feature of the health care system. The majority of the funds, 60%, come from contributions from workers' salaries. The remainder is collected through indirect taxes on alcohol and tobacco and direct contribution paid by all revenue proportional to income, including retirement pensions and capital revenues [20].
The national insurance plan complete covers the cost of prenatal care, treatment of work-related injuries, care of the handicapped, care of veterans and military pensioners, or for the treatment of any disease that falls on a list of long, costly or otherwise defined sicknesses such as diabetes, cancer, AIDS, heart disease, transplantation, end-stage renal disease, and mental illness.
Inclusion in the General ~ u d , which is the major national health insurance fund, requires that the employee and employer contribute 6.8 % and 12.8 % of the employee's gross salary, respectively, into the fund. This results in a combined contribution of 19.6% of an employee's salary to the general fund. The contributions are divided between health care for employees and their families (16% of the gross salary) and unemployment insurance (3.6% of the gross salary) [21]. Self-employed citizens only contribute 12.8% of their gross salary to the general fund, and as a result, do not receive all health care benefits or unemployment insurance. Unemployed individuals initially receive the same amount of coverage under the general fund as they did when they were employed. The length of
time benefits remained unchanged is calculated via a complicated formula, which includes an individual's age and the amount he or she previously worked [21]. If individuals are still unemployed after this length of time passes, they are required make the contributions themselves, or request assistance from the local government [2 11.
While the national health care insurance system in France is comprehensive, gaps still
exist. Thus, more than 80 % of French citizens have some form of supplemental insurance through private mutual insurance companies [7]. While individuals can purchase such insurance on their own, most receive it through their employers [21, 221. This supplemental insurance works by the same mechanisms as SIFs, employees and employers make contributions based on wages. The chart in Fig. 1.4 shows the payment
distribution of health care expenditures for the average French citizen.
Unaccounted Out-of-Pocket 3%
Figure 1.4: Payment distribution of health care expenditures in France
Cost Containment within the French National Health Insurance System
The second important function served by the national health care insurance system in France is that of cost control. The system controls the cost of medical care in France by limiting the amounts physicians and companies can charge for medical treatment [21].
The primary control mechanism for cost control is the nationally negotiated fee schedule, which determines the maximum amounts that can be charged for various medical services. This fee schedule is negotiated annually by a committee of representatives from the three major SIFs and the three major physicians unions in France. Once the committee develops the fee schedule, it must be approved by the General Fund, at least one of the other major SIFS, at least one of the physicians unions, the Ministry of Finance and the Ministry of Social Security. Once approval is granted, the fee schedule must be followed by all hospitals, pharmacies, laboratories, other treatment facilities, and most physicians in France 1211. Only tier-two physicians are permitted to charge fees in excess of the national fee schedule, and in exchange, these physicians give up some of their own national health insurance benefits. No new physicians can gain tier-two status, but physicians who were in that tier before it was closed as still allowed to charge fees above the national fee schedule [21, 221. Any fees above what is stated in the national fee schedule are not covered by the national health insurance, and individuals who decide to visit tier-two physicians must cover the additional expense themselves or through supplementary insurance [23].
Medical cost control in France does not reduce the level of medical treatment available to the French. In fact, the lower cost of health care has quite the opposite effect. People in France visit physicians more frequently, are admitted to the hospital more often, and purchase more medicine than people in America. The only category where Americans use medical services to a higher degree than the French is in visiting specialists; however, this may be due to the fact that only 40% of French physicians are specialists, compared to 80 % in the United States [24].
D. Italy
In 1978, Italy established the national health system, which is called Servizio Sanitario Nazionale (SSN). In 2000, the WHO named Italy's health care system the second best in the world7. The goals of the SSN were to provide universal access to uniform health care for all Italians citizens and to improve the government's control on expenditures. Currently, the program provides universal health care; however the level of care available varies greatly by region [25].
The Organization of the Health Care System
When the SSN was created, a three-tier system was created to distribute the responsibility of providing health care for the country. The system is composed of the State, regional governments, and the Local Health Care Enterprises (Aziende Sanitarie Locali or ASL). These three tiers work together to provide health care to the entire country.
After the Italian constitution was reformed in 2001, the State determines the basic benefits package, called the "livelli essenziali di assistenza" or LEA. The LEA lists all services that must be uniformly available in the entire country. The twenty regions have
responsibility for organizing and administering the health care system 1151. Regions are allowed to provide services beyond those in the LEA; however, they must fund such services through local revenues. Finally, the ASLs are the local agencies that ultimately purchase health care services for the people with government funds. Their h c t i o n resembles that of a third party payer.
The SSN covers a multitude of health care services including physician visits to general practitioners and specialists, in addition to in-patient treatment, such as lab tests, surgeries and hospitalization costs. The program also subsidizes prescription medications, outpatient treatment and dental treatment.
The SSN works with a wide variety of providers including both public and private hospitals, clinics, physicians and nurses. In order for a private health care provider to be reimbursed via the SSN it must be accredited by the region. While some regions have additional criteria for private providers to qualify for reimbursement through the SSN, other regions encourage competition for patients among public and private providers 1261.
Italian people have considerable freedom in choosing their physicians and where they receive medical services. The only restrictions on patients are that they must use the ASL to which they are assigned (which is geographically determined), and most forms of treatment require a physician's prescription or referral. Thus, the general practitioner serves as the "gate keeper" in the Italian national health care system. If a patient requires treatment that cannot be provided within their region, or cannot be provided within a "reasonable" time, the patient can go to another region or even to another country in the EU for the treatment. Patients use this flexibility often, which is illustrated by the fact that more Italians seek treatment outside of their country than any other EU country [27]. Once patients receive authorization to leave their region for treatment, patients can receive financial aid for not only the cost of the treatment itself, but also travel expenses and additional costs, including those of an "authorized accompanying person" [26]. The actual level of reimbursement varies from region to region.
Unfortunately, bureaucracy is rampant in the system, leading to long wait lists for surgeries and certain types of treatment. As the cost of health care has risen over the years, the flexibility that Italian patients enjoy has been reduced. It is increasingly becoming harder to receive SSN fhnding for treatment outside of Italy, as the final decision about the necessity of such treatment is being given to the ASL instead of the primary care physician 1261.
Furthermore, during the health care reforms that took place in 1999, the goal of the SSN to provide uniform healthcare to all Italians was revisited, what was meant by "uniform" was redefined. The legislators decided that due to the rising cost of health care, the SSN would only guarantee coverage for services that were "necessary", "effective", "appropriate" and "efficient" in terms of delivery [27].
Financing the Italian Health Care System
From its inception, the goal of the Italian national health care system was to be financed by general taxation; however this did not become a reality until 1998. For the first few decades, compulsory employer contributions accounted for half of the funding and the remainder was collected through a variety of sources (See Fig.l.5). In 1998, a regional corporation tax replaced the compulsory employer contributions and brought the SSN one step closer to being funded only through general taxation.
The decision of whether or not to have co-payments was left up to the regions. It was not until 2002 that all regions added this form of payment to their programs. Even with the introduction of co-payments in all regions, public financing covers about 74% of health expenditure in Italy. The remaining expenses covered by private finding mainly pay for private health care services and over-the-counter (OTC) drugs, which are not covered by the SSN. Private insurance providers cover a small portion of the private expenditure on health care. Only 15% of Italians have private insurance [27]; however, as the cost of health care rises and SSN reduces coverage, it is possible that more Italians will turn to private insurance in the fbture. The chart in Fig.l.5 illustrates the general decomposition of funding sources for the SSN.
P m e . I lnsunnce 3% Resional k r p c w o n Tax 43?! J 4 r 1 I I and borrowing I: 31 %
Figure 13: Break down a f f i d h g
seurees
for the SSN.Since 2001, the regional gbvemmts have M i g i v e n a pre-established share of the revenue collected in their regions from value added taxes, individual income taxes, and the fuel tax to pay for health care. Because regions do not take in the same amount of tax revenue per capita, or have the same spending
on
heat& care, a National Ekpalization Fund was created to make grants based on a variety of variables8. These grants help insure that all Italians receive “uniform and essential" levels of health care as detemnined by the Italian Ministry of Health.These variables are: population size and age composition, fiscal capacity of thc region, size of territory and any special features of the region, and historical expenditure on health care. However, the historical expenditure allowance will be phased out over a dozen years (France 2001).
E. United Kingdom
The United Kingdom (UK) established the National Health Service (NHS) in 1948 to provide healthcare for all the residents of the UK. Currently, health policy is the top item on the political agenda in the UK, and is focusing on both ''finance and provision of health care" [IS]. The following summary will briefly discuss the organizational and financial setup of the NHS, as well as what services it provides the people of the
UK.
Organization and Finance of the National Health ServiceThe NHS falls under the Department of Health and is headed by the Secretary of State for Health. The Department of Health designs the overall health priorities of the nation, but
the NHS is essentially
run
at the regional and local level.Health services in the UK are divided into "primary" and ''secondary" and are provided by local NHS organizations called "trusts". These trusts are the main purchasers of health care services [IS]. Since 2003, funding allocations are made directly to trusts from the NHS.
There are about 300 primary care trusts in England and they receive around 75% of the NHS budget [28]. Each trust individually decides what health care services will be provided in the area and is responsible for
thc
efficient delivery of these services.Services that fall directly under the responsibility of primary care trusts include: general practitioners, dentists, pharmacists, opticians, NHS Direct, and NHS walk-in centers.
Primary
care trusts are also able to outsource care to private health care providers.Finally, primary care trusts refer patients to the secondary trusts when specialized treatment is needed. - -
-
a; -.
Secondary care trusts provide funding for specialized patient care and services. There are
many different types of secondary trusts, each focusing on a different type of medical care. The different types of trust includeg:
L , ~ p q
p r\%(.pci~:\.
,.
.
ix : l l * '
1 . r 5
Acute trusts: Short-term care, such as acci nts-ggd Tvem~rgeeci~s, maternity, # . # surgery, x-ray. ! A; . . , . , ,
.
.
.
.Care trusts: Focus on health and social care, carrying out a variety of services, such as mental health services. ~ ~ q e k t i k ~ bJ&j 31L, 1 Mental health trusts: Specialist mental health trusts, providing care, such as psychological therapy and specialist medical and training services for people with
severe mental health problems
Ambulance trusts: There are over 30 ambulance services for England, each run
by its own trust. These trusts are responsible for . transporting . patients to hospital. -- - -
4- • ' i t t > : I n t w t W 1 " , ym<:~a j 1 : ~ ~ , ; $ d ~ , ~ ~ i . f L ; ~ , ! , - , t . , . . , . I : . 1,': if24 , - , a , * l & u ; w - i ; '!*tN-r *-%d , r 3 , p ,8 % ,I
,.
1The s e c d a r y trusts summary relies heavily on a report by the BBC Action Network on April 1,2005.
The NHS is fimded through national taxation. Budgets for the NHS are created every three years as part of the "general public expenditure planning process", but these budgets can be adjusted as needed during the three years [15].
Although general national taxation h d s the majority (80%) of the NHS, an additional significant source of funding (12%) is the National Insurance Fund. The National Insurance Fund collects money fiom the UK workforce. Employees contribute 10% of income between GBP 87-575 (US$164-1087) per week, and employers contribute 1 1.9%
on earnings above GBP 87'' (US$164). Self-employed individuals contribute GBP 2 per week and a percentage of their profits. The remainder of fbnding for the NHS comes from receipts and miscellaneous sources (See Fig. 1.6).
R- Capital Reciept 4% 1% Charges&Misc.
-
L 3% A Natl. lnsurence A 1 2%A
Trust InterestFigure
1.6: libding soulres
for the NHS.Source: European Observatory on Health Care System, 2002.
The key feature of the
NHS
is that almost all medical services provided by the NHS are fiee of charge. Patients in theUK
can visit a general practitioner, a specialist, or stay in ahospital for h e . A recent policy
finther
entitles people in theUK
to h e residentialnursing care [15]. User fees are used for prescription drugs, ophthalmic services, and
dental care. While other user fees may vary, &ere is a flat fee on all prescription medications". Currently, the flat fee is GBP 6.65 (USS12.57) per prescription. The expenditures of the MIS are illustrated in the chart in Fig. 1.7.
lo GBP to US$ conversions done using exchange rate on M a y 10,2006 of lGBP = $1.89.
" The following groups receive prescription medication for fiee: patients under the age of 19, people on
welfare, war pensioners on drugs relating to war injuries, pregnant women and new mothers, disabled, people with listed medical conditions, and NHS in-patients.
Central Health
Non- and Mist. Dept. Adrnin. discretionary-, 1%
/-
Capital 'OYO
P-f
I , *v*.-..
L - * . - Figure
1.7:
NBS
Expenditures'
Source: European Observatory on Health Care Systems, 2002 Health Care Services Provided
There are no minimum medical services that must be provided in the UK. Rather, the
National Health Service Act of 1977 gives the Secretary of State the responsibility of
providing services "to such extent as he considers necessary to meet all reasonable
requirements".
Thus,
the level of medical care avail&!& to patients varies among regions. In all regions, patients have the right to visit a general practitioner (GP) whenever they choose. Most GPs in the UK work for the government, with only around 200 completelyprivate GPs in all of the
UK
[IS]. The GPs provide health care services as needed to patients. If, however, a GP feels that a patient needs to see a specialist, the GP will give the patient a referral. Without a referral, specialist visits are not covered by the NHS.While patients in the
UK
generally are able to visit at GP without any wait time, access to secondary care is far more limited. The average wait for a specialist consultation is two and a half months, and if surgery is recommended, the wait for hospital in-patient treatment is approximately three months [IS]. These long waiting periods have led to anincrease in private hospitals in the UK. Cunently, there are around 300 private hospitals with the majority owned by one of five for-profit chains [28, 151.
' % . - T . . . . . . - - . . - . . ,:, , - -* , .. ,- - . . . ' . I . / ' , , . .
The long waiting periods have also led to an increase in the demand for private insurance. In 2000, 1 1.5% of the population had supplemental private medical i n s m c e [29]. About two-thirds of all private insurance policies are purchased by employers, mostly for white- collar employees [15]. Private insurance is used to pay for medical services not covered by the NHS or for visiting private health care providers without referrals from primary
~ m ~ ~ , 4 ' ; T r T '?Ti
,mi?
K-,7-The long waiting times have been the main factor for the increased political focus on health care in the UK. The fact that the UK has historically under-funded health care with respect to other Western European countries [7] has probably led to the long waiting periods. To help alleviate the situation, the Chancellor of the Exchequer has committed to increasing the budget for the NHS by 6% annually in real terms over the next few years
[15]. This increased funding will help the NHS build new facilities and provide more health care services to the people of the UK.
1.3
-
Comparing
the
Sample Countries
When health care spending of the five sample countries are compared, interesting features of the systems can be seen, especially with respect to pharmaceutical products. The data used to create the charts and graphs that follow is all from OECD Health Care
Data 2 005.
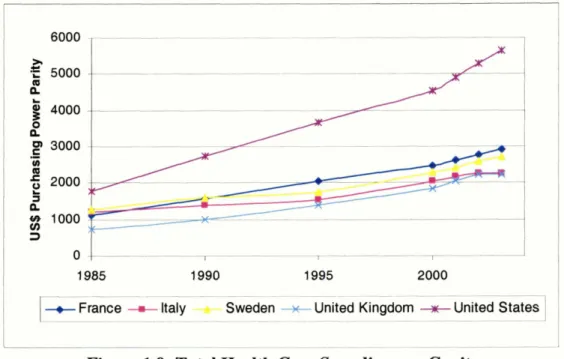
In all of the countries, the portion of GPD devoted to health care spending has been rising (Fig.l.9). Similarly, per capita health care expenditure has been steadily rising (See Fig.l.8). While all five countries show a similar trend, health care expenditure is rising faster in the US than in the EU countries.
6000 5000 n
g
4000 0 n 3000-
(II 2000 E a ng
1000 3 0 , I 1 985 1990 1995 2000 --I
-c France-
Italy - Swedr.. . . United Kingdom+I+
U ~ S ] -Figure 1.9: Total Health Care Spending per Capita
Focusing on the pharmaceutical market, we find that pharmaceutical sales are rising in all
the countries, but the rate of increase is much higher in the United States (Fig. 1. lo). Over the period fiom 1992 to 2002, the growth rate in pharmaceutical sales
in
Sweden was approximately 148%, 668% in Italy, 598% in theUK,
1097% in France and anastonishing 113 13% in the US over the same ten year period. However, it is important to keep in mind that the population of the US is much higher than mat of the other countries, and this greatly contributes to the higher levelof eg%ndr@re.
0
2000008
180000f
1600002
140000 m .E a 120000e
1ooooo5
soooo
n
4 , J 60000 3 40000g
20000 .I I .Is
0 1992 1993 1994 1995 1996 1997 1998 1999 2000 2001 20021
t ltaly +$weden+
UK+
France*
USAI
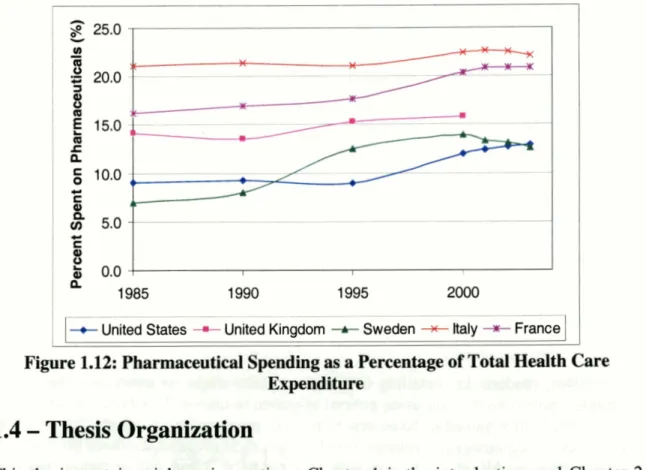
Figure 1.10: Total P h a ~ c e u t i c a l Sales tn Sample ComtrimPer capita spending on pharmaceuticals has also been increasing every year (Fig. 1.1 1). The highest spending is once again in the US, with Italy and France next with very similar per capita spending, followed by Sweden and UK. It is interesting to note that while the US spends over eight times as much on pharmaceuticals as the next closest country (France), the per capita pharmaceutical expenditure is only 1.8 times higher in
the US than in France. The fact that pharmaceutical spending the US may not be as high as is often believed becomes even more evident when pharmaceutical spending is compared to total health care expenditure (Fig.l.12). When examining the sample countries, it can be seen that while pharmaceutical spending as a portion of total health care spending has been rising in the US, as in all the other countries, US actually spends less of its health care budget on pharmaceutical than the other countries. Pharmaceuticals accounted for 12.9% of total health care expenditure in the US in 2003, while it
represented 20.9% and 22.1% of France and Italy's health care expenditure, respectively.
-- --
+ United States United Kingdom +- Sweden ++ Italy -*;. France
Figure 1.12: Pharmaceutical Soending as a Percentage of Total Health Care Expenditure
1.4
-
T h d Organization
This thesis contains eignt major sektions.
C-
- -^:r'
is the introduction, and Chapter 2 gives an overview of detailhi and d e t a n g regulations in each of the five sample countries. Chapter 3 provides a discussion on the data sources, regression models and definitions of the variables used in these models. Chapter 4 through Chapter 6 provide detailed discussions about the sales of antinausea, antihypertensive, and antipsychotic medications in the United States, United Kingdom, Sweden, Italy, and France, as well as factors that contributed to the sales of these medications. Chapter 7 compares the cross- country differences in medication sales each of the three therapeutic classes. Finally, Chapter 8 provides a conclusion of the findings of thet-q
thesis and gives policy recommendations.~jf.:d
- a r Y. - - - n...
.
.., . ., ,...,
-,,. Apd$L;trm~al$$f;
.,>?P
~ 9 v q - j ~ : i g - ? 8.; r ! *x,;1 : , , . , > j 2 r t . ,is: $ 1 . zbub g;>t;k,,.*,
' b .ri,l;l: I : y , p'i;fiw *j . ] ; . , :.-I .,- -;.1 - , I - # t .: .!,::. . ; ~ c j : ) a & . -.r. ~::1. 3 ; - , ~ w J ~ ~ ,
lq>-iwJ:g,
--*, ~ 4 ~ 1 4 ~ ~ q . , c ~ . , I , r . 8 - , , y ,-
.I I ,.
- ,,
, , r j i l j i f j ,,;.
, -1 - 8 -. t - a-. 'J + * . - - # ' ,Chapter 2
-
Detailing and Detailing Regulations
This chapter provides a brief description of detailing and how it has changed over the years. Also, a summary of the different detailing regulations in the United States, United Kingdom, France, Italy and Sweden is presented.
2.1
-
Introduction to Detailing
The lion's share of the pharmaceutical industry's promotional budget is spent on a group of semi-professionals called "detailers", who directly interact with medical professionals on behalf of pharmaceutical companies. The name "detailer" was established because it is the job of these professionals to present prescribing information, or the 'details', about new medications to physicians [30]. Thus, detailers have two main objectives: to educate physicians on the newest medicines and promote their companies' products. Over the years, the profile of the detailer has changed, though the crucial role they play in promoting pharmaceutical products has not.
In the 1940s, modern day detailing first began to take shape, as major pharmaceutical companies moved away fiom using general salesmen to market their products, to having a group of specially trained in-house representatives promote their products [30]. In order to establish the legitimacy of detailers, the pharmaceutical set strict standards on who was hired as a detailer. All representatives were required to be "clean, chaste, moral, married, educated, and pleasant" [30]. Because of the general belief in the 1940s and 1950s that traveling sales positions were not suitable for women, detailers were almost exclusively men. Women did not join pharmaceutical sales force to any significant until the mid-
1970s [30], but the number of women in the field has grown rapidly with time, and currently the number of men and women detailers is almost equal [3 11.
As the pharmaceutical industry has grown over the past six decades, so has the number of pharmaceutical representatives it employs. In 1944, there was a total 7,000 detailers in America, while in 2004 the average large pharmaceutical company has sales force with 4,97 1 representatives [32]. Between 1995 and 2005, the number of detailers has grown 300 percent [31], which is a good indication that detailing continues to be an effective method of promoting pharmaceutical products. The pharmaceutical industry currently spends $12 billion annually on an estimated 90,000 pharmaceutical representatives in America alone [32,33].
Different countries have different educational requirements for detailers. For instance, though there are no government imposed requirements in the US, most pharmaceutical companies require representatives to be college graduates with knowledge of science and human anatomy. The European Council directives that serve as the basis for promotional regulations for most EU countries indicate that pharmaceutical representatives need to have a sufficient scientific knowledge to provide information that is precise and as complete as possible about the products they promote. Italy decided to place more restrictive requirements on detailers in the country, requiring representatives to have a degree in medicine, surgery, biology, biochemistry, or pharmacology [34]. France also
requires sales representatives to have degrees in science or medical disciplines, though the degree list is broader in France than in Italy [34].
2.2
-
Detailing Regulations in the Five Sample Countries
Though the one-on-one time detailers spend with physicians is very limited, usually not exceeding fifteen minutes, it has proven to be one of the most effective methods by which to alter a physician's prescribing behavior. In all countries, pharmaceutical promotional activities, including detailing, are regulated. Interestingly, each of the five sample countries examined in this thesis has taken a different approach, leading to a great array of regulations. The following portion of the thesis provides a brief summary of the different detailing regulations in effect in the US, UK, France Italy and Sweden.
A.
United States
In the US, the federal government regulates the promotional activities of pharmaceutical companies. The Food and Drug Administration (FDA) is the federal agency responsible for ensuring that pharmaceutical products are honestly, accurately and informatively represented to the public. The Division of Drug Marketing, Advertising and Communications (DDMAC) at the FDA's Center for Drug Evaluation and Research (CDER) is primarily responsible for monitoring that prescription drug information provided by pharmaceutical companies is "truthfbl, balanced, and accurately communicated" [35].
DDMAC meets this responsibility through comprehensive surveillance of all forms of media advertisements: print, radio, Internet and television. The FDA is also regulates the promotional activities of detailers, and monitors that the information provided by these sales representatives is honest and balanced like the other forms of promotion. Section 502(n) of the Food Drug and Cosmetics Act is the main regulatory guideline for advertisements for pharmaceuticals in the US, and states that advertisements must include: the established name, the brand name (in relevant cases), the formula showing quantitatively each ingredient, and information in brief summary which discusses side effects, contraindications, and effectiveness [3 51.
If the FDA feels that promotional activities are misrepresenting a pharmaceutical product, the FDA has the authority to remove the advertisement or stop the inappropriate detailing. For example, in 2004, the FDA required Pfizer to pull its "wild thing" television commercials for Viagra off the air because the agency felt that the commercials made claims about Viagra that were not substantiated by clinical data [36]. Similarly, the FDA issued a warning letter to AstraZeneca requiring the company to send "Dear Healthcare provider" letters to all the health care professions who had been received false information &om AstraZeneca's sales representatives that the generic version of AstraZeneca's Diprivan, produced by a competitor, was "not therapeutically equivalent to Diprivan" [3 71.
In addition to the FDA, the activities of detailers are regulated by the pharmaceutical industry itself. In 2002, the Pharmaceutical Research and Manufacturers of America (PhRMA), the trade organization of research-based pharmaceutical and biotechnology companies in the US, developed the PhRMA Code on Interactions with Healthcare Professionals. The PhRMA code, which went into effect on July 1, 2002, provides specific guidelines for all types of interactions between pharmaceutical companies and healthcare professions including informational presentations and meetings, consulting relationships, scholarships and educational funds, and educational and practice-related items. The Code prohibits detailing activities that were previously considered acceptable, such as taking physicians to play golf at the pharmaceutical company's expense, or providing tickets to concerts and sporting events [38].
B. France
France uses the 'rational use of medicines' Directives established by the European Economic Community (EEC) in 1992 to guide its regulations on pharmaceuticals. The directive that pertains advertising and detailing is the 92/28/EEC, and this directive outlines the interactions between pharmaceutical representatives and healthcare professions.
The directive requires that pharmaceutical companies will train their sales representatives, and ensure that these detailers have "sufficient scientific knowledge to be able to provide information which is precise and as complete as possible about the medicinal products which they promote" [39]. Representatives are required to bring summaries of product characteristics and details about the price of every product that the detailer plans to present to the healthcare profession. Also, detailers are required to provide the French Medicines Agency, the French equivalent of the FDA, with information about adverse effects they learn about during their detailing visits.
Like the PhRMA code, the EEC directives prohibit detailers from providing gifts or benefits to healthcare professionals, unless the gifts are "inexpensive and relevant to the practice of medicine or pharmacy" [39]. The EEC directives state that any free samples given to physicians "must be in response to a written request, signed and dated" by the physician. Though the EEC directives do not place a limit the number of free samples that can be given, France has chosen to restrict the all detailers to a maximum of ten samples per physician per year [40]. While the EEC also allows member countries to restrict the number of times a detailer can visit a physician, France has chosen to not implement this added restriction.
C. Italy
In Italy, promotional and detailing activities are regulated by Legislative Decrees 541/1992 of 1992, which was Italy's way of implementing the European Directive 92198lEEC. Interestingly, Italy has chosen to more strictly regulate detailing than what is required by the EEC directives.