CORPORATE REAL ESTATE ASSET MANAGEMENT IN THE UNITED STATES
by
Peter Read Veale
B.S., Wharton School of Business (1985)
Submitted to the
Department of Architecture
in partial fulfillment of the requirements for the degree of
MASTER OF SCIENCE IN ARCHITECTURE STUDIES at the
MASSACHUSETTS INSTITUTE OF TECHNOLOGY
February, 1988
@ Massachusetts Institute of Technology 1988
Signature of Author . . . . . . . . . . ..-.
Peter Read Veale Department of Architecture January 15th, 1988
Certified by . . . . . . . . . . . . . . . . .o . . . . ..
Ranko Bon, Ph.D
Associate Professor of Building Economics Thesis Supervisor
Accepted by . . . . . . . . . . . . . .. . . . . , . . .
Julien Beinart, M.C.P. Chairman Departmental Committee for Graduate Students
Corporate Real Estate Asset Management in the United States by
Peter R. Veale
Submitted to the Department of Architecture on January 15, 1988
in partial fulfillment of the requirements for the Degree of
Master of Science in Architecture Studies
ABSTRACT
This research is an assessment of the management of buildings and land for large organizations -- both public and private
--that are not primarily in the real estate business. An investigation of the current management practices, priorities, planning horizons, motivations, and attitudes of managers for these assets was conducted by way of an indepth survey of senior
real estate executives at 284 large U.S. corporations and institutions.
The research shows that despite their tremendous value,
corporate real estate assets are often under-managed. The
market value of a corporation's buildings and land typically represents 25 percent of total assets but ranges from 10 to 50
percent and in some cases is reported higher. Among those
surveyed, less than half consistently evaluate their real estate assets independently, either as a cost center or profit center.
One in five does not evaluate their real estate at all.
One of the most significant conclusions of the research is that large numbers of corporate real estate managers do not
maintain adequate information on their real estate assets. One
in four does not maintain a real estate inventory. Two out of
three do not maintain a real estate management information
system (MIS). One in four is uncertain of the market value of the organization's real estate and one in three is uncertain of the acquisition cost. Based on similar research conducted in
1981 by Harvard Real Estate Inc, the 1987 research suggests that
little has changed over the six year span.
Statistical Hypothesis testing of the data using Chi-Square
methods reveals that: 1) Profit centers do not indicate more
effective management of buildings and land than cost centers (but that those who do not separately evaluate their real estate
-- as either a cost or profit center -- are less effective than
those who do), 2) Effective management of corporate real estate is unrelated to the size of the real estate portfolio (but directly related to management attitude), and 3) the use of
computers in corporate real estate does not necessarily indicate
effective management.
The research concludes with discussions of the role of information and general management in corporate real estate and
examines the future of the field -- both as an emerging branch of management and an emerging academic discipline.
Thesis Supervisor: Ranko Bon, Ph.D.
ACKNOWLEDGEMENTS
I would first like to thank the many executives who provided their thoughts and comments during the research and who made
this study possible. Hopefully, their collective efforts will
contribute to a greater understanding of the field today.
This study, and previous research by the author, was made
possible with funding from the Shimizu Construction Co., Ltd. I
am grateful for their support. I am also indebted to the
Laboratory of Architecture and Planning at MIT which has
provided ongoing administrative and financial support throughout my stay at MIT. In addition, the research was conducted in
cooperation with the International Association of Corporate Real Estate Executives (NACORE) who provided considerable logistic
support. Their help was instrumental in the successful
completion of the research.
The genesis of many ideas presented in this thesis were borne out of discussions and working sessions with countless
individuals, too numerous to acknowledge here. The following individuals, however, are deserving of special recognition: Dr. Ranko Bon for all of his help and his unerring sense of professionalism, proficiency, and punctuality in his role as
thesis advisor and mentor at during my work at MIT, Dr. Robert
Silverman (of Harvard University) for his invaluable advice and enthusiastic support during all phases of this study, Mike Joroff for a place at MIT without which I would surely not be
writing this today, Rodrigo Brana (of too many degrees to list)
for his contributions as a colleague and a sense of humor, Dr. Eric Dluhosch, for his ongoing support and work together during the past two and a half years, Professor Patrice Derrington (of Carnegie Mellon University) and Young Chai for their thoughts and comments on this and previous research efforts, Carl Fisher of GTE for sharing the results of his research at GTE, and
Bonnie Hafner for her adminstrative assistance in the early going.
Finally, my fullest thanks go to Mary Dolden for her unlimited kindness, understanding, friendship and hot-coffee.
* *
This thesis is dedicated to my good friend Louis Eyre Keene, with no fixed address, who was certifiably nuts and right as
rain.
Pete Veale Cambridge.
TABLE OF CONTENTS Abstract ... Acknowledgements ... Table of Contents ... List of Tables I. Introduction 1. Background . a. Research Rationale ... b. Previous Research ... ... . . ...
c. Preparing the MIT Survey ... ... .. .... ....
2. Structure of the Thesis ... ... ... II. The Evolution of Corporate Real Estate As
in the 80's: Stasis and Uncertainty
Introduction to the Survey Results The HRE and MIT Surveys Compared The Nature of Corporate Real Estate
a. The Size of Real Property Portfolios
s
et Management
... 21
... 22
... ... 25
b. The Value of Real Property Portfolios ... 4. Organizational Structures for Corporate Real Estate
a. Form of Real Estate Unit ... b. Reporting Structure ... c. Activities Reported ... 5. Real Estate Performance and Evaluation
a. Evaluation Method ... b. Inventory and MIS ... c. Real Estate Accounting ...
d. Real Estate Investment Analysis and Return ...
2 3 4 7 9 12 13 16 18 1 2 3 29 32 33 35 36 40 41 43
6. Decision Making in Corporate Real Estate Asset Management
a. The Corporate Real Estate Executive Profile ... 45
b. Decision Support ... 49
c. Management Attitudes ... 51
III. Selected Research Hypotheses
1. Introduction to the Hypothesis ... 56 2. Hypothesis Testing Methodology
a. Dimensions of Effectiveness ... 58 b. Statistical Tests ... 60 3. Hypothesis I: Profit Centers are More Effective in the
Management of Buildings and Land Than Cost Centers
a. Background ... ... 67
b. Statistical Test of the Hypothesis ... 72
c. Interpretation of the Results ... 75
4. Hypothesis II: Effective Management of Corporate Real Estate is Unrelated to Size of the Real Estate Portfolio
a. Background ... ... 80 b. Statistical Test of the Hypothesis ... 84 c. Interpretation of the Results ... 87 5. Hypothesis III: The Use of Computers in Corporate
Real Estate Indicates Effective Management.
a. Background .... ... 94
b. Statistical Test of the Hypothesis ... 95 c. Interpretation of the Results ... 100 IV. Conclusion: Towards Accountability and the Emerging
Discipline of Corporate Real Estate Asset Management
1. The Importance of Information in Corporate Real Estate 104 2. The Importance of General Management in
3. The Future of Corporate Real Estate Asset Management . a. A Developing Field of Business ...
b. An Emerging Academic Discipline ...
4. Real Estate and the Corporate Mission:
Beyond Deal-Making and Towards a Strategic Approach
Bibliography ... . . ... .. . ... .... ... .
Appendix A: Appendix B: Appendix C:
Questionnaire and Cover Letter ... Statistical Summary of Survey Results ... Abstract of Harvard Real Estate Inc. Survey
112 113 115 118 123 128 137 153
LIST OF TABLES Table A: Table B: Table C: Table D: Table E: Table F: Table G: Table H: Table I: Table J: Table K: Table L: Table M: Table N: Table 0: Table P: Table Q: Table R: Table S: Table T: Table U: Earlier Surveys 15
Comparison of MIT and HRE Surveys . . . . . .
Rationale for Cost Center Operations . . . .
Rationale for Profit Center Operations . . .
Primary Activities of Profit Centers . . . .
and Cost Centers
Real Estate Responsibilities of the . . . .
Real Estate Unit and the Line Unit
Barriers for Developing Real Estate . . . .
Inventory / MIS
Mean Hours Spent Weekly by Senior . . . . .
Real Estate Executives
Primary and Secondary Bases for . . . . . .
Decision-Making
Corporate Real Estate Executive Attitudes
Chi-square Testing Method . . . . . . . . .
Comparison Between Methods of Real Estate Evaluation
Effectiveness by Profit Center vs. Cost Center
Effectiveness by Profit Center vs. . . . . .
No Separate Evaluation
Comparison by Portfolio Size . . . . . . . .
Effectiveness by Square Feet Owned . . . . .
Effectiveness by Number of Sites . . . . . .
Effectiveness by "Real estate plays a critical role in my organization"
. . . 23 . . . 36 . . . 37 . . . 38 . . . 39 . . . 41 . . . 46 . . . 48 . . . 52 63 70 73 . . . 74 81 86 . . . 87 . 89
Industry Type of "Real Estate Plays a Critical . . 91
Role in My Organization" Compared to Entire Survey
Computer Use Broken Out by Method of Evaluation . . 96
Table V:
Table W:
Table Y:
Table X:
Table Z:
Computer Use by Profit Center vs. . . . .
No Separate Evaluation
Computer Use by Cost Center vs. . . . . .
No Separate Evaluation
Computer Use by Square Feet Owned . . . .
Computer Use by Number of Sites . . . . .
Uncertainty vs. Availability of Information
98
. .98
. . . 99 . . 100
Introduction
In April of 1987 the author, through the Laboratory of
Architecture and Planning (LAP) at MIT, conducted a survey of
senior real estate executives in America's largest corporations
following a similar survey conducted by Harvard Real Estate Inc.
(HRE) in 1981. The objectives of the MIT survey were as
follows:
o To assess the current state of real estate asset management in U.S. corporations and to compare with the earlier
findings of the HRE research.
o To investigate the underlying reasons for the current
practices observed and to determine the motives and
rationales behind decision-making in the field today.
o To construct a profile of the senior corporate real estate
executive -- mapping out the full range of that
individual's activities, concerns, planning horizons,
priorities and attitudes.
This research is important for several reasons. To date, the management of buildings and land within large organizations has been largely under-researched. What studies have been conducted indicate that these assets may be under-managed. This survey is
an attempt to investigate that claim and provide a
comprehensive and critical assessment of corporate real estate
asset management today. Second, while certain real estate
management practices are known to exist in organizations today,
the underlying motivations and rationales are not always
entirely clear. While management inefficiencies can be
from a clear understanding of the motivations behind the
behavior. This survey is an attempt to ascertain some of those
motivations and rationales. Finally, the results of the
research will complement other research efforts currently in
progress at the LAP and help guide future direction by
identifying new inquiries worthy of investigation.
This introduction will first discuss the rationale for
research in this area and the genesis of the MIT survey. Next,
a brief background on previous survey work in the field is
presented including a summary of the major surveys. The design
of the MIT survey is discussed next, including its preparation
and mailing. Finally, the structure of thesis itself is
1. Background
Past work by the author and research members of the LAP has
focused on the management of buildings and land for large
organizations -- both public and private -- who are not
primarily in the real estate business. Whether referred to as
corporate real estate, physical facilities, real property, or
just buildings and land, these assets typically represent one
quarter of total corporate worth, and collectively, an estimated
$.7 to $1.4 trillion (Silverman & Zeckhauser 1981). LaSalle
Partners estimates that real estate accounts for 22 percent of
the assets on the books of the Fortune 500 (Bennett 1987).
Ibbotson estimates corporate real estate at 7 percent of total
U.S. investable wealth, greater than the total of corporate bonds (3.4 percent) or government treasury bills (4.0 percent).
(Conroy, Miles, & Wurtzebach 1986). Beyond the market or book
value of these assets, are significant operating costs
associated with maintaining them on a day-to-day basis. Total
occupancy costs for corporations can range between five and
eight percent of (pre-tax) gross sales, which can be upwards of
40 or 50 percent of net income (Bell 1987). The International
Facility Management Association estimates the average churn
rate in an organization at 30 percent with the direct cost of
moving a single workstation between $200 and $300. The
Harbinger Goup, authors of the Orbit II study estimate average
churn rates in excess of 40 percent. Estimates of the average
(Bell 1987). The Institute of Real Estate Management estimates
the median occupancy cost for downtown office buildings at $5.83
a square foot (IREM 1987) but this figure can go as high as $40
(Bennett 1987). Rates for heating and cooling alone for office
buildings can reach several hundred dollars an hour (Wald 1985).
Collectively, the ongoing costs and appreciable value of
buildings and land represents a substantial corporate asset and
a vast management effort. In addition, the impact of the
physical environment on organizational productivity and
corporate mission is, while more difficult to measure, no less
important than the cost or value of the real estate asset
itself. (see Zahn 1987. Becker 1985. Margulis 1985. Marans
1985.)
a. Research Rationale
The main thrust of the research at MIT has centered on
senior decision-makers responsible for buildings and land within
the corporation. The work is focused less on the improvement of
the individual components of corporate real estate -- i.e. space
planning, property acquisition, building operations, capital
budgeting, energy management, lease negotiation, etc. -- than on
the improvement of upper management's ability to orchestrate
these many components in an effective, proactive, and well
understood fashion. The approach does not concern facilities
management nor real estate proper, but rather the larger task
of managing both from the perspective of senior corporate
management. This approach has been labeled, at different times,
Real Estate Asset Management (CREAM). Both terms may be
referred to in this thesis. (The term "corporate real estate
management" is used throughout to describe the full range of
activities involved in RPPM or CREAM and, unless otherwise
noted, is not meant in the traditional sense of formal real
estate transactions only).
The work at MIT has been aimed at understanding and
articulating the principles behind the effective management of
large building portfolios and has, as one of its central
objectives, the development of methodologies and systems for
supporting corporate real estate decision-makers. Towards that
end, the author has attempted to further understand the
decision- making process and the decision-makers themselves
through primary research. Hopefully, the results of this work
can better inform the designers of methodologies and tools, such
as future decision support systems, through a greater
understanding of the needs, priorities, and practices of those
who will use them.
b. Previous Research
In past ten years several primary research investigations
have attempted, through surveys and questionnaires, to examine
the business of managing a corporation's real estate and
facilities. These studies each approach the topic from various
vantage points; each concentrating on particular activities or
dimensions and each seeking selected information for its own
constituency of professionals or specialists. In general,
takes a more holistic and top-down approach to the corporate
real estate management process and which aims at a better
understanding of the senior real estate executive within the organization.
Many studies were reviewed in preparation of the MIT study
and, where appropriate, used in later comparative analyses. The
purposes and origins of these studies range significantly.
Cushman & Wakefield, for example, has engaged the firm of Louis
Harris & Associates to poll and report upon the perceptions,
opinions and plans of corporate real estate executives in a
continuing series of Cushman & Wakefield Business America Real
Estate Monitor studies. The information gathered, however, is
less for the benefit of the real estate executives themselves
than for the real estate industry that supports them
--brokerage firms, developers, leasing agents, consultants, etc.
The International Facility Management Association (IFMA) has
conducted several well-organized inquiries into the
demographics, range of activities, and roles of facility
managers in corporations today using its own membership of
facility professionals as a source for data gathering. Several
industry publications, such as Corporate Design & Realty, have
polled their readership on their respective practices and
attitudes. A few corporations, such as GTE, have themselves
conducted polls of real estate managers in other firms to better
inform the management of their own real estate. It is
interesting to note that very few academic investigations have
singular in scope and intention.
The following table lists those surveys conducted in the area
of corporate real estate and facility management which preceded
the 1987 MIT survey:
Table A: Earlier Real Estate and Facility Management Surveys
Compiler Stevenson Hubbard Marling IDRC Harvard GTE Real Estate
Year Target Group
1975 NACORE 1976 Fortune Industrials 1980 Fortune Double 500 1981 IDRC members 1981 Fortune 800 NACORE non-profits 1983 various large industrials 1984 IDRC members # Mailed 205 500 1000 350 * # Returned 107 111 91 100 1377 100 * % Resps. 52 22 9 29 300 22 27 27 70 * Research Corp Farragher Corporate Design & Realty (CDR) 1984 NACORE members 1986 CDR reader-ship Cushman & Wakefield
1986 Dun &
Brad-street (service and industrials 201 (telephone) interviews 1986 IFMA members 1987 Fortune 1000 NACORE non-profits 1300 1898 * = Approximately 455 129 474 28 IFMA MIT * 488 37 * 284 15
It is the opinion of the author that among the studies
conducted within the last decade the HRE work is the most comprehensive and representative of senior management attitudes
to date. The line of inquiry developed in that study appeared to be closest in approach to that which had been developing among
the MIT research team since 1984. Thus, a follow-up of the 1981
HRE study seemed the most appropriate vehicle for conducting the 1987 MIT study.
c. Preparing the MIT Survey
The MIT survey was designed with two objectives. First, to
reexamine those questions from the original HRE survey which
were still deemed relevant in 1987 and to observe changes over
the six year span. Second, to pursue a second line of
questioning which would go beyond the mere observation of
various conditions or decisions being made in corporations today and investigate the underlying reasons or rationales.
Dr. Robert Silverman, one of the two authors of the HRE
study, acted as advisor throughout the survey conception,
design, production and analysis. Where original questions were
repeated, care was taken to phrase the question in its original
form. Out of the 19 original questions, 8 were retained and
another 11 new questions added. A slightly revised version of
the survey was developed for non-profit organizations.
The four areas of inquiry were as follows: general
background; organization; real estate performance and
The 1987 MIT survey, like the earlier HRE survey, was
conducted in cooperation with the International Association of
Corporate Real Estate Executives (NACORE). Specifically,
addresses and titles of the NACORE membership were made
available as well as general clerical assistance when necessary.
In addition, NACORE preceded the actual mailing of the survey
with a membership-wide letter endorsing the study and urging its
members to complete the survey. It is the author's belief that
the NACORE support was very influencial in the success of the
survey.
In addition to the NACORE membership, addresses and titles of
the Fortune 500 and Fortune Service 500 were collected using the 1987 Standard and Poor Corporate Directory. Where available,
the title of the senior real estate executive was used. In all
other cases, either the Vice President of Operations or Vice
President of Finance was selected as the target individual.
On June 1st, 1987, surveys were sent out to the following groups:
o The Fortune 500 500
o The Fortune Service 500 500
o Public Agencies 197
o Academic Oraganizations 34
o Non-Profit Institutions 4
o NACORE Members (not included 663 in the groups listed above)
Total 1898
By August 1st, approximately 320 surveys were returned. Of
number of answers completed) for inclusion in the analysis. An
additional eleven surveys were dropped from the sample when it
was discovered that the respondents were engaged in the real
estate industry as a primary line of business (e.g. development,
brokerage, asset management, etc.). The remaining 284 surveys
were used in the analysis that follows. This represents a 15
percent response rate. Since many respondents elected to
withhold their company name and address for reasons of
confidentiality, it is not possible to determine individual
response rates for the various groups listed above.
2. Structure of the Thesis
This thesis is arranged in three chapters. Chapter I -- "The Evolution of Corporate Real Estate Asset Management in the 80's: Stasis and Uncertainty" -- is an indepth presentation of the
survey results. Similarities between the 1981 and 1987 surveys
are first examined. Next, responses to the questions in the
1987 survey are presented in basic percentage form and, where
appropriate, by cross tabulation with other survey responses.
The individual findings are discussed in the broader context of
real estate asset management as appropriate. Findings of
earlier surveys are also referenced as appropriate.
Chapter II -- "Selected Research Hypotheses" -- is an
exploration of several focused research hypotheses which were
conducted using the data from the survey. These investigations
are not meant to be all-inclusive of the full range which could
in the field today. They were selected subjectively by the
author.
They are as follows:
H:I Profit centers are more effective in the management of
buildings and land than cost centers.
H:II Effective management of corporate real estate is
unrelated to the size of the real estate portfolio.
H:III The use of computers in corporate real estate indicates
effective management.
Statistical tests -- chi square and hypothesis testing
methods -- were employed utilizing the survey data to either
support or reject each hypothesis. The results of the tests are
presented followed by a discussion and interpretation of the
results.
Chapter III -- "Conclusions: Towards Accountability and the
Emerging Discipline of Corporate Real Estate Asset Management"
-- addresses some broader themes that recur throughout the
research in terms of implications for present day practice and
future directions for the overall discipline of corporate real
estate asset management. Two issues which surfaced throughout
the survey -- information needs and general management -- are
discussed indepth. The future of corporate real estate is
discussed both as an distinct field of management and an
emerging academic discipline. Finally, the management
dimensions of a strategic approach to corporate real estate are
examined and the implications for future research are discussed.
References to previous studies, articles, books, unpublished
are included parenthetically by author throughout the thesis.
The full title and date of each reference may be found in the
I. The Evolution of Corporate Real Estate Asset Management in the 80's: Stasis and Uncertainty
1. Introduction to the Survey Results
This chapter begins with a comparative analysis of the MIT
and HRE surveys. The sections that follow provide a detailed
discussion of the survey responses for each of the areas covered
in the survey. These sections are arranged according to the
four basic components of the survey: 1) The Nature of Corporate
Real Estate, 2) Organizational Structures for Corporate Real
Estate, 3) Real Estate Performance and Evaluation. and 4)
Decision-Making in Corporate Real Estate. Individual survey
results may be found as sub-headings under these four general
survey components.
The survey questions are included in Appendix A together with
a copy of the cover letter that accompanied the survey.
Before evaluating the results of this survey it is important
to consider several points. First, the results presented in
this thesis reflect only the answers reported by the real estate
executives themselves and not necessarily the true state of
reality. As such, the answers provided indicate management
attitudes and do not necessarily correspond to actual management behavior.
Second, the completely random character of the sample cannot be assured. Similar to the 1981 HRE survey, a certain degree of
self-selection -- with regard to the availability of data
necessary to fill out the survey -- can be suspected. The HRE
"Those companies with the most organized real estate records
would have found it easier to respond. The survey,
therefore, almost certainly understates the lack of
organized thinking about real estate in American
corporations."
Finally, self-selection notwithstanding, the size of the
sample provides a reasonable assurance of the data's
reliability. For example, to obtain a 90% confidence interval
for a given survey question -- e.g. what proportion of the
respondents maintain a real estate inventory -- accurate to
plus-or-minus .05 (using the most conservative estimation) a
sample size of 271 is required. (Ott & Hildebrand 1983). Thus,
if repeated samples are drawn from the population of American
corporations, the true population proportion will fall within
plus-or-minus .05 of the answer 90% of the time. (Ott &
Hildebrand 1983).
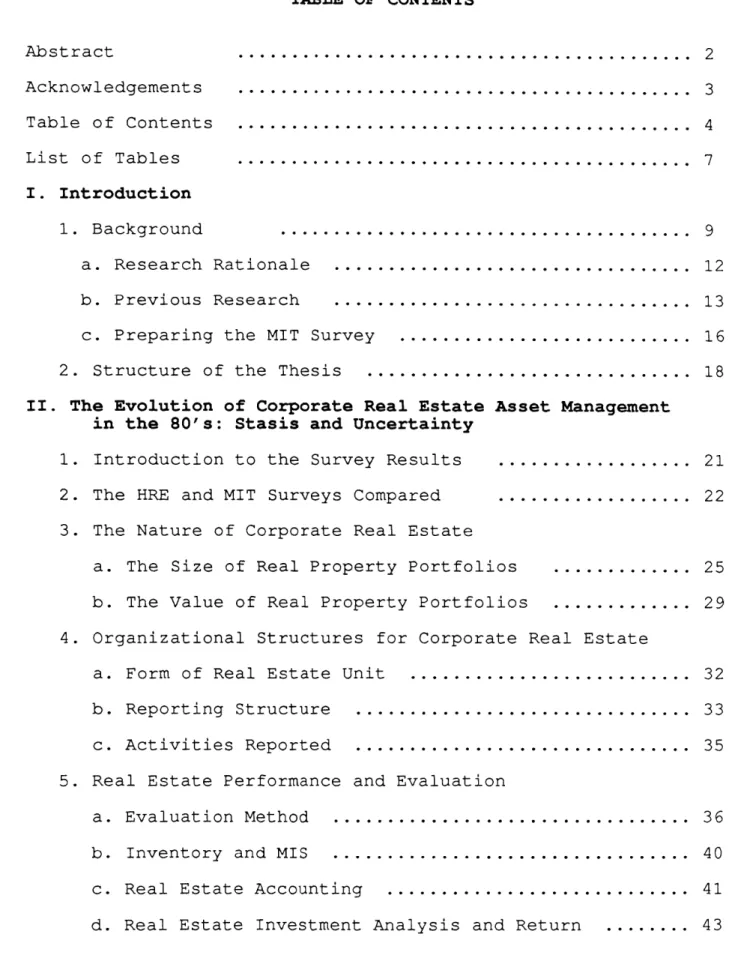
2. The HRE and MIT Surveys Compared
Corporate real estate in 1981, as indicated by the HRE
survey, represented a vast proportion of corporate assets which, by and large, went under-managed. That study highlighted the
reluctance of companies to manage their buildings and land as
separate and independent assets; the absense of adequate data
and information on these assets; and the lack of diagnostic
tools for guiding and evaluating real estate performance. The
study concludes that the decision to manage corporate real
estate effectively and efficiently appears to have more to do
with the attitudes of top management than with the nature, size, value, or function of the properties themselves.
the state of corporate real estate remains
much the same. The MIT survey -- a wholly independent study on
a random sample of U.S. firms a full six years later -- confirms
the findings of the previous study and raises the logical
question: Why does corporate America continue to under-manage
its real estate assets?
Table B is a comparison of selected dimensions from both
surveys which illustrate the degree of similarity between the
two.
Table B: Comparison of MIT and HRE Surveys 1987 MIT SURVEY
o SURVEYS MAILED o USABLE RETURNS o RESPONSE RATE
RESPONDENTS BY INDUSTRY TYPE:
HEAVY MANUFACTURING LIGHT MANUFACTURING RETAIL/WHOLESALE FORESTRY/MINING/CONSTRUCTION BANKING/FINANCIAL/INSURANCE TRANSPORTATION UTILITIES
OTHER BUSINESS ACTIVITIES
% WITH REAL ESTATE INVENTORY % WITH REAL ESTATE MIS
% HAVING A REAL ESTATE UNIT % REPORTING TO THE PRESIDENT
% "CLEARLY EVALUATING REAL ESTATE
PERFORMANCE INDEPENDENTLY"
% "CLEARLY NOT EVALUATING REAL ESTATE PERFORMANCE INDEPENDENTLY"
1981 HRE SURVEY 1898 284 1377 300 22% 15% 12% 13% 17% 4% 20% 6% 8% 21% 64% 26% 86% 20% 39% 47% 22% 14% 25% 4% 15% 5% 3% 7% 66% 20% 80% 20% 40% 40% Today, in 1987,
% INCONSISTENT IN EVALUATING REAL 14% 20%
ESTATE PERFORMANCE
% CHARGING INTERNAL RENTS 67% 65%
% ACCOUNTING FOR REAL ESTATE ON A 51% 60%
PROPERTY-BY-PROPERTY BASIS
The charactaristics of the 1987 respondents closely match
those of the 1981 survey. Several differences may be attributed
to the influence of the overall economy and business climate in
the time elapsed between the two studies. For example, reported
revenues and total assets increased slightly over the period as
the answers were not adjusted for inflation. The decrease in
percentage of manufacturing concerns responding may parallel an
overall decline in the manufacturing sector during the 1980's.
(see Cohen & Zysman 1987. Sabel, Herrigel, Kazis, & Deeg
1987.).
Correspondingly, the increase in banking, insurance, and
financial service firms is likely to reflect the growth of these service sectors while the increase in "other business" may reflect the increase in merger and acquisition activity (i.e. a larger portion of "other businesses" are conglomerates or
multi-service corporations who were unable to respond to the SIC
classifications provided).
While some improvement can be noted, for example in the areas
of charging fair market internal rents or establishing a real
estate unit, the net improvement is not sufficient enough to
overcome even modest allowances for sample error between the two
surveys (i.e 5% to 10%). Thus the following conclusions are
significantly since 1981, and 2) the similarity of the survey
results strengthens the validity of each.
3. The Nature of Corporate Real Estate
a. Size of Real Property Portfolios
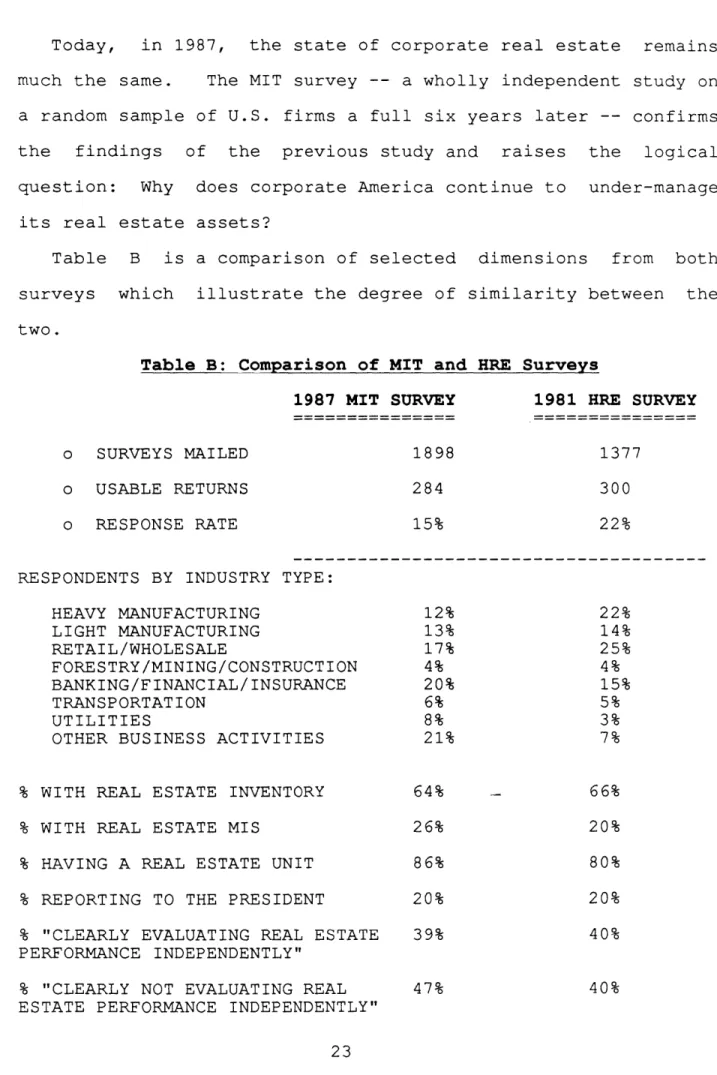
The size of real property portfolios was evaluated by both
square foot area and number of sites, ranging from less than
500,000 square feet to over 25 million and from less than 25
sites to over 5000. The largest proportion of corporations
responding (33%) owns between 1 and 10 million square feet,
within 100 to 500 sites (35%), and leases less than 500,000
square feet (26%). Roughly one-half of all corporations
reporting lease out at least some portion of their owned space.
The survey results point to a full 15% who are leasing out
between 500,000 and 25 million sqaure feet of their own space
annually.
Figure 1 charts the industry group of the respondent by
number of square feet owned and occupied. For the most part, the
larger area portfolios are found within the manufacturing,
transportation and utility sectors while the smaller square foot
portfolios are found within the retail and wholesale; banking,
insurance, and financial services; forestry, mining, and
construction; and "other" business sectors.
When number of sites is the criterion, however, the larger
portfolios are found within the banking, insurance, and
financial services; retail and wholesale; transportation and
utility sectors. Figure 2 charts the industry group of the
SQUARE FEET OWNED 20
-UINDER Goo, liao 10 E b1t , Bee To 1 fI ILLI ON 16 N 0]O10 TO 25 11 IL! ON [OUER 25
1H
12--JL;7~L' CNP1 . ONL 11LLI ONa--i i i mJ c .. I -r rI 1i,- i iCo
4
IEa-ItV . 1T RETAI L/W FOR ESTRV B AN CI NG/' TRANHSPOR UTI I i T I E OTH E RUBL i C
01ANIJ FACT MA'iF1A11CT OI 10L. SAl.E /11 I 14 I NG- F I NA1C I A TAT 1 ON S 11II8 ( M S AGENCY
jFt I NG i NlG CONS 1 1 N.AC 1
NUMBER OF SITES * IND)ER2 C> JL!v -k - 2P--2((D 25---0 P--4
IL G(D .- t '0RES '~'' IIHIHG,'11 ' 1I ""11 1 - .I U LIC
20
--ox:
isi--MlAN14IRAVC'T MA-1N 1F A CT'1 01 1O S AL-E /I N IG/-, F I HNANHCI A ..k.M T I ON I Oi:H:I 1 MES S AGCq t--IUCV
Mt I HG it I NG CON; L/ N. ACIll 1
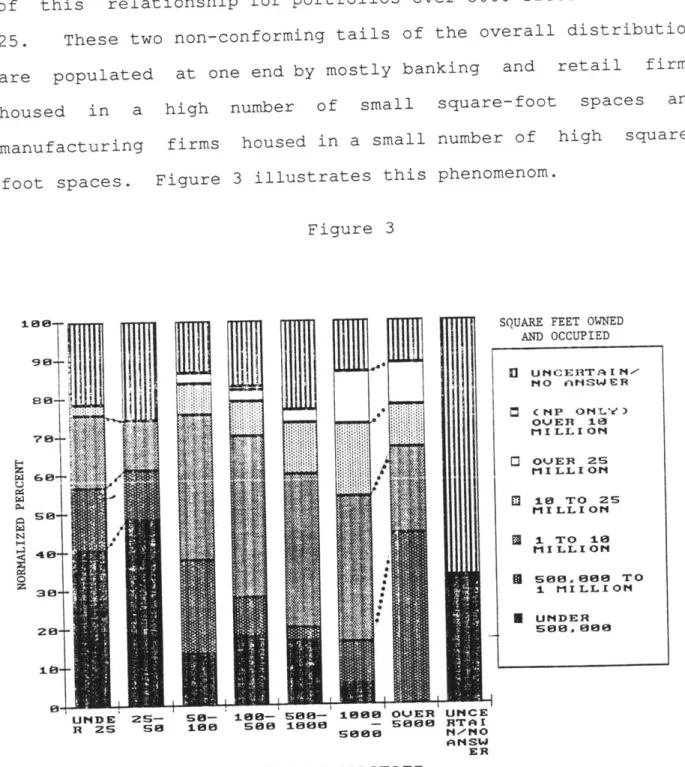
In general, as portfolios increase by number of sites they
increase in area. The survey data shows, however, the inverse
of this relationship for portfolios over 5000 sites and under
25. These two non-conforming tails of the overall distribution
are populated at one end by mostly banking and retail firms
housed in a high number of small square-foot spaces and
manufacturing firms housed in a small number of high
square-foot spaces. Figure 3 illustrates this phenomenom.
Figure 3 56--so-- 40- 36-26.. UNDE 25- 56- 166- 566-R 25 56 £ee 566 1666e 5ee
SQUARE FEET OWNED AND OCCUPIED UNCERFT A I NO AMSWER c CNP OMLVi) OVER 1 MI LL I ON o OVER 25 ri I LL I ON
o
16 TO 25 MILLION * i TO 1 MI LLION S 80,00e0 TO 1 MILLION * UNDER s66 666 UNCE RTA I ANSW ERNUMBER OF SITES-FAC L TIES
NUMBER OF SITES / FACILITES COMPARED TO NUMBER OF SQUARE FEET OWNED '90- e- 76- 266-N
W
-1
b. Value of Real Property Portfolios
While corporate real estate can be safely estimated at
approximately one-quarter of total corporate assets, this ratio
varies dramatically. Disregarding both the upper and lower
limits of the survey results (where a range or mid-point cannot
be specified) and those cases where the respondents claim to be
uncertain, approximately one-third of the survey fell into
increments ranging from $250,000 to $5,000,000 as the market
value of their real property. This value is based on the
current fair market value estimated by the respondents and not
the depreciated value of real estate currently held on the
books. These respondents report the market value of their real estate as a percentage of total corporate assets as follows:
45% -- less than 20% of total assets 25% -- at least 20% of total assets 20% -- at least 50% of total assets 13% -- greater than total assets
Thus, while one quarter of total assets is adequate
justification for ongoing and effective management of these
assets, in general, management should not be entirely settled on that figure since we can see that a full third (of the group
shown above) reports their real property at 50% of total assets
or greater.
Among industry groups the higher (fair market) value real
estate portfolios may be found in the manufacturing, forestry/
mining/ and construction, transportaion, utility, and public
agency sectors. The retail/wholesale and banking/insurance/
lower real estate value. This latter group, however, also
reports the highest total assets of all industry groups. A
probable explanation may be found in the fact that most large
banks, financial groups, and insurance companies hold sizable
and valuable real estate properties as a part of their
investment portfolio which may not show up in this survey. As
is typical in the industry, corporate real estate assets (those
which actually house the business) are managed separately from
investment properties and typically by a different management
group with entirely different performance expectations. Thus,
the executives responding (on in-house real estate) may not have
included that value of investment properties in the survey.
Figure 4 charts the fair market value of real estate holdings
by industry group. It is interesting to note that, from an
industry standpoint, real estate represents a much greater
proportion of total assets in heavy manufacturing and the
forestry/mining/construction industries than for the
banking/insurance/financial service industries. According to K. Philbrick, director of real estate for a large consumer products
firm, manufacturers are not interested in ownership or
appreciation as much as cost control. "For the most part,
they're only interested in putting a roof over their heads and controlling expenses, not making money on their real estate."
MARKET VALUE OF REAL ESTATE (THOUSANDS)
1--uo. 0'~ IE cm111 14- 12-14 0 -- N11DE0 0]oi IN TCIET A I 13 --'l -
~AIH
SW- E R S6-iii::
.
i:.
miIig
-l-H EAUV . I GlT 1RETA I
MlANIJFACT IMANIJFACT 11011ES
IJR I NG( toit 1 N4G
FORESTRY BAN I NG/ TRl1ANSPOR UT I L I T E )T HEiE PU I. C
/M I NCI NG-' F I NIA NC I A Tr1 I ON S BUS i NVSI AE INC
CONPS L/IN CT I U
RESPONDENT BY INDUSTRY TYPE
4. Organizational Structures for Corporate Real Estate
a. Form of Real Estate Unit
Approximately 86% of those responding to the survey reported
having a formal real estate unit in place. This percentage is
up slightly from the 80% level reported by HRE in 1981.
Approximately one half of these real estate units were formed
within the last ten years.
Most real estate units take the form of a department within
the corporation. Approximately 15% of the respondents have
taken the step of forming a separate real estate subsidiary,
consistent with the 1981 survey and previous studies:
Department Subsidiary Both
1981 HRE 1983 GTE 1986 CDR 1987 MIT 80% 76% 88% 82% 14% 19% 12% 13% 6% 8% 5%
The survey data shows, however, the decreasing likelihood for these subsidiaries to be found in firms with large portfolios:
Area (in million DEPT/SUBS RATIO (%) Number of Sites DEPT/SUBS RATIO (%) under over .5 .5-1 1-10 10-25 25 19 15 13 5 0 under 1000- over 25 25-50 50-100 100-500 500-1000 5000 5000 30 32 15 14 15 11 16 )
This phenomenon may be the result of sampling error, in as
much as the original surveys were sent directly to the (parent)
corporations themselves and thus may not have actually reached
the subsidiaries. The overall drop may, however, reflect the
fact that non-consolidated subsidiaries may find it increasingly
difficult to meet the criteria for non-consolidation with large
portfolios; specifically, that the subsidiary be non-essential
to the parent corporation and its business be largely unrelated
to the parent. Thus, the non-consolidated subsidiary with an
increasingly large business from the parent is obligated to
maintain an increasingly large segment of unrelated business.
(see Bunyan, Czerwinski, Kitts, & Rossi 1986). Consolidated
subsidiaries, on the other hand, are not bound by these
restrictions. In any event, the more important question to be
posed is: how many of those firms who have not organized a
subsidiary (85%) continue to maintain and manage their real
estate on the books of their operating divisions? Since the
survey questions did not go into sufficient detail to provide
any answer, this question remains as an area for further
research.
b. Reporting Structure
The job title of the senior real estate executive within the organization varys considerably, as does the level of importance
attached to the position within the hierarchy of the
corporation. Of those responding to the survey, 37% were vice
presidents; 22% managers; 16% directors; 10% presidents; and the
Organizational structure and responsibility vary widely across
industries and individual companies. While roughly half of the
real estate units in the sample report to either the president
or executive vice president, the rest report to any number of
individuals within the organization: general counsel, director
of corporate engineering, vice president of purchasing, CFO or
controller, vice president of administration or corporate
services, vice president of tax, and others.
One in four firms responding has its formal real estate
functions (i.e. acquisition, divestiture, development, etc.)
reporting to a separate vice president than its facility
management functions. This may be seen as a potential source of
conflict. Where separate reporting structures did occur,
approximately 31% reported inadequate communication and
coordination between the two groups. For those whose manage
their real estate for profit this percentage grows to 57%.
Evidence for the high percentage among profit centers may be
found in two possible explanations: It may be argued that the
higher priority given to development activities and lower
priority given to operational concerns (which was evident
throughout the survey for profit centers) may have put the real
estate function at greater odds with the facility management
function. Alternatively, it may be argued that profit centers
that are demanding greater effeciency and accountability from
the corporation's real estate are more likely to encounter
resistance and difficulties along the way than those who do not. That is, it is only during the process of increasing management
effectiveness that the true impediments become known.
c. Activities Reported
Leasing continues to be the predominant activity among real
estate groups, followed by property management, acquistions,
divestiture, and development. This is consistent with the 1981
HRE findings wth the exception of property management which was
reported in 1981 as the third most predominant activity. This
is also consistent with the 1986 CDR survey which ranked major
responsibilities, in descending order of significance, as space
leasing, asset deployment, and facility management. In general,
the overall thrust of real estate activities is normally
acquisitive, emphasizing addition over subtraction. The
following percentages apply:
MIT HRE Leasing . . . . . . . 75% 96% Property Management . . . . 64% 75% Acquisitions. . . . . .. 61% 80% Divestiture ... 52% 64% Development ... 45% 56%
Respondents to the survey reported line units engaging in
real estate activities in varying degrees. Line units were
reported to engage in activities of capital budgeting, site
selection, identification of new real estate needs, design
decisions, and identification of surplus property 25% of the
time or more. They were reported to be less involved with real
estate record keeping, property mangement, disposal of surplus
properties, acquisition, construction supervision, lease
approval, financial analysis of projects, and tax evaluation
5. Real Estate Performance and Evaluation
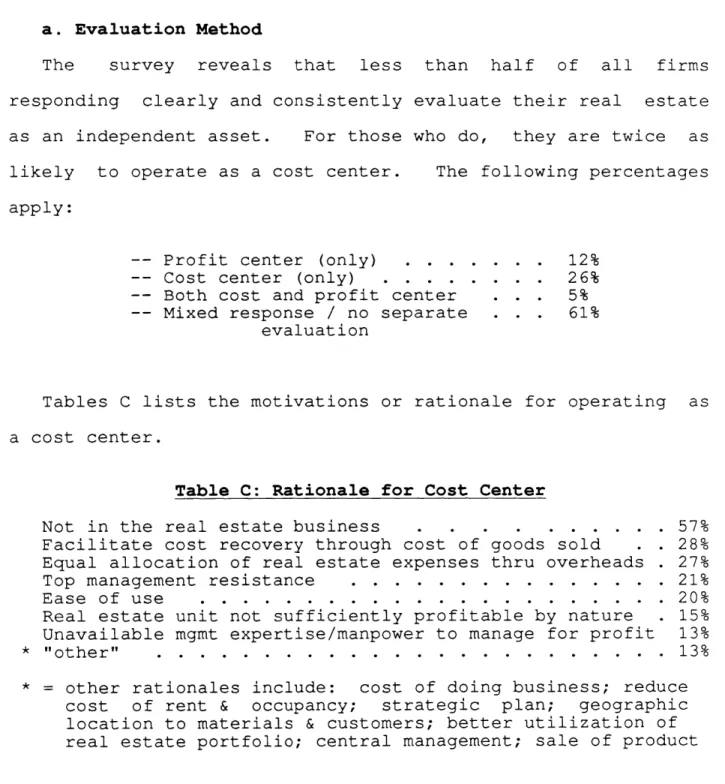
a. Evaluation Method
The survey reveals that less than half of all firms
responding clearly and consistently evaluate their real estate
as an independent asset. For those who do, they are twice as
likely to operate as a cost center. The following percentages
apply:
-- Profit center (only) . . . . . . . 12%
-- Cost center (only) . . . . . . . . 26%
-- Both cost and profit center . . . 5%
-- Mixed response / no separate . . . 61%
evaluation
Tables C lists the motivations or rationale for operating as
a cost center.
Table C: Rationale for Cost Center
Not in the real estate business . . . .. .. .. . 57%
Facilitate cost recovery through cost of goods sold . 28%
Equal allocation of real estate expenses thru overheads . 27%
Top management resistance . . . 21%
Ease of use . . . 20%
Real estate unit not sufficiently profitable by nature 15%
Unavailable mgmt expertise/manpower to manage for profit 13%
* "other" . . . . . . . . . . . .. . . . . . . . . . . . 13%
* = other rationales include: cost of doing business; reduce
cost of rent & occupancy; strategic plan; geographic
location to materials & customers; better utilization of real estate portfolio; central management; sale of product
For those who manage their real estate as a cost center the claim that "we're not in the real estate business" was cited as the single most important rationale for the cost approach. Also
cited, but not as frequently, were reasons of facilitating the
recovery of real property expenses through the cost of goods
sold of the company's main products and a more equal allocation
of real estate expense across line operations through overheads.
(It should be noted that the claim "we're not in the real estate business" was usually accompanied by other reasons, such as the
ones just mentioned). Thus, while cost centers display a clear
bias in their view of the corporate real estate mission, it can
be seen that these firms do provide some rational and pragmatic foundations for their choice to operate from a cost basis. (For more on the role of corporate real estate in development and the
real estate industry see Thompson 1986, Bogorad 1984, Behrens
1982, Brown 1979, and Sigafoos 1976). Nevertheless, it is
interesting to note that very few firms (15%) reported that
their real estate units were not "sufficiently profitable by
nature" as a rationale for the cost approach.
Table B lists the motivations or rationales for operating as
a profit center.
Table D: Rationale for Profit Center
Generate revenue for overall corporate needs . . . . 66%
Increased efficiency of real estate resources . . . . . . 43%
More effective evaluation of property performance . . . 37%
Generate revenue for other real estate needs . . . . . . 26%
Tax purposes . . . 20%
Invest idle corporate funds . . . 17%
Induce competition with the market place . . . . . . . . 9%
* "other" . . . . . . . . . . . . . . . . . . . . . . . . 9%
Induce competition with other properties . . . . . . . . 3%
* = other rationales include: to attract qualified workforce;
creation of value; enhance community relations;
diversification of resources; residuals and shelter; reduce occupancy cost for line units; etc
For those who manage real estate as a profit center, using
real estate assets to generate revenue for overall corporate
purposes appears the be the most popular rationale or
motivation. The second most frequently cited motivations
--increased efficiency of resources and more effective evaluation of property performance -- seem a far cry from "being in the real estate business."
Profit centers in the sample displayed noticeably different
management priorties from the cost center firms. Table E
presents the primary activities reported by both groups.
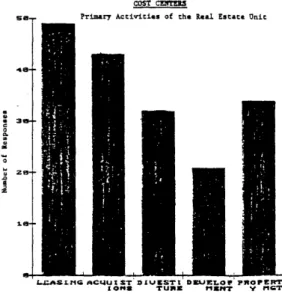
Table E: Primary Activities of Profit and Cost Centers
PROIT CEOT=S
Primary Activities of the Real Estate Unit
L]CASI NO CQUIS DI'jKII DE'JU LOP VROPEmr
10942 TURM MMEIr V -GT
So.
o0
0-.
COST CETRS
Primary Activities of the Real Estate Unit
L.LAZLZIGAiCLUZT'ILUKJSTI DgLIELOV PnOPERor I on* TUIRE MIE,5 V~ MGC
profit centers report higher involvement
with development activities and less with leasing, acquisitions,
and divestiture than cost centers. These differences may be
also be seen in Table F which lists the various real estate
responsibilities cited for both the real estate unit and the
line units with the organization.
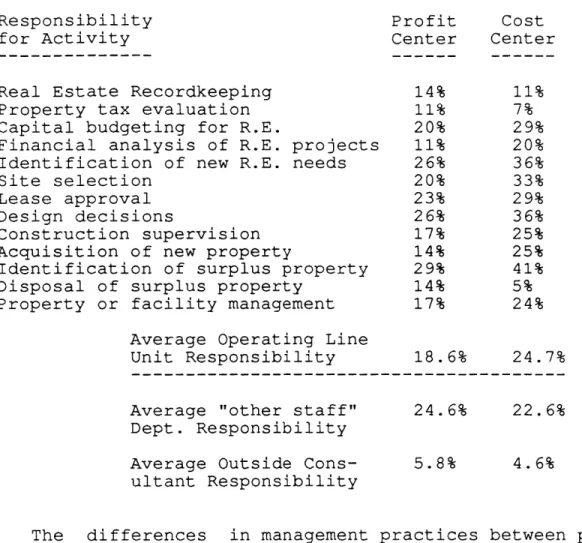
Table F: Real Estate Responsibility of Real Estate Unit and Line Unit
Responsibilities of the "Real Estate Unit"
Responsibility Profit Cost
for Activity Center Center
Real Estate Recordkeeping 60% 77%
Property tax evaluation 37% 31%
Capital budgeting for R.E. 77% 69%
Financial analysis of R.E. projects 80% 71%
Identification of new R.E. needs 86% 64%
Site selection 89% 92%
Lease approval 80% 93%
Design decisions 71% 76%
Construction supervision 54% 63%
Acquisition of new property 89% 91%
Identification of surplus property 80% 71%
Disposal of surplus property 89% 89%
Property or facility management 83% 71%
Average Real Estate
Unit Responsibility 75% 73.7%
Table F Continued ...
Responsibilities of the "Line Unit"
Responsibility Profit Cost
for Activity Center Center
Real Estate Recordkeeping 14% 11%
Property tax evaluation 11% 7%
Capital budgeting for R.E. 20% 29%
Financial analysis of R.E. projects 11% 20%
Identification of new R.E. needs 26% 36%
Site selection 20% 33%
Lease approval 23% 29%
Design decisions 26% 36%
Construction supervision 17% 25%
Acquisition of new property 14% 25%
Identification of surplus property 29% 41%
Disposal of surplus property 14% 5%
Property or facility management 17% 24%
Average Operating Line
Unit Responsibility 18.6% 24.7%
Average "other staff" 24.6% 22.6% Dept. Responsibility
Average Outside Cons- 5.8% 4.6%
ultant Responsibility
The differences in management practices between profit and
cost centers will be discussed in detail in Chapter II.
b. Inventory and MIS
Uncertainty over amount of buildings and land, owned and
leased, remains significant among the corporations surveyed.
Approximately 19% of the respondents were unable to specify area owned while 24% were unable to specify area leased. This seems
consistent with the findings that one in four firms does not
maintain a real estate inventory. Additionally, firms seem more likely to know the market value of their real estate (24% were
uncertain) than the original acquisition value (41% were
uncertain).
Beyond maintaining an inventory of real estate assets,
approximately two-thirds of the firms surveyed do not maintain
any separate management information system for the ongoing
management and control of these assets. The reasons for this
lack of data vary. Table G lists the most frequently cited
barriers for the survey sample.
Table G: Barriers for Developing Real Estate Inventory / MIS
Not cost justifiable . . . . . . . . . . . . . .. . . . 21%
Insufficient funding or manpower . o... .. .. .. .. 21%
Unfamiliar with available inventory/MIS systems 13%
Insufficient power vested in real estate group 13%
Real estate function too decentralized o.. . . ... 9%
Difficult to effect change in the organization . 7%
* "other" . . . 7%
Cannot convince top management . .. .. . . ... 4%
Resistance to new procedures by real estate staff 2%
Resistance to new information technologies by staff 1%
* = other barriers include: other corporate MIS priorities
supercede real estate; resistance to use by division staff; too small to need -- only 90 properties; etc.
While firms of all sizes reported insufficient funding and
manpower as a primary barrier for developing and operating these
information systems, smaller firms cited problems of justifying
cost; unfamiliarity with available systems; and insufficient
power vested in the real estate function. Larger firms, on the
other hand, cited problems with the real estate function being
too decentralized and difficulties with effecting change in a
large organization.
c. Real Estate Accounting
some form of internal rent to their departments, divisions or
line units. This ratio (67%) has changed little since 1981
(65%). Where internal rent is charged, the following methods are likely to be employed:
Cost recovery . . . . . . . . .
Fair market rent . . . . . . .
Differential pricing by occupant type . . . . . . . . Other . . . . . . . . 42% 34% 11% 6%
Over all, only 23% of the corporations responding charge fair
market rent to their departments. Other bases for imputing rent
- vary widely including averaged rents within geographic area,
cost of capital equivalent, actual cost plus facilities
mangement overhead, and averaged rental and operating cost for
all properties. Figure 5 displays the survey response.
Figure 5
I MTERMAL RENTS CHARGED
NO ANSWER OTHER DIFFERENTIAL PRICING COST RECOVERY FAIR MARHET nrENT NO
Property-by-property is the most popular accounting method
(51%), yet a full 28% account for their real estate operations
by category of property or in a pool. Another 23% do not
separately account for real estate operations at all. Thus, at
the corporate accounting level, only one-half of the
organizations surveyed bother to match individual real estate
expenses to actual properties. Obviously at some level in the
organization these expenses are budgeted, allocated, and
recorded. However, the survey data seems to suggest that, at
least in the aggregate, these expenses are not consistently
accounted for on an individual basis. Some latitude should also
be given to the respondent's interpretation of the question "How does your company account for its real estate operations?" and various forms of accounting that may be employed. For example,
cases where pooled accounting was cited might involve pooled
real estate funds or budgets and common procurement procedures
for several properties, yet the actual record-keeping process
may be conducted on a property-by-property basis. In any event,
a full 23 percent of the respondents report "no separate
accounting for real estate" and presumably are unable to account
for real estate expenses in any kind of consolidated or
organized fashion.
d. Real Estate Investment Analysis and Return
Rate of return on investment is the most popular method of
analyzing real estate investments among survey respondents.