HAL Id: hal-01238051
https://hal.inria.fr/hal-01238051
Submitted on 4 Dec 2015
HAL is a multi-disciplinary open access
archive for the deposit and dissemination of
sci-entific research documents, whether they are
pub-lished or not. The documents may come from
teaching and research institutions in France or
abroad, or from public or private research centers.
L’archive ouverte pluridisciplinaire HAL, est
destinée au dépôt et à la diffusion de documents
scientifiques de niveau recherche, publiés ou non,
émanant des établissements d’enseignement et de
recherche français ou étrangers, des laboratoires
publics ou privés.
J Araujo, Frédéric Giroire, J Moulierac, Yi Liu, R Modrzejewski
To cite this version:
J Araujo, Frédéric Giroire, J Moulierac, Yi Liu, R Modrzejewski.
Energy Efficient Content
Distribution.
The Computer Journal, Oxford University Press (UK), 2016, 59 (2), pp.192-207.
�10.1093/comjnl/bxv095�. �hal-01238051�
Energy Efficient Content Distribution
J. Araujo
1, F. Giroire
2, J. Moulierac
2, Y. Liu
3and R.
Modrzejewski
41
ParGO, Departamento de Matem´atica, Universidade Federal do Cear´a, Brazil
2CNRS, Laboratoire I3S, UMR 7172, UNS, CNRS, Inria, COATI, 06900 Sophia Antipolis,
France
3
JCP-Consult, France
4Google, Dublin, Ireland
Email: [email protected]
In order to optimize energy efficiency, network operators try to switch off as many network devices as possible. Recently, there is a trend to introduce con-tent caches as an inherent capacity of network equipment, with the objective of improving the efficiency of content distribution and reducing the network
congestion. In this work, we study the impact of using in-network caches and
content delivery network (CDN) cooperation on an energy-efficient routing. We formulate this problem as Energy Efficient Content Distribution, we propose an integer linear program (ILP) and a heuristic algorithm to solve it. The objective of this problem is to find a feasible routing, so that the total energy consumption of the network is minimized while the constraints given by the demands and the link capacity are satisfied. We exhibit for which the range of parameters (size of caches, popularity of content, demand intensity, etc.) it is useful to use caches. Experimental results show that by placing a cache on each backbone router to store the most popular content, along with well choosing the best content provider server for each demand to a CDN, we can save about 20% of power in average of all the backbone networks considered.
Keywords: Energy Efficiency, Integer Linear Programming, Content
Deliv-ery Network, In-network Caching, Future Internet.
1. INTRODUCTION
Energy efficiency of networking systems is a growing concern due to both increasing energy costs and worries about CO2 emissions. In [1] it is reported
that Information and Communication Technology sector is responsible for up to 10% of global energy consumption and 51% of this amount is attributed to telecommunication infrastructure and data centers. Thus, backbone network operators study the deployment of energy-efficient routing solutions. The general principle is to aggregate traffic in order to be able to turn off as many networking devices as possible [2, 3, 4, 5].
On the other hand, to reduce the network load and improve the quality of service, content providers and network operators have interest in disaggregating traffic by replicating their data in several points of the network in order to reduce the distance between the required data and their users. Recent years have seen, along the growing popularity of video over Internet, a huge raise of traffic served by Content Delivery Networks (CDNs). These kinds of networks operate by replicating the content among its servers and serving it to the end users from the nearest one. CDNs deliver nowadays a large part of the total Internet traffic: estimation ranges
from 15% to 30% of all Web traffic worldwide for the single most popular CDN [6]. Chiaraviglio et al. [7, 8] have shown how the choice of CDN servers impacts the backbone energy consumption. More precisely, they aim at turning off network devices by choosing, for each demand from a client to a content provider, the best server of this CDN while being energy aware.
Here, we go further on this idea by also considering the usage of caches on each of the backbone routers, while still taking into account the choice of CDN servers. It is important to mention that there have been several proposals for developing global caching systems [9]. In particular, it was recently proposed to use in-network storage and content-oriented routing to improve the efficiency of content distribution by future Internet architectures [10, 11, 12, 13]. Among these studies, we mention that in this paper we do not assume any specific technology for future Internet architectures, nor anything else that would require major overhaul of how the Internet works with no content routing among our caches. We assume that a cache serves a single city, taking all of its contents from the original provider. We consider that caches can be turned on or off. Thus, there is a trade-off between the energy savings they allow by reducing network load and by their own energy
consumption.
We propose an Integer Linear Programming (ILP) formulation to reduce energy consumption by using caches and properly choosing content provider servers, for each demand. We implemented this formulation on the ILP solver CPLEX [14] version 12 and made experiments on real network topologies that we obtained from SNDlib [15] and we also tested on random instances generated from Erd˝os-R´enyi [16] graphs. We study the impact of different parameters: size of caches, demand intensity, network size, etc. In particular, we found that efficient energy gains can be achieved, in our scenarios, by caches of the order of 1 TB and larger caches do not lead to significantly better gains.
Experimental results show potential energy savings of around 20% by putting devices to sleep during low-traffic period. If CDN is considered but without caches, there are 16% savings, and in the opposite, when caches are introduced within the network without CDN, there are also around 16% savings. Furthermore, we observed that the impact of caches is more prominent in bigger networks. To be able to quantify this effect, we propose an efficient heuristic. This heuristic, called Spanning Tree Heuristic, allows us to obtain feasible solutions much faster than solving the ILP model we propose by using CPLEX. Another advantage of the heuristic is that it accepts a parameter that controls a speed/quality trade-off.
The main take away of our work is that, by storing the most popular content in caches at each router and by choosing the best content provider server, we may save around 20% of power in backbone networks. Moreover, using caches enables us to find feasible solutions where the no-cache algorithm fails as it would need more bandwidth capacity on links to satisfy the same given demands.
The paper is organized as follows. We discuss the related work in Section 2. We present the problem and its formulation in Section 3. Section 4 describes how we build the instances that we used in our experimentations. Finally, we present the experiments we did and we discuss the obtained results in Section 6.
2. RELATED WORK
There are several studies on the literature proposing different strategies to reduce energy consumption. For instance, a model that proposes to shut down individual links is studied in [5]. An interesting way of performing energy savings in a distributed manner is shown in [4]. Energy efficient CDNs have also been studied recently. Authors in [17] propose to reduce the energy consumption in CDN networks by turning off CDN servers through considering user SLAs. In order to optimize the power consumption of content servers in large-scale content distribution platforms across multiple ISP domains, the strategy proposed in [18] is to put servers into sleep mode without impacting on
content service capability. Our work is different from all these previously mentioned works, since they do not consider in-network caches.
Network caches have been used in global caching systems [9]. In recent years, several Information Centric Networking architectures, such as Cache and Forward Network (CNF) [10], Content Centric Networking (CCN) [12], CacheShield [19] and NetInf [11], have exploited in-network caching. Their objectives are to explore new network architectures and protocols to support future content-oriented services. Caching schemes have been investigated in these new Internet architectures [10, 20, 21, 22, 23]. A recent survey [24] on caching in information centric networking presents ideas to reduce cache redundancy and improve the availability of cached content. Similar to our work, these works also use in-network caches, however they do not consider energy savings.
Energy efficiency in content-oriented architectures with an in-network caching has been recently stud-ied [25, 26, 27]. In [25], the authors analyze the energy benefit of using CCN in comparison to CDN networks. A further work considered the impact of different mem-ory technologies on energy consumption [27].
Two works also propose the addition of network caches to backbone routers that work transparently with current Internet architecture and they have optimal placement during peak hours for such caches in the access network [28, 29]. These works focus on the energy efficiency considering data delivery and storage, however, they do not take into account the energy savings by turning on/off network links. Authors in [26] extend GreenTE [2] to achieve a power-aware traffic engineering in CCN network.
The work from Chiaraviglio et al. [7, 8] is, to the best of our knowledge, the most related to ours. They propose to enable the cooperation between network operators and content providers in order to optimize the total energy consumption by using an ILP formulation for both sides. In this paper, we consider an extension of this optimization problem formulation, through considering in-network caching.
This work is the long version of the conference paper [30].
3. PROBLEM MODELING
We discuss in this section the model parameters, the formal definition of the problem and a Mixed Integer Linear formulation.
Let us first informally recall the problem description and some of our assumptions. Our goal is to save energy on a backbone network by aggregating traffic and turning off as many devices as possible. We consider a set of demands between pairs of routers and a set of demands from CDN servers to their clients. We also consider that the traffic from a CDN can be satisfied by any of its servers, which are placed in
different backbone routers. Thus, these demands have a single destination, the client, but several possibilities for the source that will be chosen among all the servers for the given CDN. Moreover, we suppose that each backbone router has a cache, with a limited amount of storage, that can only be used to satisfy demands to its router. Our goal is to satisfy the set of all demands, under the capacity contraints of CDN servers, caches and links, while minimizing the global energy used to power on the links and caches of the network.
3.1. Parameters
We model the network as a graph G = (V, E), with a link capacity function c : E → R+. Each node v ∈ V (G)
represents a router (or set of routers) located in a city and each edge represents a telecommunication link (or set of links) between two cities. We are also given a set of content providers P , e.g, Google, Amazon, etc. The subset of vertices of V (G) containing the servers of content provider p ∈ P is given by the function S(p) ⊆ V (G). We denote by sl
p the server of content
provider p placed in location l ∈ S(p). It has a capacity cap(sl
p). A summary of the notations used throughout
the paper can be found in Table 1.
We are given two kinds of demands: city to city and content provider to city demands. A single demand model the aggregation of all the demands of the clients within a city. We denote by Ds→t, ∀s, t ∈ V , the traffic
that has to be routed from city s to city t. We denote by Dp→t the traffic that has to be routed from content
provider p to city t, for every t ∈ V, p ∈ P .
The data is replicated at each node of S(p) and a server of content provider p can serve any demand to p. Finally, each node v ∈ V (G) in the network has a cache of bandwidth capacity cap(v). Caches are characterized by parameters: α – what part of a demand can be provided from cache; β – peak power consumption of a cache (link power consumption is normalized to 1); γ – fraction of β that is consumed by an idle cache.
For in-network caches, there is still an important open question: if and how they should be deployed. Therefore, we avoid making specific assumptions about these details. Once this question is answered, the model we propose can be updated to answer any possible specific concerns. However, the conclusions can change, if the actual parameters vary heavily from our estimates.
Cache hit rate As we mentioned, we consider that there is a cache located in each router that will keep the most popular content and it is going to save a fraction of any demand to that router. This fraction is represented by the parameter α and establishing a value for this fraction is a non-trivial task. According to [31], content popularity follows a Zipf-like distribution. In their study, they considered a traffic trace towards
1010 1011 1012 1013 1014
Cache size [bytes] 0 10 20 30 40 50 60 70 80 90 Cac he hit rate [%] LRU Static
FIGURE 1: Cache hit ratio for YouTube trace, assuming average video size 100MB, following the results in [31].
Youtube. This trace can be considered as a good approximation of a typical traffic because today’s traffic is mostly due to video traffic. Cisco estimates that all forms of video traffic will account to 80 and 90% of the total Internet traffic by 2018 [32]. They computed the relation between cache size and cache hit rate for the traffic. Note that this relation does not depend on the number of cache accesses, but it depends only on the relative size of the cache and all the content collection. This relation is shown in figure 1, with the assumption that an average video is 100 MBytes. This figure shows results for two algorithms: least recently used, a classic caching algorithm, and static most popular, a simple algorithm proposed by the authors. For example with a cache of around 800GB the expected hit rate is around 17.7% using LRU and around 32.5% using the static algorithm, thus saving an equivalent fraction of traffic. As the situation changes frequently, both regarding to the volume of popular content and available storage, we leave this fraction as a parameter of the model: α – the maximal part of any demand that can be served from a cache. Network operator can establish it empirically, by means of measurements. Typically, we consider α ∈ [0.2, 0.35] for our experiments.
Note, that the legal issue for the operator of caching content provider’s traffic is discussed in Section 7. Power usages In our model, we deal with two types of equipment: links and caches. In practice, main energy drain of links are port cards and amplifiers. As can be seen in Powerlib [33], power requirements of single port cards suitable for long haul networks are well over 100W, while other backbone cards can be as few as a quarter of that.
For caches, we considered a possible implementation using SSD storage as proposed in [34, 35]. Fast mass storage with current SSD or High Speed SSD offer 1TB (resp. 10TB) of storage accessed in 10000ns (resp. 1000ns) while consuming below 10W (resp. 50W) of power.
Note that reported power consumptions vary in the literature. In [36], it is reported a power consumption of 174W per Gbps for a whole core
Notation Description
V set of cities
E set of links
P set of content providers (e.g. Google, Amazon, ...)
S(p) locations of the servers of content provider p, e.g. S(Google) = {Berlin, M unich}
α part of a demand can be provided from cache
β peak power consumption of a cache (link power consumption is normalized to 1)
γ fraction of β that is consumed by idle cache.
Ds→t traffic from city s to city t, ∀s, t ∈ V
Dp→t traffic from content provider p to city t
cap(v) (bandwidth) capacity of cache v
cap(slp) capacity of the server of content provider p located in node l ∈ S(p)
cap(uv) capacity of link uv
Variables
xuv link uv used or not (1 or 0)
yu cache u used of not (1 or 0)
zv load of the cache of router v (between 0 and 1)
cs→t cached part of traffic Ds→t
cp→t cached part of traffic Dp→t
fu,vt flow on edge uv corresponding to traffic going to t
dlp→t demand served from server l for traffic from p to t
TABLE 1: Problem notations and variables of the model formulation.
router (chassis and line cards included), while [37] reports only 12.5W per Gbps. Since there are different numbers corresponding to different materials and different experiments mentioned in the literature, and also to take into consideration future evolution of the materials, we considered a range of power consumption for caches and links. In our model, we use the ratio between the consumption of caches and links as a parameter denoted by β – the power consumption of a cache divided by the power consumption of a link. In our simulations, we take β ∈ [0.0, 2.5]. This interval takes into account the possible combinations of values listed above.
3.2. Energy Efficient Content Distribution: problem definition and formulation
Let us first formally define our optimization problem, Energy Efficient Content Distribution. The goal of our problem is to find a feasible routing in G satisfying all the demands Ds→t and Dp→s under
the capacity constraints c(u, v), cap(sl
p) and cap(v)
while minimizing the total energy consumption of the network. By total energy consumption, we mean the energy used by the activated links plus the energy used by the activated caches. For each cache, despite of a fixed energy cost of turning it on, we also consider an increased usage of energy in terms of its load. Our optimization problem belongs to the family of Location-Routing Problems, in which, given a set of clients, demands, depots, vehicles and routes, a company has to determined which depots to open and which routes to follow. We refer the reader to [38, 39] for surveys on this problem.
We use a typical model, from the perspective of a
backbone provider, where aggregated traffic between cities is expressed as a demand matrix. We augment this matrix to represent not only cities, but also content providers. This is motivated by the fact that content providers generate traffic that can easily be equal to the one of a entire city.
First, we define a variable xuv to indicate if the link
uv is turned on or off, for every {u, v} ∈ E. We use a variable yv to indicate if the cache at router v is turned
on or off, for every v ∈ V , and this cache uses at most β units of energy. Finally, we recognize that mass memory access can constitute a significant energy cost. Thus, we use a variable zv to indicate the load (fraction of
used bandwidth) of the cache in router v. We assume that an idle cache uses fraction γ of β and its power consumption grows linearly with load to reach β once fully utilized. The objective function is then written formally as: min X {u,v}∈E xuv+ X v∈V βγyv+ X v∈V β(1 − γ)zv.
Denote by Ds→t and Dp→t the traffic to destination
node t posed in the problem instance, respectively from other cities s ∈ V and content providers p ∈ P . A cache in a destination router t, when turned on, allows to save a portion of any demand up to α, call these savings respectively cs→t and cp→t. We will consider reduced
demands, denoted R, which are the input demands with the caching savings subtracted:
Rs→t= Ds→t− cs→t , ∀s, t ∈ V,
cs→t≤ αDs→t , ∀s, t ∈ V,
Rp→t= Dp→t− cp→t , ∀t ∈ V, p ∈ P,
cp→t≤ αDp→t , ∀t ∈ V, p ∈ P.
Then, we record the load of the cache at node t: X s∈V cs→t+ X p∈P cp→t= zt , ∀t ∈ V.
Finally, the load cannot exceed the capacity and it needs to be zero if cache is off:
zt≤ ytcap(t) , ∀t ∈ V.
Each node t ∈ V demands from each provider p ∈ P an amount of data flow Rp→s ≥ 0. The provider p has a
set of servers located in a subset of nodes of the network S(p) ⊆ V . We denote by sl
p the server of the provider
p located in node l ∈ S(p). Each of those servers sends dl
p→tflow units to collectively satisfy the demand:
X
l∈S(p)
dlp→t= Rp→s , ∀t ∈ V, p ∈ P.
Each server sl
p has a constrained capacity cap(slp),
which limits the demands it can satisfy: X
t∈V
dlp→t≤ cap(sl
p) , ∀p ∈ P, l ∈ S(p).
For the flow constraints, we denote by fu,vt the flow on
edge {u, v} corresponding to traffic going to t. X v∈Nu fv,ut − X z∈Nu fu,zt = = ( −P p∈PRp→t− P s∈V Rs→t u = t
Rt→u+P{p∈P |u∈S(p)}dup→t otherwise,
∀t, u ∈ V.
Finally, we consider capacities of links, denoted cap(uv). The constraints involve both kinds of flows and the on/off status of the links:
X
t∈V
(fu,vt + fv,ut )+ ≤ cap(uv)xuv , ∀{u, v} ∈ L.
All variables are non-negative real numbers, except for xuv and yv which admit only values in {0, 1}.
3.3. Spanning tree heuristic
Since CPLEX was not able to solve the ILP model that we just described for bigger instances, we describe here a polynomial-time heuristic to our problem. For instance, for a random network with 150 cities and 300 links, CPLEX was not able to produce any feasible solution within two hours, while the proposed algorithm can give a good feasible solution within two minutes.
Our heuristic is an iterative algorithm that, at each step i ≥ 0, computes an optimal (fractional) solution si
for the relaxation of our model and fixes the value of some variables of the model corresponding to the usage of links and caches (i.e. the integral variables xuv and
yv). When we say that we fix a variable x to a value
c ∈ {0, 1} at step i, we mean that we add a constraint x = c to the model used to compute sj, for all j > i.
At the first step 0, our heuristic computes a solution s0 of relaxation of the model. Then, by setting the
weight of each edge to be the value of its corresponding variable in s0, a maximum spanning tree T of the input
network graph G is computed and all the variables xuv
of all the edges uv ∈ E(T ) are fixed to one.
After this initialization step, the heuristic solves, at each step i > 0, the relaxation of the model (where several variables have already fixed values) to get an optimal solution si. Then, if some other variables xuv
or yv have value v ∈ {0, 1} in the solution si, these
variables are fixed to this value v. Finally, at least one most loaded device is forced to be turned on. To speed up the process, the heuristic has a parameter S. At each step i, we also fix S fraction of the highest value variables xuv or yv whose values v are in 0 < v < 1
to one. Once all the integer variables are fixed, the relaxation is solved one last time. This gives a valid solution to the Integer Linear Program.
The heuristic has been implemented in Java and it can be downloaded as open source5. Note that we use
CPLEX to solve the relaxations of the model at each step of the heuristic. The performance of this heuristic is analyzed in Section 6.
On the complexity of the heuristic algorithm The model we propose has a polynomial number of constraints on the size of the input. It is well-known that its relaxation can then be solved in polynomial time. The number of devices whose variables have to be set to 0 or 1 by our heuristic is n caches (one at each node) plus m edges. The first iteration puts n − 1 edge variables to 1. When a variable is set to 0 or 1, it is not reconsidered during the algorithm execution. Hence, the number of relaxations solved, i.e. of steps of the heuristic, is bounded by m + 1.
4. INSTANCE GENERATION
To validate our model and algorithms and to explore the potential energy savings, we needed to build realistic instances. That is we had to set up network topologies, traffic matrices, CDN infrastructure with server capacities and locations for these CDN servers inside the network topologies.
The Survivable fixed telecommunication Network Design (SND) Library (SNDLib [15]) contains a set of real network topologies, and we use three of them with considerably different size for our simulations:
• Atlanta – |V | = 15, |E| = 22, unidentifiable cities • Nobel-EU – |V | = 28, |E| = 41, major European
cities
Popularity Server capacity Server locations
CDN1 40 0.3 Berlin Hamburg Duesseldorf Frankfurt Muenchen Nuernberg
CDN2 20 0.45 Berlin Duesseldorf Frankfurt Muenchen
CDN3 15 0.6 Berlin Frankfurt
CDN4 15 0.5 Hamburg Frankfurt Muenchen
CDN5 10 0.2 Berlin Duesseldorf Frankfurt Hamburg Muenchen Nuernberg
Osnabrueck
TABLE 2: Content Distribution Networks assumed for the Germany50 network.
• Germany50 – |V | = 50, |E| = 88, major German cities
Usually, Content Distribution Networks locate their servers in Internet Exchanges and major Points of Presence, to minimize the network distance to the end users. Locations of such points are publicly known. Thus, for topologies with clearly identifiable cities, we have ready sets of candidate locations for CDN servers. The number of servers is heterogeneous and we try to arrange it into distinct classes in regard to popularity/server capacity proportion, i.e. there can be networks with many small servers, or few strong ones.
We used a population model to build the traffic matrices of the demands between cities. We assume that, in average, people among the cities behave similarly. Thus, the total amount of demands originating from a city is proportional to its population. If cities cannot be identified, the population is assumed to be distributed uniformly. There is roughly the same amount of demands toward each content per thousand people everywhere. Similar uniformity is assumed for demands between cities, bigger cities attract more demands than the small ones. Then, we augmented matrices with the demands towards content providers. Obtaining exact figures about CDN market shares and operational details is out of scope of this study. Still, we explored the publicly available information, e.g. [6], to come up with a list of the major providers. Each of the networks is assigned a popularity, which is based on market share either claimed by the company or media. Table 2 exemplifies CDN specification used in the germany50 network. Server capacity means what part of total demand towards a network can be satisfied by the infrastructure in a single location. For example, just two servers with capacity 0.5 can satisfy all demands towards CDN4.
The process of obtaining the instance files has been automated by a set of Python scripts, which we make freely available6. A more detailed description of
the instance generation can be found in the research report [40].
6http://www-sop.inria.fr/members/Remigiusz.
Modrzejewski/software.html
5. VALIDATION OF THE HEURISTIC
AL-GORITHM
In order to validate the Spanning Tree Heuristic, we compare its performance to solving the integer model directly with CPLEX. We focus on showing the impact of the parameter S, which governs the speed/quality trade-off, on the three chosen examples.
5.1. Comparison of the heuristic and the ILP Table 3 displays the performance comparison using the values of the objective function and also the wall-clock time taken by the computation on an Intel i7-powered computer.
The ∆ columns show, respectively, the ratio between ILP and heuristic for the cost of the solution and for the computation time. The heuristic parameter S is set to 0.2. This choice is discussed in the next section.
First, notice that for very small networks it is feasible to solve the ILP optimally. This is exemplified by the 15-node Atlanta network. The optimal solution is found within two seconds. Interestingly, the running time grows for lower traffic. Indeed, we believe that the set of feasible solutions for high values is smaller and CPLEX can prove the optimality gap much faster. The solutions that were given by the heuristic are close to the optimum, while the time needed to find them is much shorter. Still, for networks of this size, we would strongly recommend solving the ILP model directly.
For networks having up to 30 nodes it is still feasible to find optimal solutions. However, the cost in terms of time to obtain an optimal solution is rather high, while closing the gap to the lower bound becomes impractical for low traffic. Thus, we set a limit of 5 minutes to obtain near-optimal results. On the other hand, Spanning Tree Heuristic provides its solutions in under two seconds. Again, by choosing the heuristic, we accept only a slight increase in consumed energy. Precisely, for Nobel-EU, with high traffic, the heuristic obtains a solution within 12% of the optimum, while saving 99.8% of the computation time.
In medium-sized networks, such as Germany50, finding exact solution becomes impractical. Spanning Tree Heuristic obtains a slightly better solution than the ILP, while taking only 3% of the running time, in the case of high traffic. In the other cases it is still not far quality-wise, while taking negligible time.
Topology |V | |E| Total energy [lc] ∆ Computation time [s] ∆
Model Heuristic Model Heuristic
Atlanta (high traffic) 15 22 18.8? 19.0 1% 1.5 0.6 60%
Atlanta (medium traffic) 15 22 16.6? 18.6 12% 5.2 0.6 88%
Atlanta (low traffic) 15 22 14.1? 14.4 2% 34.4 0.6 98%
Nobel-EU (high traffic) 28 41 31.4? 35.1 12% 1075 1.8 99.8%
Nobel-EU (medium traffic) 28 41 28.4 32.2 13% 300 1.3 99.9%
Nobel-EU (low traffic) 28 41 27.9 30.2 8% 300 1.1 99.9%
Germany50 (high traffic) 50 88 69.7 69.0 -1% 300 8.5 97%
Germany50 (medium traffic) 50 88 54.2 61.6 14% 300 5.0 98%
Germany50 (low traffic) 50 88 50.0 56.2 12% 300 2.9 99%
Random 150 300 No solution 203.7 — 7200 127.8 —
TABLE 3: Comparison of results given by the Spanning Tree Heuristic (labelled Heuristic) and by solving the model directly with CPLEX (labelled Model ). The ? symbol denotes optimal solutions.
Finally, we take a big random instance. The topology is a 2-connected Erd¨os-Renyi graph, with 150 nodes, an average degree of four and one CDN with fifteen servers. Each city issues demands only to seven other cities. The overall traffic level is medium (demand ratio 4.0), as these kind of instances are prone to bottlenecks, which could render higher traffic levels unrouteable. It is infeasible to directly obtain any integer solution of the model. After two hours CPLEX was not able to propose even a trivial solution (e.g. turning on all the devices). Spanning Tree Heuristic, in just above two minutes, gives a solution that is 35.8% over the trivial lower bound of a minimal connected network.
To conclude, we say that the Spanning Tree Heuristic is clearly the better choice for big networks. For small to medium-sized ones, its results are always reasonably good, while its running time is very short. Therefore, it is a viable choice whenever the computation time is an issue.
5.2. Speed/quality trade-off of the Spanning Tree Heuristic
As stated in Section 3.3, the parameter S governs an execution speed versus quality of solution trade-off for the Spanning Tree Heuristic. We investigate its influence in this section.
First, recall that S determines the fraction of undecided variables to be fixed to an integer value within an iteration. Setting S to zero means turning on devices one by one. It is easy to see how increasing S reduces the number of iterations. To comprehend how it can decrease the quality of obtained solution, imagine a simple example, that represents a fragment of an instance. Take two cities with two disjoint paths and one demand between them. Let the value of that demand be equal to bandwidth of a link. One valid solution of the relaxation can be splitting the demand in half and routing both halves along both paths. The optimal integer solution for this case is all the flow going through one route, the links of the other turned off. If
S = 0, then after the first step one link will be turned on. The only possible solution of the relaxation will route all the traffic through the path containing this link. Thus, the solution found by Spanning Tree Heuristic will be optimal. However, if S > 0 and two links are turned on in the first step, then it is possible the two links will be on different paths. Thus, the integer solution will have some unnecessary links turned on. In the extreme case of S = 1 all devices will always be turned on.
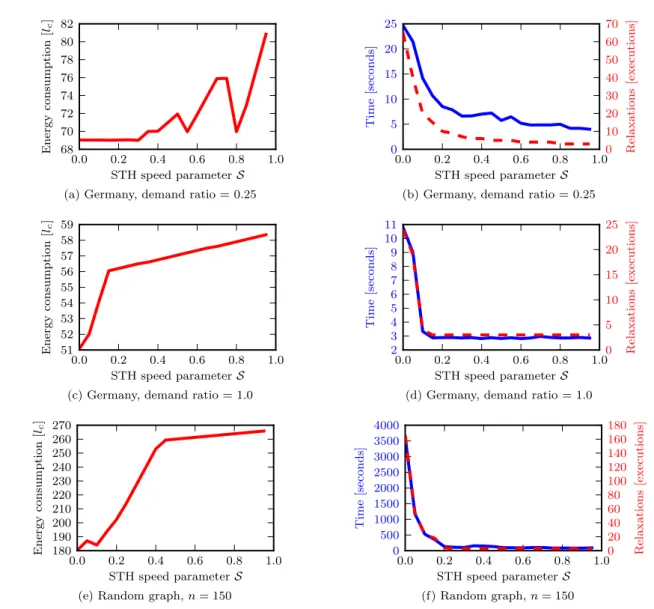
On figure 2, the x axis determines the value of parameter S for the three presented examples. The left column plots the value of the objective function in integer solutions. The right column shows computational costs, both in terms of wall clock time in seconds (solid blue lines) and number of relaxations solved (dashed red lines).
First, look into an instance based on maximum traffic sustainable in the Germany50 network. Solutions obtained are displayed on figure 2a. Recall that the value found by a solver for this instance was 69.7 energy units. Taking between 24 and 8 seconds, Spanning Tree Heuristic with S ≤ 0.3 obtains solutions with 69.0 units. This means it is in this case both faster by an order of magnitude and gives a marginally better solution. Note that even at S = 1 not all devices are turned on. This is because, after freezing the spanning tree, some devices get turned off before all the undecided ones are turned on. Looking at figure 2b, we see that the number of relaxations solved and the running time are falling drastically for S ≤ 0.2. Then, they decrease more slowly, with 6 seconds at S = 0.5 and 4 seconds at S = 1.0.
Second, we assign to the same network a small load, that still does not allow for routing on a spanning tree (which would be a trivial case for the heuristic). With model given directly to a solver, we have obtained in 5 minutes a solution with value 50. Figure 2c shows that the best solution found by Spanning Tree Heuristic is still one unit worse and can deteriorate by almost
0.0 0.2 0.4 0.6 0.8 1.0 STH speed parameterS 68 70 72 74 76 78 80 82 Energy consumption [lc ]
(a) Germany, demand ratio = 0.25
0.0 0.2 0.4 0.6 0.8 1.0 STH speed parameterS 0 5 10 15 20 25 Time [seconds] 0 10 20 30 40 50 60 70 Relaxations [executions]
(b) Germany, demand ratio = 0.25
0.0 0.2 0.4 0.6 0.8 1.0 STH speed parameterS 51 52 53 54 55 56 57 58 59 Energy consumption [lc ]
(c) Germany, demand ratio = 1.0
0.0 0.2 0.4 0.6 0.8 1.0 STH speed parameterS 2 3 4 5 6 7 8 9 10 11 Time [seconds] 0 5 10 15 20 25 Relaxations [executions]
(d) Germany, demand ratio = 1.0
0.0 0.2 0.4 0.6 0.8 1.0 STH speed parameterS 180 190 200 210 220 230 240 250 260 270 Energy consumption [lc ]
(e) Random graph, n = 150
0.0 0.2 0.4 0.6 0.8 1.0 STH speed parameterS 0 500 1000 1500 2000 2500 3000 3500 4000 Time [seconds] 0 20 40 60 80 100 120 140 160 180 Relaxations [executions] (f) Random graph, n = 150
FIGURE 2: Impact of the parameter S, left column plots the energy consumption of obtained designs, while right column plots the computational cost.
0.0 0.2 0.4 0.6 0.8 1.0
α: cache hit rate 0 5 10 15 20 Cac hes
(a) Cache usages; thick line marks the number of caches turned on, thin lines below their total load.
0.0 0.2 0.4 0.6 0.8 1.0
α: cache hit rate 30 40 50 60 70 80 Links (b) Link usages. 0.0 0.2 0.4 0.6 0.8 1.0
α: cache hit rate 68 70 72 74 76 78 80 Energy consumption [lc ]
(c) Total energy consumption.
FIGURE 3: Results as a function of parameter α (cache hit rate) for Germany50. Power consumption is reported with a normalized unit equal to the power used by a network link.
eight further units. On the other hand, the maximum time taken by Spanning Tree Heuristic is 10.8 seconds. For S = 0.1 it is already 3.3 seconds, reaching
2.8 at S = 1.
Finally, we present results for the same random graph as in the previous section. Looking at figure 2e, we see
that there is significant but steady increase in energy consumption until S = 0.4. At that point, the value objective function is nearly saturating, at 1.44 times the value for S = 0. On the other hand, figure 2f shows that there is a sharp decrease in computational cost until S = 0.2. As the objective value at that point is not far from the best known value, we deduce that this is a reasonable value of S for fast solving of big instances. Note that when solving the model directly, CPLEX 12 is not able to produce any integer solution within reasonable timespan of two hours. The only lower bound on the objective value we know comes from the fact, that the network needs to be connected, meaning at least 149 links. The heuristic, with S = 0, is at most within 20.8% from this solution.
6. RESULTS
In this section, we investigate the potential energy savings of our solution on realistic networks. We exhibit the impact of the cache, CDN and network parameters, such as cache size, number of CDN servers, or route lengths.
Note on units and presentation of the results. In order to avoid choosing values that correspond to specific network equiments and architectures, we present the results with normalized units. Nevertheless, we also give default values to allow an easier translation to practical units.
Power consumption in the results is given in normalized power units equal to the power used by one network link. To translate it into watts, we used the default value of lc = 100 W. Recall that the power
consumption of a cache is then given by the parameter ratio β. For example, a value of β = 0.5 represents a consumption of 50 W for the SSD cache, using the link default value.
Demand values are also presented using a normalized unit equal to the total capacity of a single link, by a demand ratio. A demand ratio r represents a demand equal to a fraction1/rof the link capacity. To translate
it in into GB, we used the typical value of 10 Gbit/s for the link capacity. As an example, a demand ratio of 2 between two cities stands for a demand of 5 Gbit/s. 6.1. Impact of cache parameters
In this section, we exemplify the impact of parameters of the cache. We look into how the obtained network designs differ on changing values of the cache hit rate α and of the cache power usage β. We show the results mainly for the Germany50 network as the curves have similar shape for the other two networks and can be found in [40]. The demand ratio is set to 0.3, which represents high traffic. Note that the curves of the figures present some some local peaks that are due to the heuristic nature of the algorithm launched on a single network. Nevertheless, these spikes do not
prevent from exhibiting some strong general trends that are confirmed by experiments on other networks, see for example figure 5.
First, we look at the effects of changing the parameter α, shown in figure 3. Recall, that it limits what part of any single demand can be served from a cache. We see in figure 3(c) that, as expected, when cache efficiency increases, more power is being saved, from around 79 to 70 units of power. Note that once about 15% of traffic can be cached (corresponding to 71 units of power), further gains are highly diminished. This can be done with about 800 GB of cache, as mentioned in Section 3.1, using a LRU policy, or a lower amount with a more efficient policy policy. Figure 3(a) and (c) show how the power usage is distributed between caches and links. As the cache efficiency increases, more caches are used from few units to 20. This allows to turn off network links from 77 to 57, and save energy. Note that the value for a cache hit rate α = 1 is singular and does not correspond to a real situation but to a limit one. Indeed, in this case, as all traffic may be served from cache, the network is no more connected. Finally, we plot the cache load with a thin line in figure 3(a). The cache load is the total traffic served by caches normalized by the capacity of a single cache. A value of 1 means that all caches work at full capacity. We see that cache load mimics the cache usage in this experiment. This is not the case in the following one.
Figure 4 shows the effects of changing maximum cache power usage, β. As we can see in figure 4(c), when the caches consume no energy, the network uses 60 units of power. Then it raises, through 63.4 for β = 0.1, to 69.7 for β = 0.5. After this point, further increases to β have little effect, not increasing past 74. Indeed, at this point caches simply get turned off as they consume too much energy compared to links. Indeed, as shown in figures 4(a) and (b), when β = 0, all caches (50, one per node) are turned on, and only 60 links are necessary to route the traffic. The cache usage then decreases sharply when β increases: when the value of β is at 0.1, the total cache load (thin line on the plot), has dropped to less than 10. The cache usage is still high, 42, but then decreases to less than 20 for values of β larger than 0.5. In parallel to a lower cache usage, the number of network links that have to be turned on increases, from 60 to around 70.
Figure 5 shows combined effects of both parameters for three networks, Atlanta, Nobel-EU and Germany50. Traffic is set to the highest level which is feasible without caches. We compute the corresponding power consumption with caches disabled (71 units of power for Germany50) and use it as a baseline. For each pair of parameters α and β, energy savings relative to that baseline are mapped to a color and displayed in appropriate region of the figure. The darker the color the higher the savings. As examples, when α = 1 and β = 0, the whole traffic is served from caches using no energy, thus the energy savings are 100%. When α = 0
0.0 0.5 1.0 1.5 2.0 2.5 β: cache power / link power 0 10 20 30 40 50 Cac hes
(a) Cache usages; thick line marks the number of caches turned on, thin lines below their total load.
0.0 0.5 1.0 1.5 2.0 2.5
β: cache power / link power 60 62 64 66 68 70 Links (b) Link usages. 0.0 0.5 1.0 1.5 2.0 2.5
β: cache power / link power 60 62 64 66 68 70 72 74 Energy consumption [lc ]
(c) Total energy consumption.
FIGURE 4: Results as a function of parameter β (cache power / link power) for Germany50.
0.0 0.5 1.0 1.5 2.0
β: cache power / link power 0.0 0.2 0.4 0.6 0.8 1.0 α : max part of flo w cac hed 10−2 10−1 100 (a) Atlanta 0.0 0.5 1.0 1.5 2.0
β: cache power / link power 0.0 0.2 0.4 0.6 0.8 1.0 α : max part of flo w cac hed 10−2 10−1 100 (b) Nobel-EU 0.0 0.5 1.0 1.5 2.0
β: cache power / link power 0.0 0.2 0.4 0.6 0.8 1.0 α : cac he hit rate 10−2 10−1 100 (c) Germany
FIGURE 5: Part of power consumption saved by introducing caches with various parameters. Baseline is network power consumption without cache.
no traffic is served from caches, and the energy savings are 0%. We can see similar impacts of the parameters among different networks.
- Unsurprisingly, in all the instances, potential savings resemble the distance from the point (α = 1, β = 0).
- There is a very sharp decrease of the energy savings with the increase of the cost in energy of a cache (parameter β) and
- a sharp decrease of the energy savings with the hitting rate (parameter α).
- The main region of energy savings is for α between 0.2 and 1 and β between 0 and 0.3.
- An important point is that we see practically no gains with caches that use more energy than a link (β > 1.0), no matter how much traffic can it save. - On the contrary, a very low energy cost of caches (β < 0.1) allows savings over 20% (and over 50% for both Germany and Atlanta networks).
The heatmaps confirm that the results presented for our “example” network, Germany50, can be considered typical.
6.2. Impact of CDN parameters
Then, we investigate the impact of the cooperation with CDN, shown on figure 6. . Figure 7 shows the evolution of energy consumption as a function of what part of all demands are directed towards CDN networks. The demand ratio for this plot is set to 0.33, for the same reasons previously exposed. Results with and without caches are compared. As we can see, introducing cooperating content providers to a network without caches is highly beneficial. In the extreme case when all traffic would be served by CDNs, energy consumption would decrease by 27.4%. At today’s claimed values this number is still 16.4%. Then, introducing caches to a network without CDN gives 16.7% savings. There remain 8.0% savings at today’s CDN popularity. What may be a bit surprising, there are still 6.6% savings by introducing caches when 100% of traffic is served by the Content Delivery Networks. Finally, comparing network without CDN nor caches, to network with 50% of traffic served by CDN and with enabled caches, we save 23.12% of energy. Table 4 shows the savings for different scenarios, for all the networks. The first case, is with cache only and no CDN, the second and third cases represent 50 % (or 100%) of the demands served by CDNs without caches, and the third is with cache and 50% of demands served by CDN. Savings are always
Instance Cache CDN 0.5 CDN 1.0 Cache + CDN 0.5 Atlanta 6.5% 5.9 % 11.8% 9.6% Janos-US-CA 2.7% 9.0% 20.5% 9.45% Nobel-EU 10.6% 15.2% 24.2% 16.2% France 11.8% 15.6% 34.4% 20.5% Germany 16.7% 16.4% 27.4% 23.1% Zib54 6.74% 12.5% 23.4% 12.9%
TABLE 4: Savings in different scenarios for different networks.
0.0 0.2 0.4 0.6 0.8 1.0
Part of demands towards CDN 50 55 60 65 70 75 Energy consumption [lc ] With caches No caches
(a) As a function of CDN popularity.
1 2 3 4 5 6 7 8 CDN server locations 72 74 76 78 80 82 84 Energy consumption [lc ]
(b) As a function of server location cardinality.
FIGURE 6: Total energy consumption varied by CDN properties.
compared to the case without caches nor CDN. Figure 8 investigates how many location choices are needed to achieve good savings. In this scenario, for the sake of clarity, there is only one CDN. Its servers are potentially located in: Berlin, Frankfurt, Muenchen, Hamburg, Dortmund, Stuttgart, Leipzig and Aachen. In each data point, only the first n servers from this list are enabled. Each server is able to provide all the demands alone, 50% of all traffic is served by the CDN. It is infeasible to route with less than 3 locations. As we can see, increasing the number of possible choices from 3 to 5 yields around 13% of energy savings. Further increases have little effect. Thus, in this network of 50 cities, it is optimal to have 5 server locations.
6.3. Impact of traffic level
In this section, we look into the potential reduction of energy consumption of the networks in our model, both with and without usage of the caches, exploiting the variance in network traffic over time. The parameters
0.0 0.2 0.4 0.6 0.8 1.0
Part of demands towards CDN 14.0 14.5 15.0 15.5 16.0 16.5 17.0 Energy consumption With caches No caches (a) Atlanta 0.0 0.2 0.4 0.6 0.8 1.0
Part of demands towards CDN 24 25 26 27 28 29 30 31 32 33 Energy consumption With caches No caches (b) Nobel-EU 0.0 0.2 0.4 0.6 0.8 1.0
Part of demands towards CDN 50 55 60 65 70 75 Energy consumption [lc ] With caches No caches (c) Germany
FIGURE 7: Impact of caches and CDN cooperation on energy consumption
.
used throughout this section are: α = 0.35, β = 0.1 and cache bandwidth is half of a link.
Figure 9 shows energy consumption as a function of demand ratio, that is the inverse of traffic level. As we can see, in all the networks, enabling caches makes routing feasible under much higher loads than before, reported in the third column of Table 5. For example in the case of Germany, we can accommodate an increase in demands by one third. Then, as traffic decreases, we can save energy by turning off some
1 2 3 4 5 6 7 8 CDN server locations 72 74 76 78 80 82 84 Energy consumption [lc ]
FIGURE 8: Impact of the number of CDN server locations in Germany.
devices. The right column of Table 5 states relative difference between energy consumption of a network under highest possible load and half of that load, with caches enabled. Figure 10 shows, for the Germany50, the breakdown of the network devices (caches and links) used for these high and low traffic level. Solid (dashed) lines represents (un)used network links, black (white) squares (un)used caches.
For a range of demand values, it is feasible to route without caches, but at a higher total energy cost. Note that half of maximum sustainable load is in all cases within this range. The fourth column of Table 5 shows the highest difference of power consumption accommodating the same traffic with and without caches. This difference can go up to 16.7% for the network Germany50 for a demand ratio of about 0.35.
As can be seen, there is a point after which there are no additional savings with falling traffic. This is when the routing is feasible on a spanning tree, using no caches. Turning off any additional device would disconnect the network.
What is interesting is the fact that caches have a much higher effect in the germany50 than the smaller instances. We attribute that to longer routes, which mean higher energy cost to transfer the data through the network. This effect is investigated in Section 6.4. 6.4. Impact of network size
We have seen varying usage of caches in the studied networks. An explanation for that is the difference of route lengths in the diverse networks. Energy is saved by serving from a cache close to the user. Savings depend on how long would be the route traversed by the data, if it was served from the content provider. A longer route yields higher reductions. However, in the biggest network we used, the germany50, the average route length is only 4. Furthermore, when looking at a distance traveled by an average bit of data, this length is only 2.6. We claim that in bigger networks we could see higher utility of caches.
To estimate the impact of route length, we look into results on Erd˝os-R´enyi graphs. Recall that in these graphs, the route lengths grow logarithmically in respect to the graph size. As we need many big networks
to demonstrate the effect, obtaining integer solutions directly from a solver would be impractical. Therefore, the results presented are computed using the Spanning Tree Heuristic.
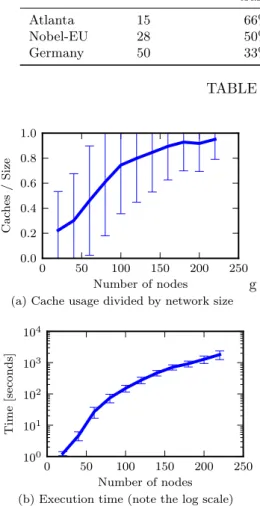
Figure 11a shows the number of caches used divided by the number of cities in two-connected Erd˝os-R´enyi graphs of increasing sizes. The average degree of each graph is 4, each city emits 7 demands to random other cities, cache parameters are α = 0.35, β = 0.1 and γ = 0.5. Each data point is an average over at least two thousand instances, error bars represent standard deviation.
As we can see, with no other parameters changing, usage of caches clearly grows with increasing network sizes. In a network of size 20, having average route length around 2.3, average number of caches on is only 4.47 (22.3%), while in networks of size 220, of average route length around 4.2, there are on average 209.2 (95.1%) caches turned on. Caches see an average usage over 50% for networks of size at least 80, where the average route length is only around 3.4. This size can correspond to small networks comprised of both core and metropolitan parts, or just big core networks.
Figure 11b displays the computation times. The value of S is 0.2. The execution time grows quickly. This is not due to the number of heuristic iterations, between 20 and 220 nodes the number of relaxations solved only doubles. However, at n = 220 a single relaxation takes 6 minutes on average. Thus, the time needed to find the fractional routing is the critical part of the computational cost.
6.5. Traffic Variations and Number of Network Reconfigurations
We now study the impact of the number of reconfigurations per day on the network power consumption. Indeed, it is an important trade-off for network operators. On one side, if many reconfigurations are done, we follow closely the traffic variations, with more equipements turned-off and, thus, we save more energy. However, on the other side, operators prefer to carry out as few as possible changes of configurations of their network equipements to minimize the chance of introducing errors or producing routing instability. We show here that we can have a good trade-off by obtaining most of the energy savings with a small number of reconfigurations.
As shown in figure 12(a), the traffic follows a typical daily pattern. Data come from a typical France Telecom link. The level of night traffic is around four times less than the one of high traffic (between 11am and 6pm).
Consider now that a network operator is willing and is able to carry out k reconfigurations per day. To carry out such simulations, we divide the day into k periods of time. For each of these periods, we consider the maximum traffic during the period. As an example, in figure 12(b) is shown the maximum traffic over periods
1.5 3.0 4.5 6.0 Demand ratio 14 15 16 17 18 19 Energy consumption [lc ] With caches No caches (a) Atlanta 0.5 1.0 1.5 2.0 2.5 Demand ratio 28 30 32 34 36 Energy consumption [lc ] With caches No caches (b) Nobel-EU 0.25 0.50 0.75 1.00 Demand ratio 50 55 60 65 70 Energy consumption [lc ] With caches No caches (c) Germany
FIGURE 9: Comparison of energy consumption with and without caches in the model.
(a) High traffic (b) Half traffic
FIGURE 10: Breakdown of devices used for two levels of traffic (Right has half the traffic of left).
of respectively 4 hours and 1 hour. We see that 1 hour intervals allow to mimic closely the traffic, while the use of 4 hour intervals introduces large energy wastes. We then run the algorithm to switch off as many elements as possible while being able to distribute this maximum traffic. We made the number of reconfigurations vary from 1 (maximum traffic during the day, corresponding to the former experiments) to 48 (a change every 30 minutes).
In figure 13, we plot the average power consumption of the network (average over all k periods) and the minimum power consumption (over all k periods). As expected, we see that the power consumption decreases when the number of allowed reconfigurations increases. The power is 87 when all equipements are on, 72 when only one reconfiguration is done, 69 when 2 are done. An interesting observation is that the decrease is sharp for small numbers till around 12 reconfigurations. Then, the curve becomes almost flat: with 12 reconfigurations, the power consumption is 61 (and 59 for 48 reconfigurations). An explanation of this phenomena can be seen in figure 12 (b). When the interval duration decreases, the maximum traffic gets
closer to the real traffic during the interval.
To summarize, a relatively small number of reconfigurations (every 2 hours and 4 hours) would allow operators to obtain most of the energy savings.
7. DISCUSSION
Cooperation between Content provider and Network operator. Recall that to implement in practice the solutions proposed in this paper it is necessary a collaboration between content providers and network operators. Indeed, it is necessary to know, on one hand, the locations, capacities and contents of the CDNs servers and, on the other hand, the network topologies and lists of network equipments that may be turned off. Nowadays, this sort of information is private and it is considered to be strategic by most of the companies.
A natural context to implement our solution is for a network operator that is also a content provider. This is a growing trend as revenue is increasingly shifting from traffic distribution to content distribution. As an example, Orange (ex-France Telecom) is operating its own CDN. In particular, it distributes the traffic
Network Nodes count Additional possible Maximum energy saved Total energy savings
traffic due to caches (load=50%)
Atlanta 15 66% 8.9% 21.3%
Nobel-EU 28 50% 3.2% 21.7%
Germany 50 33% 16.7% 22.3%
TABLE 5: Potential energy savings
0 50 100 150 200 250 Number of nodes 0.0 0.2 0.4 0.6 0.8 1.0 Cac hes / Size
(a) Cache usage divided by network size
g 0 50 100 150 200 250 Number of nodes 100 101 102 103 104 Time [seconds]
(b) Execution time (note the log scale)
FIGURE 11: Spanning Tree Heuristic on Erd˝os-R´enyi graphs.
of the video-sharing website Dailymotion, bought in 2011. Several studies explore the possible benefit due to this new deal [41, 42], and our paper can be seen as one of them. Nevertheless, we believe that as studies show the benefit of such types of solutions, at least a partial sharing of information between two independent network operators and content provider can be envisioned.
Practical implementation Energy-aware routing pro-tocols are a promising solution, but there still exist practical issues to solve before an implementation. Net-work operators do not like to turn off equipments and it changes their routing configurations. Indeed, routing protocols take some time to converge and it can lead to network instability, packet losses, and, thus to an increased delay for the end-users. Nevertheless, we be-lieve that energy-aware routing protocols can be imple-mented in a simple context like the one of our study. As a matter of fact, we discuss here about a small number of pre-planned changes of routing during the day and not about rapid changes. Daily aggregated traffic can be well estimated and a set of configurations depending
on the time of the day can be precomputed. More-over, this number of configurations is relatively small: we have seen in the previous section, that with 5 to 12 such configurations per day we can already obtain significant savings. This fact is also observed by other studies [43].
Second, to lower convergence time, a centralized control can be implemented with a technology like Software Defined Networks (SDN). This technology is very promising to put energy-aware solution into practice. Indeed, this allows to carry out traffic measurements, to perform route calculation and then to trigger an installation of new routing rules in the SDN enabled routers and switch-off equipments. Indeed, the centralized controller is able to turn on/off or switch the rate of a network interface and storage caches via SDN control messages. Note that these messages will be very small in comparison to the global traffic and not frequent (only few changes are sufficient to obtain most of the energy gain, e.g. every 4 hours see Figure 12). The increase of the power consumption will thus be negligible. In summary, the centralized controller of SDN can collect traffic matrix and then compute a routing solution satisfying QoS while being minimal in energy consumption. Then, the controller will update the forwarding tables of the nodes of the considered network and turn off some network interfaces and storage caches if needed in order to save some energy. [44] studies such a solution in a context of energy-aware routing. In [45], the authors explain how waking up line cards of routers in almost zero-time.
Time critical applications In the case of a time critical applications application, it could be of interest to place first this application, so that it experiences a small delay, and then to apply the (best-effort) algorithms to the remaining traffic. This can be easily added in our model by adding a priority criterion with a quality of service field for each demand for example. Additionally, note that the algorithm will still most of the time use the closest server/data. As a matter of fact, this choice is the best one in terms of bandwidth usage and, so will be often the preferred choice by the energy-efficient algorithm. Note also that for this kind of applications, the usage of caches is not suitable, as usually the data will not be redundant among users (phone or video calls, gaming as an example). Moreover, this represents a small percentage of the global traffic,
0 5 10 15 20 Time of the day (in hours) 0 20 40 60 80 100 Lev el of T raffic (100=max. daily traffic) traffic
(a) Typical daily traffic on Orange network.
0 5 10 15 20
Time of the day (in hours) 10 20 30 40 50 60 70 80 90 100 Lev el of P eak T raffic during the in terv al 4 hour intervals 1 hour intervals
(b) Peak traffic during the intervals, for intervals of 1 hour and 4 hours.
FIGURE 12: Peak Traffic as as function of the number of reconfigurations per day.
0 10 20 30 40 50
Reconfigurations per day 45 50 55 60 65 70 75 P o w er consumpion Average Minimum
FIGURE 13: Impact on the power consumption of the number of reconfigurations per day performed by the network operator.
therefore the global results of our experiments will not be significantly changed.
8. CONCLUSIONS AND FURTHER
RE-SEARCH
In this work, we addressed to the problem of energy saving in backbone networks. To the best of our knowledge, this is the first work to consider the impact of in-router caches, along with assigning servers of Content Delivery Networks to demands, in an energy-efficient routing.
We have proposed a new Integer Linear Programming model for saving energy in backbone networks by disabling links and caches of this network and a polynomial-time heuristic for this problem. We compared the performance of the solutions proposed by our heuristic against those found by CPLEX. In small to medium-sized instances, the solutions given by the heuristic are close to that of the integer program. It
allows to find good solutions for bigger networks, where CPLEX was not able to produce any feasible solution in hours.
We studied instances based on real network topologies taken from SNDLib. The total energy savings that we found oscillate around 20% for realistic parameters. Part of energy saved solely due to introduction of caches is up to 16% in our instances.
As a future work, the model could be extended to enable the usage of a single cache to satisfy the demands of multiple cities, i.e. to let a cache satisfy demands to different routers and not only to its own router. The energy savings will probably grow in this model, however it would be interesting to study how this solution could be deployed.
One could also look at different network architec-tures. This work considered only the backbone. A next step could be introducing access networks, lead-ing to larger instances. As the savlead-ings due to caches grow with network size, they should be substantially
higher in this case. This could also motivate study of new mechanisms, e.g. layered caching.
FUNDING
This work was supported by Agence Nationale de la Recherche program Investments for the Future under reference ANR-11-LABX-0031-01.
ACKNOWLEDGEMENTS
We would like to thank the anonymous reviewers for their interesting remaks which helped to improve our paper.
REFERENCES
[1] Webb, M. (2008) SMART 2020: enabling the low carbon economy in the information age, a report by The Climate Group on behalf of the Global eSustainability Initiative (GeSI). Creative Commons, .
[2] Zhang, M., Yi, C., Liu, B., and Zhang, B. (2010) Greente: Power-aware traffic engineering. Proceed-ings of the 18th IEEE International Conference on Network Protocols, Washington, DC, USA, Oct ICNP ’10, pp. 21–30. IEEE Computer Society. [3] Chiaraviglio, L., Mellia, M., and Neri, F. (2012)
Minimizing isp network energy cost: Formulation and solutions. IEEE/ACM Trans. Netw., 20, 463– 476.
[4] Bianzino, A. P., Chiaraviglio, L., Mellia, M., and Rougier, J.-L. (2012) Grida: {GReen} distributed algorithm for energy-efficient {IP} backbone networks. Computer Networks, 56, 3219 – 3232.
[5] Giroire, F., Mazauric, D., and Moulierac, J. (2012) Energy efficient routing by switching-off network interfaces. In Kaabouch, N. and Hu, W. (eds.), Energy-Aware Systems and Networking for Sustainable Initiatives, pp. 207–236. IGI Global, Hershey, PA.
[6] Akamai (2012).
[7] Chiaraviglio, L. and Matta, I. (2010) Greencoop: Cooperative green routing with energy-efficient servers. Proceedings of the 1st International Conference on Energy-Efficient Computing and Networking, New York, NY, USA, April e-Energy ’10, pp. 191–194. ACM.
[8] Chiaraviglio, L. and Matta, I. (2011) An energy-aware distributed approach for content and net-work management. 2011 IEEE Conference on Computer Communications Workshops (INFO-COM WKSHPS), Shanghai, China, April, pp. 337– 342. IEEE.
[9] Rosensweig, E. and Kurose, J. (2009) Bread-crumbs: Efficient, best-effort content location in cache networks. INFOCOM 2009, IEEE, Rio de Janeiro, Brazil, April, pp. 2631–2635. IEEE. [10] Paul, S., Yates, R., Raychaudhuri, D., and
Kurose, J. (2008) The cache-and-forward network architecture for efficient mobile content delivery services in the future internet. Innovations in NGN: Future Network and Services, 2008. K-INGN 2008. First ITU-T Kaleidoscope Academic Conference, Geneva, Switzerland, May, pp. 367– 374. IEEE.
[11] Dannewitz, C., Kutscher, D., Ohlman, B., Farrell, S., Ahlgren, B., and Karl, H. (2013) Network of information (netinf) - an information-centric networking architecture. Comput. Commun., 36, 721–735.
[12] Jacobson, V., Smetters, D. K., Thornton, J. D., Plass, M. F., Briggs, N. H., and Braynard, R. L. (2009) Networking named content. Proceedings of the 5th International Conference on Emerging Networking Experiments and Technologies, New York, NY, USA, December CoNEXT ’09, pp. 1– 12. ACM.
[13] Lee, U., Rimac, I., and Hilt, V. (2010) Greening the internet with content-centric networking. Proceedings of the 1st International Conference on Energy-Efficient Computing and Networking, New York, NY, USA, April e-Energy ’10, pp. 179–182. ACM.
[14] CPLEX. http://www.ibm.com/software/integration/ optimization/cplex-optimization-studio/.
[15] SNDLib. http://sndlib.zib.de.
[16] Erd˝os, P. and R´enyi, A. (1960) On the evolution of random graphs. Publ. Math. Inst. Hungary. Acad. Sci., 5, 17–61.
[17] Mathew, V., Sitaraman, R., and Shenoy, P. (2012) Energy-aware load balancing in content delivery networks. INFOCOM, 2012 Proceedings IEEE, Orlando, FL, March, pp. 954–962. IEEE.
[18] Ge, C., Wang, N., and Sun, Z. (2012) Optimizing server power consumption in cross-domain content distribution infrastructures. Communications (ICC), 2012 IEEE International Conference on, Ottawa, ON, June, pp. 2628–2633. IEEE.
[19] Xie, M., Widjaja, I., and Wang, H. (2012) Enhancing cache robustness for content-centric networking. INFOCOM, 2012 Proceedings IEEE, Orlando, FL, March, pp. 2426–2434. IEEE. Vol. ??, No. ??, ????
[20] Li, Z., Simon, G., and Gravey, A. (2012) Caching policies for in-network caching. 21st International Conference on Computer Communications and Networks (ICCCN), Munich, Germany, August, pp. 1 –7. IEEE.
[21] Psaras, I., Chai, W. K., and Pavlou, G. (2012) Probabilistic in-network caching for information-centric networks. Proceedings of the Second Edition of the ICN Workshop on Information-centric Networking, New York, NY, USA, August ICN ’12, pp. 55–60. ACM.
[22] Carlsson, N., Eager, D. L., Gopinathan, A., and Li, Z. (2014) Caching and optimized request routing in cloud-based content delivery systems. Perform. Eval., 79, 38–55.
[23] Xie, H., Shi, G., and Wang, P. (2012) Tecc: To-wards collaborative in-network caching guided by traffic engineering. INFOCOM, 2012 Proceedings IEEE, Orlando,FL, March, pp. 2546–2550. IEEE. [24] Zhang, G., Li, Y., and Lin, T. (2013) Caching
in information centric networking: A survey. Computer Network, 57, 3128–3141.
[25] Guan, K., Atkinson, G., Kilper, D., and Gulsen, E. (2011) On the energy efficiency of content delivery architectures. Communications Workshops (ICC), 2011 IEEE International Conference on, Kyoto, Japan, June, pp. 1–6. IEEE.
[26] Song, Y., Liu, M., and Wang, Y. (2011) Power-aware traffic engineering with named data networking. Mobile Ad-hoc and Sensor Networks (MSN), 2011 Seventh International Conference on, Beijing, China, Dec, pp. 289–296. IEEE.
[27] Choi, N., Guan, K., Kilper, D., and Atkinson, G. (2012) In-network caching effect on optimal energy consumption in content-centric networking. Communications (ICC), 2012 IEEE International Conference on, Ottawa, ON, June, pp. 2889–2894. IEEE.
[28] Mandal, U., Chowdhury, P., Lange, C., Gladisch, A., and Mukherjee, B. (2013) Energy-efficient networking for content distribution over telecom network infrastructure. Optical Switching and Networking, 10, 393 – 405.
[29] Jayasundara, C., Nirmalathas, A., Wong, E., and Chan, C. A. (2011) Energy efficient content distri-bution for vod services. Optical Fiber Communi-cation Conference and Exposition (OFC/NFOEC), 2011 and the National Fiber Optic Engineers Con-ference, Los Angeles, CA, March, pp. 1–3. IEEE Press.
[30] Araujo, J., Giroire, F., Liu, Y., Modrzejewski, R., and Moulierac, J. (2013) Energy efficient content distribution. Communications (ICC), 2013 IEEE International Conference on, Budapest, Hungary, June, pp. 4233–4238. IEEE.
[31] Hasslinger, G. and Hohlfeld, O. (2010) Efficiency of caches for content distribution on the internet. 22nd International Teletraffic Congress (ITC) 2010, Amsterdam, Sept, pp. 1–8. IEEE.
[32] CISCO. Cisco visual networking index: Forecast and methodology, 2013-2018.
[33] Van Heddeghem, W., Idzikowski, F., Vereecken, W., Colle, D., Pickavet, M., and Demeester, P. (2012) Power consumption modeling in optical multilayer networks. Photonic Network Commu-nications, 24, 86–102.
[34] Perino, D. and Varvello, M. (2011) A reality check for content centric networking. Proceedings of the ACM SIGCOMM Workshop on Information-centric Networking, New York, NY, USA, August ICN ’11, pp. 44–49. ACM.
[35] OCZ Technology Group.
http://www.ocztechnology.com/ocz-revodrive-3-x2-pci-express-ssd.html.
[36] Chabarek, J., Sommers, J., Barford, P., Estan, C., Tsiang, D., and Wright, S. (2008) Power awareness in network design and routing. The 27th Conference on Computer Communications. IEEE INFOCOM 2008., Phoenix, AZ, April, pp. –. IEEE.
[37] Van Heddeghem, W., Idzikowski, F., Le Rouzic, E., Mazeas, J. Y., Poignant, H., Salaun, S., Lannoo, B., and Colle, D. (2012) Evaluation of power rating of core network equipment in practical deployments. 2012 IEEE Online Conference on Green Communications (GreenCom), Piscataway, NJ, USA, Sept, pp. 126–132. IEEE.
[38] Min, H., Jayaraman, V., and Srivastava, R. (1998) Combined location-routing problems: A synthesis and future research directions. European Journal of Operational Research, 108, 1–15.
[39] Prodhon, C. and Prins, C. (2014) A survey of recent research on location-routing problems. European Journal of Operational Research, 238, 1– 17.
[40] Araujo, J., Giroire, F., Liu, Y., Modrzejewski, R., and Moulierac, J. (2012) Energy efficient content distribution. Research Report RR-8091. INRIA, Sophia Antipolis, France.
[41] Jiang, W., Zhang-Shen, R., Rexford, J., and Chi-ang, M. (2009) Cooperative content distribution and traffic engineering in an isp network. Proceed-ings of the Eleventh International Joint Conference on Measurement and Modeling of Computer Sys-tems, New York, NY, USA, June SIGMETRICS ’09, pp. 239–250. ACM.
[42] Ma, R. T., Chiu, D. M., Lui, J. C., Misra, V., and Rubenstein, D. (2011) On cooperative settlement between content, transit, and eyeball internet service providers. Networking, IEEE/ACM Transactions on, 19, 802–815.
[43] Chiaraviglio, L., Cianfrani, A., Rouzic, E. L., and Polverini, M. (2013) Sleep modes effectiveness in backbone networks with limited configurations. Computer Networks, 57, 2931 – 2948.
[44] Giroire, F., Moulierac, J., and Phan, T. K. (2014) Optimizing rule placement in software-defined networks for energy-aware routing. IEEE Global Communications Conference, GLOBECOM 2014, Austin, TX, USA, December, pp. 2523–2529. IEEE.
[45] Pan, T. and et al. (2015) Towards zero-time wakeup of line cards in power-aware routers. Networking, IEEE/ACM Transactions on, PP, 1– 14.
![FIGURE 1: Cache hit ratio for YouTube trace, assuming average video size 100MB, following the results in [31].](https://thumb-eu.123doks.com/thumbv2/123doknet/14515946.530555/4.892.518.802.114.288/figure-cache-ratio-youtube-assuming-average-following-results.webp)