HAL Id: hal-01136678
https://hal.archives-ouvertes.fr/hal-01136678
Submitted on 30 Mar 2015HAL is a multi-disciplinary open access archive for the deposit and dissemination of sci-entific research documents, whether they are pub-lished or not. The documents may come from teaching and research institutions in France or abroad, or from public or private research centers.
L’archive ouverte pluridisciplinaire HAL, est destinée au dépôt et à la diffusion de documents scientifiques de niveau recherche, publiés ou non, émanant des établissements d’enseignement et de recherche français ou étrangers, des laboratoires publics ou privés.
Simulating vowel chain shift in Xumi
Katia Chirkova, Tao Gong
To cite this version:
Katia Chirkova, Tao Gong. Simulating vowel chain shift in Xumi. Lingua, Elsevier, 2014, 152, pp.65-80. �10.1016/j.lingua.2014.09.009�. �hal-01136678�
Simulating Vowel Chain Shift in Xumi
Katia Chirkova, CNRS-CRLAO
Tao Gong, University of Hong Kong, Zhejiang University*
Abstract
This paper presents a simulation study of a vowel chain shift in Xumi (Tibeto-Burman). It adapts de Boer’s (2000, 2001) model of vowel systems in a population of artificial agents. The goals are: (1) to test one specific hypothesis of the relevance of a loan phoneme to the observed changes in the chain shift, and (2) to address on the basis of our Xumi data some general questions of interpretation related to synchronic vowel chain shifts. Our simulation results shed light on a complex scenario of change in Xumi that involves both system-internal factors and a system-external factor (the addition of a loan phoneme). Our simulation results also suggest that the particular combination of mechanisms and constraints in the model’s settings—random acoustic noise, self-organization, and contrast maintenance—is a viable hypothesis for vowel chain shifting. Our study demonstrates that computational simulations are helpful in evaluating different approaches to a specific instance of sound change.
Keywords: agent-based model, vowel chain shift, self-organization, contrast maintenance,
Xumi, Tibeto-Burman
*Each author contributed equally to this paper, by bringing in their respective expertise.
Chirkova, trained as a linguist, has taken primary responsibility for data collection, and for the description and analysis of the chain shift in Xumi. She was also the primary writer and editor. Gong, trained as a computer scientist, has taken primary responsibility for conducting simulations and presenting simulation results.
1. Introduction
This paper applies computer modeling to a study of one concrete scenario of change in Xumi (旭米), an unwritten Tibeto-Burman language, spoken in one mountain valley in Sichuan Province in the People’s Republic of China.1 Despite its small area of distribution, the language is spoken in two dialects with limited mutual intelligibility. Many consistent phonetic changes between the two dialects can be observed, but investigation of the origin and course of individual changes is difficult to pursue because all available evidence is synchronic. In this study we aim to tackle this difficulty through computer modeling. Naturally, computer modeling cannot replace missing historical data, but it can supplement traditional methods of linguistic analysis by providing a possibility of testing alternative hypotheses related to a specific instance of sound change. In addition to specific hypothesis testing, application of computer modeling to a concrete scenario of change, be it even in a little-known language, such as Xumi, may be useful in furthering our understanding of the type of change being modeled and of the key parameters that may underlie related processes in other real-world languages.
Our study focuses on a vowel chain shift in Xumi. Previous analyses (Chirkova and Chen, 2013; Chirkova et al., 2013) identify a common system of eight vowels in its two dialects. One dialect is described as having an additional (i.e. ninth) vowel phoneme, which it arguably borrowed from a contact variety of Tibetan (Kami). The previous analyses also suggest that the addition of the ninth loan vowel phoneme led to a series of related changes in the phonetic realization of the eight native vowel phonemes in that dialect. In other words, it led to a vowel chain shift: a series of related sound changes that are causally connected (Labov, 1994: 118-121).
1 This language is also known as Shixing (史兴), see Chirkova (2009) for a detailed
In order to evaluate this hypothesis, we used the agent-based model of vowel systems developed by Bart de Boer (2000, 2001) (see de Boer, 2000: 445-453, 2001: 38-54 for detailed descriptions of the original model and the underlying settings).2 Agent-based models are designed to explore how iterated interactions among independent autonomous entities (agents) gradually lead to collective behaviours at the population level (for overviews see de Boer, 2006; Bonabeau, 2002; Gilbert, 2008; Gong and Shuai, 2013; Gong et al., 2014; Railsback and Grimm, 2012; Wagner et al., 2003). Each agent is equipped with predefined or evolved mechanisms that enable interaction with other agents. By manipulating these mechanisms and ways of communication between agents, it is possible to simulate various phenomena in the human socio-cultural environment. One advantage of agent-based models is that existing models can be easily expanded and adapted to new research goals (Belew et al., 1996; de Boer, 2006), as we did in the present study.
De Boer’s (2000, 2001) model was originally developed to study the formation of vowel systems. It provides support for the thesis that self-organization plays an important role in determining the structure of vowel systems. Self-organization is defined as a process in which patterns at the global level are properties that spontaneously emerge from the numerous local interactions among the individual components (cf. Camazine et al., 2001: 8; de Boer, 2001: 24). An advantage of de Boer’s model for our investigation is that it is based on a realistic representation of vowels in the articulatory and acoustic spaces, hence allowing for a realistic replication of the vowel systems of the two dialects of Xumi.
De Boer’s model already includes in its original architecture a number of mechanisms that have been argued to underlie vowel chain shifts in real-world languages, more specifically: (i) emergence of patterns through self-organizational pathways (e.g. Liljencrants and Lindblom, 1972), and (ii) phonetic variation due to random noise in production and
perception, which steadily introduces new phonetic variants (Bybee, 2001; Pierrehumbert, 2001, 2002; Wedel, 2006).3 We adapted de Boer’s model to the chain shift scenario in Xumi by building in the constraint of contrast maintenance, one of the defining criteria of vowel chain shifts (as explained by Labov, 1994: 115-291; Martinet, 1952, 1955; and others). We generally followed the original model for all remaining settings. We manipulated some key parameters (such as acoustic noise ratio) and evaluated the results in relation to our empirical data (see section 5). Overall, we accept the known limitations and assumptions of de Boer’s model, which may not correspond directly to actual features of real-world languages (as acknowledged by de Boer; see de Boer, 2000: 463, 2002: 40-41 for discussion).4
We used the adapted system to run two sets of simulations: (i) an eight-vowel system, initialized on the observed vowel parameters of the eight-vowel dialect of Xumi (hereafter referred to as “eight-vowel simulations”); and (ii) a nine-vowel system, where a ninth vowel is added to the eight-vowel system (hereafter “nine-vowel simulations”). The goal of the eight-vowel simulations was to analyze any potential change due to system-internal factors and mechanisms (random noise, self-organization, and contrast maintenance). The goal of the
3 These mechanisms have been explored in exemplar-based models of language (e.g. Blevins,
2004; Pierrehumbert, 2001, 2002; for an overview and discussion, see Wedel, 2006 and references therein) and tested in an agent-based model of vowel chain shift by Ettlinger (2007). Ettlinger (2007) argues that the changes in a chain shift result from the self-organizing behavior of exemplar-based categories. The self-organizing behavior is such that when one vowel moves, another fills the gap. In contrast to the present study, vowels in Ettlinger’s model are defined in a one-dimensional space, and the chain shift scenario only involves two vowel phonemes.
4 These limitations and assumptions include direct feedback on imitative success and lack of
nine-vowel simulations was to test the specific hypothesis of the relevance of the ninth loan vowel phoneme to the set of changes in the nine-vowel dialect. In addition to that specific hypothesis, the two sets of simulations also allowed us to address on the basis of our Xumi data some general issues of interpretation raised by synchronic vowel chain shifts. These include (summarized on the basis of Gordon, 2001: 194-219, 2002): (i) how can an ongoing chain shift be identified and studied? (ii) how to establish whether changes are interrelated? (iii) how to establish the chronology of changes? (iv) how to determine whether contrast preservation plays a role in a given change? and (v) should one expect all links in a chain to reflect the influence of contrast preservation?
The simulation results were evaluated on the basis of the acoustic distances between the evolved vowels in the two sets of simulations, respectively, and the empirically observed vowels in the nine-vowel dialect of Xumi. Contrary to the previous analysis of the vowel chain shift in Xumi as resulting from the addition of a loan phoneme to the eight-vowel system (Chirkova et al., 2013), our simulation results suggest that the vowel chain shift in Xumi should rather be understood as a combined effect of system-internal factors and a system-external factor (the addition of a loan phoneme). The simulation results also suggest that all changes in the phonetic realization of the vowel phonemes in the nine-vowel dialect are interrelated and reflect the influence of contrast preservation. They also provide insights as to the chronology of some changes in the nine-vowel system. In sum, our simulation results suggest agent-based modeling as a promising tool to study synchronic chain shifts.
The remainder of this paper is structured as follows. Section 2 provides basic information about the vowel systems of the two dialects of Xumi and about the set of changes observed in the nine-vowel dialect. Section 3 briefly outlines the model architecture and simulation settings. Section 4 summarizes the simulation results for the two sets of simulations. Section 5 evaluates the generality of the simulation results under different numbers of population and
imitation games, and different acoustic noise ratios. Section 6 summarizes the findings of the study and discusses potential avenues for future research. The paper concludes with an appendix that provides a detailed description of the model used in our simulations.
2. Vowel Chain Shift in Xumi
The previous descriptions of the two dialects of Xumi (Lower Xumi or [LX], and Upper Xumi [or UX]) (Chirkova and Chen, 2013; Chirkova et al., 2013) identified on the basis of cognate vocabulary a common system of eight vowels:5
(1) /i/ (as in ‘wart’: LX [ji²⁴], UX [ji²⁴]) (2) /e/ (as in ‘to lick’: LX [je²⁴], UX [je̝²⁴]) (3) /ɛ/ (as in ‘vegetable oil’: LX [jɛ²⁴], UX [jɛ²⁴]) (4) /ʉ/ (as in ‘fly (n.)’: LX [bʉ²⁴], UX [bʉ²⁴])
(5) /ɐ/, realized as [ɐ] in LX and as [ɜ] in UX (as in ‘tent’: LX [jɐ⁵⁵], UX [jɜ⁵⁵]) (6) /u/ (as in ‘crops’: LX [bu²⁴], UX [bu²⁴])
(7) /o/ (as in ‘wild goose’: LX [dʑo⁵⁵], UX [dʑo̝⁵⁵])6
5 Tone notation in Xumi and Kami is provided in the numerical five-scale pitch system
developed by Yuen Ren Chao (1930).
6 Note that /o/ has multiple allophones in UX including in addition to [o̝], also [ɵ] (as in
(8) /ɑ/, realized as [ɑ] in LX and corresponding to two phonemes, [ɐ] and [ɔ], in UX (as in ‘to jump’: LX [tsɑ⁵⁵], UX [tsɐ⁵⁵]; and ‘tailor’: LX [zu³³bɑ³⁵], UX [zu³³bɔ⁵⁵], cf. Kami Tibetan [zu³³bɔ⁵⁵], Written Tibetan bzo ba).
Of the two UX vowels ([ɐ] and [ɔ]) that correspond to one vowel in LX ([ɑ]), UX [ɔ] is typically found in loanwords from the local dialect of Tibetan, Kami (as in the example above), which is in close contact with UX. For these reasons, Chirkova et al. (2013) analyse UX [ɔ] as a loan phoneme from Kami Tibetan.
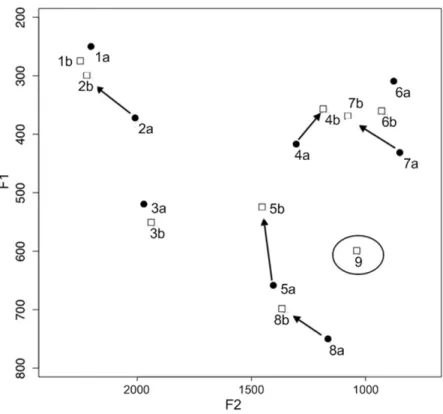
The oral vowel systems of the two dialects are presented in the vowel charts of Figure 1, where vowels are plotted on their relative F1/F2 values. The data in this figure are based on a set of 50 high frequency cognate words, containing all vowels of Xumi in different consonantal contexts. Two speakers were chosen for this figure, one for each dialect of Xumi, to represent the general patterns observed across this data set.7 Vowels are numbered to allow for convenient comparison between the two systems. Note that while most phonemic vowel categories in UX were established on the basis of cognates in both dialects; UX vowels 5 and 8, which were considered to be most markedly distinct in their realization from the corresponding vowels in LX, were assigned IPA symbols on the basis of their closest phonetic realization.
ba), [ɤ] (as in [tsɤ⁵⁵] ‘crown of a head’, LX [tso⁵⁵]), and [əʊ] (as in [ɕəʊ⁵⁵] ‘meat’, LX [ɕo⁵⁵]).
Lower Xumi Upper Xumi Figure 1: Oral vowel systems of Lower Xumi and Upper Xumi
The previous analysis of UX (Chirkova et al., 2013) argues that the addition of the loan phoneme /ɔ/ triggered the following changes in the realization of the eight native vowel phonemes:
(1) Fronting and raising of vowel 8 (LX [ɑ] to UX [ɐ]) (2) Raising and centering of vowel 5 (LX [ɐ] to UX [ɜ])
(3) Raising of vowel 2 (/e/), thereby coming into close approximation with vowel 1 (/i/) (4) Backing of vowel 4 ([ʉ]) and its merger with vowel 6 ([u]) in some environments (such as after alveolars)8
(5) Raising of vowel 7 (/o/), thereby coming into close approximation with vowels 6 (/u/) and 4 (/ʉ/)9
8 For example, the words ‘to wipe’ and ‘to count’ are homophonous in UX, both /su⁵⁵/, but
The set of changes in the phonetic realization of UX vowel phonemes is summarized in Figure 2, on the basis of the data in Figure 1. Vowels are normalized using the Nearey (1977) vowel-extrinsic method on the NORM website (http://ncslaap.lib.ncsu.edu/tools/norm/; Kendall and Thomas, 2010; Thomas and Kendall, 2007).
Figure 2: Changes in the phonetic realization of the vowel phonemes in UX. Plot of Nearey normalized vowels from NORM. Black dots and the letter “a” after vowel numbers indicate LX vowels; white squares and the letter “b” indicate UX vowels. Arrows are added to indicate the trajectories of the shifting vowels. Circle is added to indicate the loan phoneme /ɔ/.
9 Note that the general tendency of raising is complicated in the case of /o/ by the shift of that
vowel along multiple trajectories (see footnote 6 for the various allophones of /o/ in UX). The position of this vowel in Figure 1b is averaged over all its distinct trajectories grouped together. Consequently, it represents a simplification of a more complicated process of change.
In sum, changes in UX include changes in the positioning of most vowel phonemes (more precisely, 2, 4, 5, 7, 8), and conditioned merger (involving vowels 4 and 6). Given that these changes appear interrelated, while distinctions between most vowels are preserved, this set of changes matches the two definitional criteria of vowels chain shifts: (1) the requirement that a chain shift involve a series of (at least two) interrelated changes, (2) the requirement that these changes do not result in any loss of contrast in the phonemic system (e.g. Labov, 1994: 118-119; Martinet, 1952: 126, 1955; see Gordon, 2001: 194, 2002 for a detailed discussion). Accordingly, we refer to the set of changes in UX as a vowel chain shift.10 For the purposes of our pilot investigation, we chose to simplify the complex change scenario in UX by excluding merger to focus only on the vowel chain shift interpretation of the observed changes. Obviously, the exclusion of merger prevents full generalization of the simulation results.
3. Simulation Model and Settings
In our simulations, vowel chain shift is modelled in a population of artificial agents. In our model, agents are small computer programs that operate autonomously. They can produce, perceive, and remember speech sounds (vowels), which are stored by agents as prototypes.11 In the articulatory space, vowels are described using three dimensions: (i) frontness-backness of the tongue position, (ii) height of the tongue, and (iii) rounding/spreading of the lips. In the acoustic space, vowels are represented in terms of the first four formant values. The model
10 Note that Xumi chain shift is different from the most familiar cases of vowel chain shifts
(such as the Northern Cities Shift in American English) in that not all changes can be clearly represented by one vowel entering the space previously occupied by another (cf. Gordon 2002: 260-261).
adopts a two-dimensional acoustic space. The two dimensions are: (i) F1 (or the first formant), and (ii) F2’ (F2 prime or the second effective formant), which is an aggregate value calculated from the F2, F3, and F4 formant frequencies (Carlson et al., 1970; Bladon and Fant, 1978). In order to take human perception into account, the acoustic space uses the Bark scale instead of Hz to represent formant frequencies.
Agents synthesize, perceive, and update vowels during imitation games. Imitation games are pairwise interactions between agents, in which agents imitate each other as best they can. The only possible outcomes of the games are success or failure (de Boer, 2000: 449-450, 2001: 51; Steels, 1997, 1998). Imitation games may be simplifications of real linguistic interactions, but they involve the same functional pressures that occur in real language (such as pressures toward ease of production and processing, and ease of learning) (de Boer, 2006: 17).
Agents start and end simulations with the same fixed amount of vowels in their repertoires (eight in the one set of simulations, nine in the other set). They cannot add or delete vowels non-randomly during imitation games. Moreover, during those games, agents preserve phonemic contrast between vowel prototypes. To that end, each vowel prototype is assigned a tag, indicating the phonemic category to which it belongs. (A single vowel category cannot have more than one vowel prototype.) Communication between agents is subject to random acoustic noise, which is applied by shifting the formant frequencies by a random percentage. The acoustic noise ratio in the original simulations is set to 0.1. This is because simulations with that acoustic noise ratio result in vowel systems that have a realistic number of vowels (de Boer, 2000: 457-458). (Changes of the acoustic noise ratio and their impact on simulation results are discussed in section 5.)
Each game involves two randomly chosen agents: a speaker and a hearer. The speaker selects a vowel from his repertoire and produces it. The hearer tries to imitate the vowel,
using the vowel prototypes in his own repertoire. The game is deemed successful if, at the end of a game round, the speaker hears the vowel imitated by the hearer as the same vowel he (i.e. the speaker) originally produced. Otherwise, the game is considered to have failed. During imitation games, agents can (i) move produced vowels closer to the perceived vowel; (ii) add new vowels that are a close imitation of the perceived vowel; (iii) discard vowels that have been used successfully in less than 50% of all imitation games; and (iv) shift away from each other those vowels with different tags that come too close to each other in either articulatory or acoustic space, and that, for that reason, can be easily confused because of the acoustic noise.
The list of vowels in each agent’s vowel repertoire is updated depending on the outcome of the imitation games. Throughout each game round, speaker and hearer cannot look into each other’s prototype repertoires. Any update of the vowel repertoire of an agent makes use exclusively of local information and of the vowels perceived by that agent.
The input data for our simulations consisted of the values of the three articulatory parameters (tongue position, p; tongue height, h; and lip roundness, r) of the eight vowels of Lower Xumi, and of the ninth phoneme /ɔ/ in Upper Xumi (see equations 1-4 in the appendix; the values of these parameters were set in the range between 0.0 and 1.0). The p and r values were assigned on the basis of the empirically observed vowels. There were two degrees of rounding (r) in the original data (with the initial values of 1.0 for rounded vowels and 0.0 for unrounded vowels), and three degrees of position (p) (with the initial values of 0.0 for front vowels, 0.5 for central vowels, and 1.0 for back vowels). The value of tongue height (h) was estimated on the basis of the relative position of each vowel on the vertical axis.
Following the original settings in de Boer’s model, we calculated the formant frequencies of vowels for our simulations directly from their articulatory positions with an interpolation function, based on information on formant frequencies in Vallée (1994) (as
detailed in de Boer, 2001: 44-45). As a result, the input vowel data in our simulations are approximations (rather than exact replications) of the empirically observed vowels (as in Figure 1). The calculated values are summarized in Table 1.
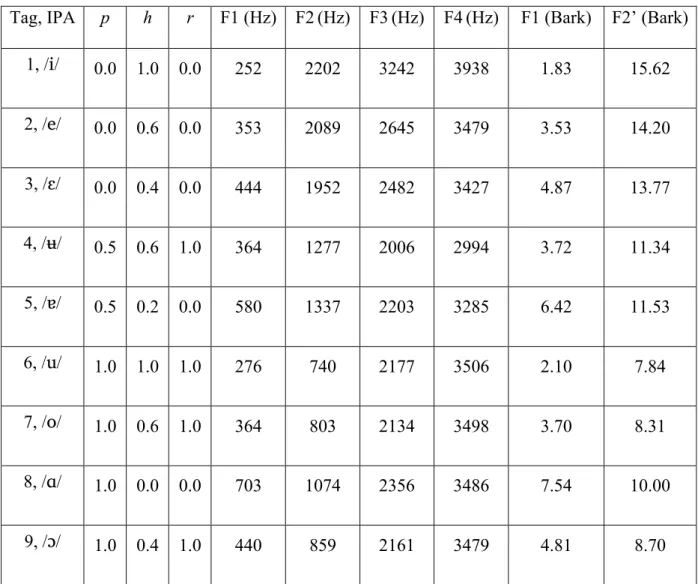
Table 1: p, h, r, F1-F4, and F1-F2’ values of the Lower and Upper Xumi vowels used in our simulations.
Tag, IPA p h r F1 (Hz) F2(Hz) F3(Hz) F4(Hz) F1 (Bark) F2’ (Bark) 1, /i/ 0.0 1.0 0.0 252 2202 3242 3938 1.83 15.62 2, /e/ 0.0 0.6 0.0 353 2089 2645 3479 3.53 14.20 3, /ɛ/ 0.0 0.4 0.0 444 1952 2482 3427 4.87 13.77 4, /ʉ/ 0.5 0.6 1.0 364 1277 2006 2994 3.72 11.34 5, /ɐ/ 0.5 0.2 0.0 580 1337 2203 3285 6.42 11.53 6, /u/ 1.0 1.0 1.0 276 740 2177 3506 2.10 7.84 7, /o/ 1.0 0.6 1.0 364 803 2134 3498 3.70 8.31 8, /ɑ/ 1.0 0.0 0.0 703 1074 2356 3486 7.54 10.00 9, /ɔ/ 1.0 0.4 1.0 440 859 2161 3479 4.81 8.70
We used these input data in two sets of simulations: (i) vowel simulations: an eight-vowel system, based on the LX values; and (ii) nine-eight-vowel simulations: a nine-eight-vowel system, based on the LX values and the ninth phoneme /ɔ/. In both sets of simulations, all vowels in each agent’s repertoire had a distinct tag (1 to 8 in the eight-vowel simulations, and 1 to 9 in
the nine-vowel simulations), and the corresponding articulatory and acoustic parameter values (see Table 1).
Figure 3 shows the initial positions of the nine vowels in the acoustic space in the two sets of simulations.
(a) Eight-Vowel Simulations (b) Nine-Vowel Simulations
Figure 3: Initial positions of the vowel prototypes in the acoustic space in the two sets of simulations. Numbers indicate distinct vowel prototypes.
We conducted ten simulation runs in each set to collect sufficient data for analysis. In each run, there was a 100-agent population, who randomly conducted a total of one million imitation games for all agents combined (i.e. approximately ten thousand games per agent). Every 20,000 games, we recorded the acoustic parameter values of all vowel prototypes in each agent’s repertoire. In order to trace the movements of vowel prototypes, we also calculated the average acoustic parameter values of all distinct vowel prototypes across all agents and illustrated these average vowel prototypes in the two-dimensional acoustic space.
The results of both sets of simulations were evaluated on the basis of the acoustic distances between the evolved vowels and the empirically observed vowels in the two dialects of Xumi.
4. Simulation Results
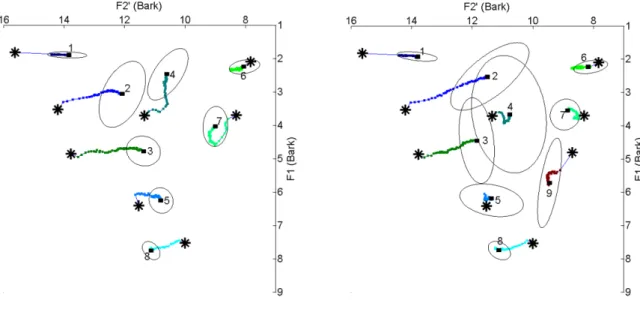
Figure 4 traces the movements of the average vowel prototypes over ten runs in the eight-vowel simulations (Figure 4(a)) and in the nine-eight-vowel simulations (Figure 4(b)). Videos S1 and S2 trace the movements of all vowel prototypes in all agents in two runs in the eight-vowel simulations and in the nine-eight-vowel simulations, respectively. In addition to average vowel prototypes, Figure 4 also shows the distribution of vowel prototypes of each category (denoted by ellipses, covering 98% of the distribution of all prototypes of a vowel category).
(a) Eight-Vowel Simulations (b) Nine-Vowel Simulations
Figure 4: Movements of the average vowel prototypes in the two sets of simulations. Numbers indicate distinct vowel prototypes. Stars indicate the start-points of vowel trajectories; rectangles indicate the end-points of vowel trajectories after a total of one million imitation games for all agents combined. Lines trace the movements of distinct vowels. Results are averaged over ten runs.
A visual inspection of the changes in the realization of vowel phonemes in Figures 4(a) and Figure 4(b) leads to the following observations:
(1) The two sets of simulations result in stable (eight- and nine-) vowel systems, shared each throughout the population of agents.
(2) Among all movements of vowels in the system, those of the front vowels 1, 2, and 3 had the largest range (that is, the largest distance between start-positions and end-positions).
(3) As a result of many rounds of communication between agents who preserve phonemic contrast between distinct vowels, most vowels in the two sets of simulations changed their position in the vowel space in a coordinated fashion, thereby approximating some changes in the phonetic realizations of vowels phonemes in Upper Xumi.
In relation to the first observation, we evaluated the stability of the two systems by tracing the articulatory and acoustic distances between all pairs of distinct vowel prototypes in all agents. Figure 5 shows the average values of these distances over ten runs for the evolved eight-vowel system (Figure 5(a)) and the evolved nine-vowel system (Figure 5(b)). We observe that in both sets of simulations, the articulatory distance gradually decreased and reached a stable value after a number of imitation games. The acoustic distance, on the other hand, decreased and became stable after just a few imitation games. After circa one million games, both articulatory and acoustic distances in both sets of simulations already reached their stable values, indicating that the relative positions of those vowel prototypes remained relatively stable.
(b) Nine-Vowel Simulations
Figure 5: Average articulatory and acoustic distances (Dart and Daco) between all pairs of vowel prototypes over ten runs in the two sets of simulations
In relation to the second observation, we attribute the pronounced movement of the front vowels toward the centre of the vowel space to some discontinuities in the weighting function of the second effective formant in de Boer’s original model (see de Boer 2000: 48-50 and equations 2, 3, and 6 in the appendix). It should be noted that while vowel mapping based on F1 and F2’ is more successful than F1 and F2 in separating the front high and mid rounded and unrounded vowels, presentation based on F1 and F2’ is not very natural for front vowels (Carlson, et al., 1970, 1975: 57-61; Fant, 1973, 2005: 205; Fant and Risberg, 1963; Vaissière, 2011: 55). More precisely, only /o/ and /u/ yield a mean F2’ which equals F2. Variation in the matches between F2 and F2’ for other vowels ranges from 12 to 31 percent. The largest percent range occurs for front vowels, whose mean F2’ is between F3 and F4 (Rosner and Pickering, 1994: 146-147). The variation in the matches between F2 and F2’ introduces discontinuities in the weighting function of the second effective formant in our model. As a result, a small variation in the p, h, and r values in the articulatory space leads to large, non-continuous variation in the acoustic space for the front vowels, while the corresponding variation for all other vowels is more gradual.
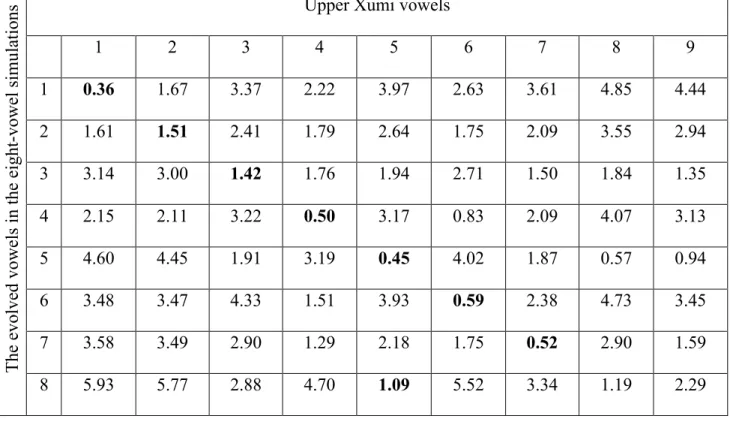
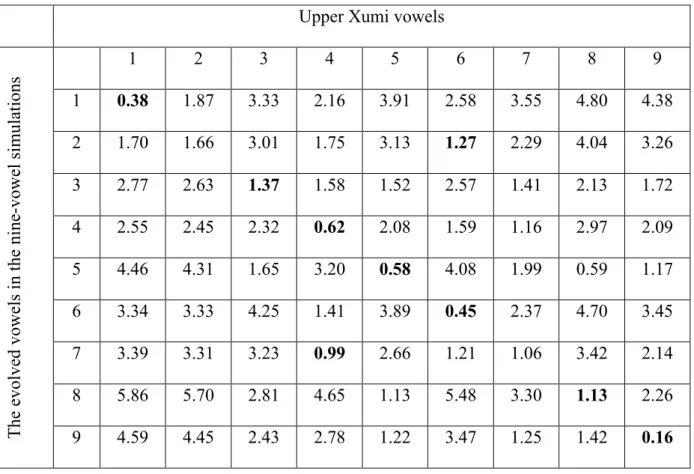
In relation to the third observation, we compared the end-positions of the average evolved vowels in the eight- and nine-vowel simulations, respectively, with the empirically observed vowels in the nine-vowel dialect (UX). The goal of the comparison of the eight-vowel simulations with the empirically observed UX eight-vowels was to establish a baseline for the nine-vowel simulations. The goal of the comparison of the nine-vowel simulations with the empirically observed UX vowels was to investigate the role of the ninth vowel in the set of changes in the phonetic realization of the eight native vowel phonemes in UX. The results of this comparison are presented in Figure 6, which graphically shows minimal and near-minimal distances between the evolved vowels in the two sets of simulations and the empirically observed vowels in UX. (See supporting materials for complete tables providing all distances between the evolved vowels in the two sets of simulations and the empirically observed UX vowels, Tables 2-3.)
(a) Eight-Vowel Simulations (b) Nine-Vowel Simulations
Figure 6: Acoustic distances (in Bark) between the average evolved vowels in the two sets of simulations (on the vertical axis) and the empirically observed nine vowels in Upper Xumi (on the horizontal axis). The color bar indicates distance values. The positions of the evolved vowels are the average positions after a total of one million communications for all agents
combined over ten runs. The positions of the empirically observed vowels are based on Figure 3.
The following observations are in order. Of the two sets of simulations, the evolved vowels in the eight-vowel simulations appear to better match the empirically observed UX vowels and to better approximate the changes in the realizations of some UX vowel phonemes (as discussed in section 2, see also Figure 2).
With one exception (the evolved vowel 8, which is minimally close to the empirically observed vowel 5 instead of vowel 8), the evolved vowels in the eight-vowel simulations are minimally close to their corresponding UX vowels. The average minimal distance between the evolved vowels and the empirically observed vowels is around 0.5 Bark. The larger than average minimal distances between the evolved vowels 2 and 3 and the empirically observed vowels 2 and 3 are likely due to the discontinuities in the weighing function of the second effective formant. Note that despite the pronounced movements to the center of the vowel space, the evolved front vowels are still the best matches for the empirically attested front vowels in terms of minimal acoustic distances. Again, with the exception of the evolved vowel 8, the evolved vowels 2, 4, and 7 in the eight-vowel simulations are near-minimally close to the empirically observed UX vowels 1, 6, and 4, respectively.This suggests that as a result of many rounds of communication, the evolved vowels 2, 4, and 7 moved towards the evolved vowels 1, 6, and 4, respectively. These movements approximate the shifting of vowel 2 towards vowel 1, of vowel 4 towards vowel 4, and of vowel 7 towards vowel 4 in UX (as discussed in section 2, Figure 2).
By contrast, in the nine-vowel simulations, we observe two mismatches between the evolved vowels and the corresponding UX vowels. The evolved vowel 2 is minimally close to the empirically observed vowel 6, and it is near-minimally close to the empirically observed vowel 2. The evolved vowel 7 is minimally close to the empirically observed vowel 4, and it
is near-minimally close to the empirically observed vowel 7. As a result, the evolved vowel 2 in the nine-vowel simulations shifts in a trajectory that is different from the one observed in UX (that is, towards vowel 6 instead of towards vowel 1, as in UX). The average minimal distance between most evolved vowels in the nine-vowel simulations and the empirically observed UX vowels (between 0.5 and 1 Bark) is also larger than that in the eight-vowel simulations.
Overall, the addition of the ninth vowel to the eight-vowel system generally leads to changes that approximate less well the positioning of UX vowels and changes in their realization. One exception can be noted: the evolved vowel 8 in the nine-vowel simulations matches better the position of the empirically observed vowel 8 than the evolved vowel 8 in the eight-vowel simulations. In other words, in relation to the set of changes in UX, the addition of the ninth vowel may only be relevant to the changes in the positioning of vowel 8. Consequently, we tentatively conclude that in order to locally affect the changes in the positioning of that vowel and not of other vowels, the addition of the ninth vowel to the eight-vowel system should be relatively recent. In sum, seen from our simulation results, changes in the realization of vowel phonemes in UX appear to be a combined result of system-internal factors (random acoustic noise, self-organization, contrast maintenance) and a system-external factor (the addition of the loan phoneme). Contrary to the previous analysis of Xumi (Chirkova et al. 2013), which regards the ninth loan phoneme as the trigger of the changes in UX, our simulations results suggest that the role of the ninth vowel in that set of changes is limited, so that the participation of the ninth vowel in the changes may be relatively recent.
In relation to the questions of interpretation raised by synchronic chain shifts, our simulation results suggest that all changes in the positioning of UX vowels may indeed be interrelated and proceed more or less simultaneously. All changes reflect the influence of contrast preservation. Our simulation results also provide indications as to the chronology of
some changes in the nine-vowel system (as in the case of the relatively recent addition of vowel 9). All in all, our study suggests that agent-based modeling may serve as a useful tool to evaluate whether a certain set of changes constitutes a chain shift and, more generally, to study chain shifts.
5. Generality of the Simulation Results
This section describes additional simulations conducted in order to test the sensitivity of the simulation results to the input parameters of the simulations. We chose the following three parameters (population size, number of imitation games, and acoustic noise ratio), which we consider to be of most direct impact on the results of our simulations. All additional simulations are illustrated on the basis of the eight-vowel system.
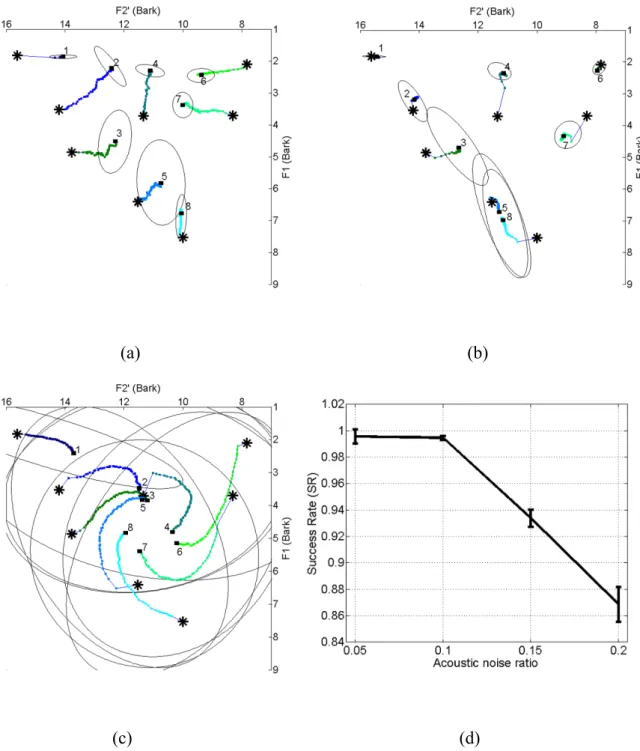
Size of the population and the number of imitation games. Additional simulations consist of (i) a total of ten million imitation games in a 100-agent population (Figure 7(a)) and (ii) a total of five million imitation games in a 500-agent population (Figure 7(b)). Figure 7(c) compares the ratio of successful imitation games to all imitation games in the three sets of simulations with different population size and different number of imitation games: (i) a 100-agent population, who conduct a total one million imitation games for all 100-agents combined (as discussed in section 4), (ii) a 100-agent population, who conduct a total of ten million imitation games for all agents combined, and (iii) a 500-agent population, who conduct a total of five million imitation games for all agents combined.
(a) (b)
(c)
Figure 7: Movements of the average prototypes of different vowels in two additional sets of the eight-vowel simulations. In 7(a), the population contains 100 agents, who conduct a total of ten million imitation games for all agents combined. In 7(b), the population contains 500 agents, who conduct a total of five million imitation games for all agents combined. Numbers indicate distinct vowel prototypes. Stars indicate the start-points of vowel trajectories; rectangles indicate the end-points of vowel trajectories. Lines trace the movements of distinct vowels. Results are averaged over ten runs. Figure 7(c) compares the ratio of successful
imitation games to all imitation games in three simulation sets: (i) a 100-agent population, who conduct one million imitation games for all agents combined (as discussed in section 4), (ii) a 100-agent population, who conduct ten million imitation games for all agents combined, and (iii) a 500-agent population, who conduct five million imitation games for all agents combined. Error bars indicate standard errors.
The results of the additional simulations are consistent with those presented in section 4 and based on one million imitation games for all agents combined in a 100-agent population. That is to say, our additional simulations also result in a stable eight-vowel system shared throughout the populations of agents. The ratio of successful imitation games to all imitation games is high (over 0.99) in all three sets of simulations. This entails that throughout all imitation games, agents can successfully imitate each other and the system of phonemic contrasts remains unchanged. In sum, the simulation results of this model are not critically dependent on either the number of agents in a population or the number of imitation games. Accordingly, the results summarized in section 4 are likely to be representative as the general findings of our study.
Results of changing acoustic noise ratio. In order to reflect the effects of the acoustic noise level on the simulation results, we ran three additional sets of simulations. Simulations results are illustrated on the basis of the eight-vowel system with the acoustic noise ratio set to 0.05 (Figure 8(a)), 0.15 (Figure 8(b)), and 0.2 (Figure 8(c)), with 10 simulations in each case. Figure 8(d) compares the ratio of successful imitation games to all imitation games for four sets of simulations: (i) with the acoustic noise ratio set to 0.1 (as discussed in section 4), (ii) with the acoustic noise ratio set to 0.05, (iii) with the acoustic noise ratio set to 0.15, (iv) with the acoustic noise ratio set to 0.2.
(a) (b)
(c) (d)
Figure 8: Movements of the average prototypes of the eight vowels in three additional sets of simulations. In 8(a), the acoustic noise ratio is set to 0.05; in 8(b), it is set to 0.15; and in 8(c), it is set to 0.2. Numbers indicate distinct vowel prototypes. Stars indicate the start-points of vowel trajectories; rectangles indicate the end-points of vowel trajectories; lines trace the movements of distinct vowels. Results are averaged over ten runs. Figure 8(d) compares the ratio of successful imitation games to all imitation games in four simulation sets: (i) with the acoustic noise ratio set to 0.1 (as discussed in section 4), (ii) with the acoustic noise ratio set
to 0.05, (iii) with the acoustic noise ratio set to 0.15, (iv) with the acoustic noise ratio set to 0.2. Error bars indicate standard errors.
The results of these additional simulations confirm the findings by de Boer (2000, 2001) that the acoustic noise ratio of 0.1 gives the most realistic results (de Boer 2000: 457-458). If the acoustic noise ratio is below 0.1 (as in Figure 8(a)), the ratio of successful imitation games to all imitation games is high, but vowel movements are distinct from those observed empirically. For example, described impressionistically, the movement of vowel 8 in Figure 8(a) is that of raising, whereas in Figures 4(a) and 4(b), it is that of fronting. If, on the other hand, the acoustic noise ratio is above 0.1, the ratio of successful imitation games to all imitation games drops significantly, as shown in Figure 8(d). In other words, if the acoustic noise ratio is above 0.1, distinct vowel prototypes may come too close to each other so as to cause confusion. As a result, the number of vowels that the agents can distinguish reliably decreases. This is the case for vowels 5 and 8 in Figure 8(b), and for vowels 2, 3 and 5, on the one hand, and vowels 4 and 6, on the other hand, in Figure 8(c).
6. Summary and Discussion
In this study, we used computer modeling as a tool (i) to test one specific hypothesis of the relevance of the ninth loan vowel phoneme to the set of changes in the realization of the vowel phonemes in Upper Xumi, and (ii) to address on the basis of our Xumi data some general questions of interpretation related to synchronic vowel chain shifts. In relation to the specific hypothesis, a comparison of our simulation results with the empirically observed vowels of Upper Xumi suggests, in contrast to the previous analysis of that dialect, that the set of changes in Upper Xumi are likely to be a combined effect of system-internal factors and a system-external factor (the addition of a loan phoneme). In relation to the questions of interpretation raised by synchronic vowel shifts, our study suggests that agent-based modeling
may be a useful tool for exploring such issues (including the interrelatedness of changes and their chronology). Our study also shows that the particular combination of mechanisms and constraints in the settings of the model used in our simulations (random noise, self-organization, and contrast maintenance) may be a viable hypothesis for vowel chain shifting, consistent with our empirical study. We hope that the adapted model (as presented in the appendix) can be applied to more cases of ongoing and completed vowel chain shifts so as to further refine the model and to contribute to a better understanding of these shifts. To our knowledge, our simulations for the first time demonstrate the effect of self-organization in relation to a real-world scenario of change.
It should be emphasized that the present study is a pilot investigation and the obtained results are of an exploratory and preliminary nature. Much remains to be done both in terms of the documentation and description of the two dialects of Xumi, on the one hand, and modeling, on the other hand. In relation to the documentation and description of Xumi, the series of changes in the phonetic realization of the vowels phonemes and the merger of some vowel phonemes in Upper Xumi need to be investigated in greater detail, involving a more systematic acoustic and perceptual analysis and a larger number of speakers.
In relation to modeling, more complex models need to be designed to take into account the possibility of vowel merger and to integrate a full articulatory synthesizer (e.g. as discussed in Gabioud, 1994) so as to address the problem of discontinuities in the weighting function of the second effective formant. The accuracy of the results may also be further improved by taking into account phonological conditioning factors, which would be of particular importance in the case of UX vowel /o/ that appears to shift along multiple trajectories (see footnote 6).
In this study we used one specific model to explore a synchronic vowel chain shift in Xumi—de Boer’s model of vowel systems in a population of artificial agents. Naturally, other
models using different parameters might offer different explanations of the Xumi data. One could think, for instance, of one-dimensional models for vowel shifts (as in Ettlinger, 2007; and Stanford and Kenny, 2013) or of models based on co-articulation, tone or vowel harmony. Such models might illuminate other facets of Xumi vowel chain shift, thereby furthering our understanding of Xumi, and more generally, enhancing the potential of applying computer modeling to studies of concrete scenarios of change in real-world languages.
Appendix: Model Description
The phenomenon of vowel chain shift in Xumi is modeled in a population of artificial agents. In our model, agents are small computer programs that operate autonomously. They can produce, perceive, and remember speech sounds (vowels) in a human-like way. For this purpose, each agent is equipped with a realistic articulatory synthesizer and an acoustic perception model.
The articulatory synthesizer of each agent takes as inputs the values of three articulatory parameters widely used to describe vowels, namely, tongue position (p), tongue height (h), and lip roundness (r). The values of these parameters are set in the range between 0.0 and 1.0. For tongue position, 0.0 means most to the front, and 1.0 most to the back. For tongue height, 0.0 means the lowest, and 1.0 the highest. In the case of r, 0.0 defines least rounded vowels, and 1.0 defines most rounded vowels. The articulatory synthesizer calculates as outputs the first four formant frequencies of the corresponding vowels on the basis of Maeda’s (1990) articulatory model, as in equation (1). Note that in order to increase the speed of the simulations, and also due to the difficulty of mapping the abstract parameters of position, height, and rounding to the degrees of freedom of Maeda’s model, a choice was made in the original model by de Boer to calculate the formant frequencies directly from the
articulator positions, using an interpolation function, based on information on formant frequencies in Vallée (1994: 162-164; see de Boer, 2001: 44-45).
𝑭𝟏 = −𝟑𝟗𝟐 + 𝟑𝟗𝟐𝒓 𝒉𝟐+ 𝟓𝟗𝟔 − 𝟔𝟔𝟖𝒓 𝒉 + −𝟏𝟒𝟔 + 𝟏𝟔𝟔𝒓 𝒑𝟐 + 𝟑𝟒𝟖 − 𝟑𝟒𝟖𝒓 𝒉𝟐+ −𝟒𝟗𝟒 + 𝟔𝟎𝟔𝒓 𝒉 + 𝟏𝟒𝟏 − 𝟏𝟕𝟓𝒓 𝒑 + 𝟑𝟒𝟎 − 𝟕𝟐𝒓 𝒉𝟐+ −𝟕𝟗𝟔 + 𝟏𝟎𝟖𝒓 𝒉 𝟕𝟎𝟖 − 𝟑𝟖𝒓 𝑭𝟐 = −𝟏𝟐𝟎𝟎 + 𝟏𝟐𝟎𝟖𝒓 𝒉𝟐+ 𝟏𝟑𝟐𝟎 − 𝟏𝟑𝟐𝟖𝒓 𝒉 + 𝟏𝟏𝟖 − 𝟏𝟓𝟖𝒓 𝒑𝟐 + 𝟏𝟖𝟔𝟒 − 𝟏𝟒𝟖𝟖𝒓 𝒉𝟐+ −𝟐𝟔𝟒𝟒 + 𝟏𝟓𝟏𝟎𝒓 𝒉 + −𝟓𝟔𝟏 + 𝟐𝟐𝟏𝒓 𝒑 + −𝟔𝟕𝟎 + 𝟒𝟗𝟎𝒓 𝒉𝟐+ 𝟏𝟑𝟓𝟓 − 𝟔𝟗𝟕𝒓 𝒉 + 𝟏𝟓𝟏𝟕 − 𝟏𝟏𝟕𝒓 𝑭𝟑 = 𝟔𝟎𝟒 − 𝟔𝟎𝟒𝒓 𝒉𝟐+ 𝟏𝟎𝟑𝟖 − 𝟏𝟏𝟕𝟖𝒓 𝒉 + 𝟐𝟒𝟔 + 𝟓𝟔𝟔𝒓 𝒑𝟐 + −𝟏𝟏𝟓𝟎 + 𝟏𝟐𝟔𝟐𝒓 𝒉𝟐+ −𝟏𝟒𝟒𝟑 + 𝟏𝟑𝟏𝟑𝒓 𝒉 + −𝟑𝟏𝟕 − 𝟒𝟖𝟑𝒓 𝒑 + 𝟏𝟏𝟑𝟎 − 𝟖𝟑𝟔𝒓 𝒉𝟐+ −𝟑𝟏𝟓 + 𝟒𝟒𝒓 𝒉 + 𝟐𝟒𝟐𝟕 − 𝟏𝟐𝟕𝒓 𝑭𝟒 = ( −𝟏𝟏𝟐𝟎 + 𝟏𝟔𝒓 𝒉𝟐+ 𝟏𝟔𝟗𝟔 − 𝟏𝟖𝟎𝒓 𝒉 + 𝟓𝟎𝟎 + 𝟓𝟐𝟐𝒓 )𝒑𝟐 + −𝟏𝟒𝟎 + 𝟐𝟒𝟎𝒓 𝒉𝟐+ −𝟓𝟕𝟖 + 𝟐𝟏𝟒𝒓 𝒉 + −𝟔𝟗𝟐 − 𝟒𝟏𝟗𝒓 +( 𝟏𝟒𝟖𝟎 − 𝟔𝟎𝟐𝒓 𝒉𝟐+ −𝟏𝟐𝟐𝟎 + 𝟐𝟖𝟗𝒓 𝒉 + 𝟑𝟔𝟕𝟖 − 𝟏𝟕𝟖𝒓 ) 𝒑 (1)
The acoustic perception model is used to calculate the distance between a perceived vowel and vowels already stored in the agent’s repertoire. The model adopts a two-dimensional acoustic space. The two dimensions are: (i) F1 (or the first formant), and (ii) F2’ (F2 prime or the second effective formant), which is an aggregate value calculated from the F2, F3, and F4 formant frequencies (Carlson et al., 1970; Bladon and Fant, 1978). In order to take human perception into account, the acoustic space uses the Bark scale instead of Hz to represent formant frequencies.The F2’ prime value of a vowel prototype is calculated in the perception model by using Mantakas et al.’s (1986) method, as in equations (2) and (3):
𝑭𝟐′ = 𝑭𝟐 if 𝑭𝟑 − 𝑭𝟐 > 𝒄 ( 𝟐 − 𝒘𝟏 𝑭𝟐 + 𝒘𝟏𝑭𝟑)/𝟐. 𝟎 if 𝑭𝟑 − 𝑭𝟐 ≤ 𝒄 and 𝑭𝟒 − 𝑭𝟐 > 𝒄 (𝒘𝟐𝑭𝟐 + 𝟐 − 𝒘𝟐 𝑭𝟑)/𝟐. 𝟎 − 𝟏. 𝟎 if 𝑭𝟒 − 𝑭𝟐 ≤ 𝒄 and 𝑭𝟑 − 𝑭𝟐 < 𝑭𝟒 − 𝑭𝟑 ( 𝟐 + 𝒘𝟐 𝑭𝟑 − 𝒘𝟐𝑭𝟒)/𝟐. 𝟎 − 𝟏. 𝟎 if 𝑭𝟒 − 𝑭𝟐 ≤ 𝒄 and 𝑭𝟑 − 𝑭𝟐 ≥ 𝑭𝟒 − 𝑭𝟑 (2) 𝒘𝟏 = 𝟏 − 𝑭𝟑 − 𝑭𝟐 /𝒄 𝒘𝟐 = ( 𝑭𝟒 − 𝑭𝟑 − 𝑭𝟑 − 𝑭𝟐 )/(𝑭𝟒 − 𝑭𝟐) (3)
Formant frequencies are converted into the Bark scale by using equation (4):
𝑩𝒂𝒓𝒌 = 𝒍𝒏(𝑯𝒛 𝟐𝟕𝟏. 𝟑𝟐) 𝟎. 𝟏𝟕𝟏𝟗 + 𝟐. 𝟎 if 𝑯𝒛 > 𝟐𝟕𝟏. 𝟑𝟐(𝑯𝒛 − 𝟓𝟏) 𝟏𝟏𝟎 else (4) Based on p, h, and r values, the articulatory distance (Dart) between two vowel prototypes (a and b) is calculated as a Euclidean distance in the articulatory space, as in equation (5):
𝑫𝒂𝒓𝒕(𝒂, 𝒃) = (𝒑𝒂− 𝒑𝒃)𝟐+ (𝒉
𝒂− 𝒉𝒃)𝟐+ (𝒓𝒂− 𝒓𝒃)𝟐 (5)
Based on F1 and F2’, the acoustic distance (Daco) between two vowel prototypes (a and b) is calculated as a weighted Euclidean distance in the acoustic space, as in equation (5), where λ determines the relative weight of F2’ with respect to F1. In de Boer’s original model, λ is set to 0.3. This is based on human articulation experiments and empirical data (Lindblom and Lubker, 1985; Schwartz et al., 1997), which suggest that that is a realistic value.
𝑫𝒂𝒄𝒐(𝒂, 𝒃) = (𝑭𝟏𝒂− 𝑭𝟏𝒃)𝟐+ 𝝀(𝑭𝟐 𝒂 ! − 𝑭𝟐
𝒃
!)𝟐 (6)
Agents synthesize, perceive, and update vowels during imitation games. Imitation games are pairwise interactions between agents, which can only have success or failure as their outcome (de Boer, 2000: 449-450, 2001: 51; Steels, 1997, 1998). Depending on the precise outcome of an interaction, agents can update their vowel repertoires.
Agents store vowels as prototypes. Following de Boer (2000: 449), this term is used in the machine learning sense of the word, as referring to the central point of a category. Each vowel prototype has an articulatory and an acoustic realization. The articulatory realization is produced by the synthesizer. The acoustic realization is perceived using the perception model. For every vowel that is perceived, the agents find the vowel prototype that is closest to the perceived vowel in terms of acoustic distance. The perceived vowel is then recognized as an instance of the prototype in the listener’s repertoire. Each vowel prototype has two counters, which record all occurrences of total and successful uses of that vowel prototype in previous imitation games (hereafter termed use and success counts, respectively). The ratio of these two counts is a measure of the successfulness of a vowel. Interactions between the agents are
subject to acoustic noise, which is applied by shifting the formant frequencies by a random percentage. The level of acoustic noise determines the articulatory and acoustic thresholds used to assess the articulatory and acoustic distances between the produced and perceived vowels in the perception model. Following the original settings of de Boer’s model, the acoustic noise ratio in our simulations is set to 0.1 (see equation 7). The acoustic noise is calculated using equation (7). Fi is the actually produced ith formant frequency of a given vowel prototype, ui is randomly chosen from a uniform distribution within the range [-ѱac/2, ѱac/2], and ѱac indicates the maximum level of acoustic noise. Following the original setting in de Boer’s model, ѱac in the present model is set to 0.1.
𝑭𝒊 = 𝑭𝒊 𝟏 + 𝒖𝒊 𝒊 = 𝟏, 𝟐, 𝟑, 𝟒; −𝝍𝒂𝒄/𝟐 ≤ 𝒖𝒊≤ 𝝍𝒂𝒄/𝟐 (7)
The acoustic noise ratio determines the articulatory threshold (Tart) and the acoustic threshold (Taco), as in equation (8):
𝑻𝒂𝒓𝒕 = 𝟑𝝍𝒂𝒄 and 𝑻𝒂𝒄𝒐 = 𝐥𝐧 (𝟏 + 𝝍𝒂𝒄) 𝟎. 𝟏𝟕𝟏𝟗 − 𝐥𝐧 (𝟏 − 𝝍𝒂𝒄) 𝟎. 𝟏𝟕𝟏𝟗 (8) Each game involves two randomly chosen agents, a speaker and a hearer. Each game round consists of five stages:
(1) Production by the speaker (subject to acoustic noise),
(2) Comprehension by the hearer (in relation to the vowel prototypes in the hearer’s repertoire),
(3) Imitation (or re-production) by the hearer (subject to acoustic noise),
(4) Comprehension by the speaker (in relation to the vowel prototypes in the speaker’s repertoire),
(5) Prototype update by the hearer.
The game is judged successful if the vowel prototype, as perceived by the speaker at stage 4, is judged identical to the one produced by the speaker at stage 1. Otherwise, the game is considered to have failed.
The number of vowels in each agent’s vowel repertoire is fixed. This is different from de Boer’s original model, in which an agent’s vowel repertoire is initially empty and the number of vowels in the repertoire increases through the random addition of new vowels in the acoustic space during imitation games (with the probability of 1% for most simulations). In our simulations, the agents start and end simulations with the same fixed amount of vowels in their repertoires and they cannot add or delete vowels non-randomly.
In order to keep vowel prototypes distinct during simulations, each vowel prototype is assigned a tag, indicating the phonemic category to which it belongs. A single vowel category cannot have more than one vowel prototype. This is again distinct from de Boer’s original model, in which vowel prototypes are only differentiated by their articulatory or acoustic parameters.
During imitation games, agents can perform the following operations:
(1) Move produced vowels closer to the perceived vowel (the “shift closer” operation). This operation is performed by replacing the articulatory parameter values of perceived vowel by those of one of its six neighbours in the acoustic space. These are the vowels that are reached by changing either the value of p, h, or r in the positive or negative directions by the pre-established amount of 0.05. (This pre-established amount reflects the minimum difference in p, h, r value between two prototypes).
(2) Add new vowels that are a close imitation of the perceived vowel. In failed games, the hearer first judges whether the perceived vowel is strong. Strong vowels are those vowels whose success/use ratio is above the pre-established threshold of 0.7 (which means that that vowel was successfully used in 70% of all imitation games). If the perceived vowel is strong, the hearer makes no adjustment to it, but adds a new prototype in its repertoire to imitate that vowel in future games. The articulatory parameters of the newly added prototype are set as follows. First, the hearer randomly initializes a set of p, h, and r values for the newly-added
prototype, and then continuously modifies these values by increasing or decreasing them by the pre-established amount of 0.05 (see (1) above). That operation is performed until both the articulatory and acoustic distances between the newly added prototype and the imitation vowel produced by the hearer are within the articulatory and acoustic thresholds. The counters of total and successful use of the newly added prototype are both set to 0. This is because that prototype has not been previously used in either production or comprehension.
(3) Throw bad vowels out of the system. Bad vowels are those vowels whose success/use ratio is below the pre-established threshold of 0.5 after they have been used at least 5 times.
(4) The final operation, which we added to the original set-up in order to incorporate the mechanism of contrast maintenance is the “shift away” operation. The “shift away” operation is designed to preserve contrast between distinct vowel prototypes. It is the exact opposite of the “shift closer” operation. It applies to (i) distinct vowels, whose articulatory and acoustic distances are within the articulatory and acoustic thresholds, and (ii) those perceived vowels in failed games, whose success/use ratio is below 0.7. The “shift away” operation consists of replacing the articulatory parameter values of the vowel in question by those of one of its six neighbours in the acoustic space. The purpose of this operation is to increase the acoustic distance between the modified prototype, on the one hand, and other prototypes in the agent’s repertoire and/or other perceived vowel prototypes, on the other hand, so as to lower the chance of confusing the former with the latter in future games.
The list of vowels of an agent is updated depending on the outcome of the imitation games. Throughout each game round, the speaker and the hearer cannot look into each other’s prototype repertoires. Any update of the vowel repertoire of an agent only makes use of local information and the vowels perceived by that agent.
Acknowledgements
This is a reworked version of a paper presented at the 5th International Conference in Evolutionary Linguistics (CIELS-5), held at the Chinese University of Hong Kong on August 17-19, 2013. We would like to thank Zhongwei Shen, Thomas Schoenemann and other participants of the conference for their comments and suggestions. We owe a debt of gratitude to Bart de Boer for sharing with us the original computer program of his agent-based model of vowel systems (de Boer 2000, 2001). We are also grateful to William S.-Y. Wang, Zev Handel, and three anonymous reviewers of Lingua for their constructive comments that greatly helped us improve the presentation and content of the paper; and to our Xumi language consultants, Mr. Lurong Duoding 鲁绒多丁 and Mr. Waxia Danyou 瓦下旦友 for their help with data collection. This work has been supported by the Agence Nationale de la Recherche of France (grant number ANR-07-JCJC-0063), by the Endangered Languages Documentation Programme (ELDP, grant number MPD0257), and by the LabEx-EFL (ANR/CGI).
References
Belew R.K., Mitchell M., Ackley D.H., 1996. Computation and the natural sciences. In: Belew R.K., Mitchell M. (Eds.), Adaptive Individuals in Evolving Populations: Models and Algorithms. Addison-Wesley Publishing, Reading, MA, pp. 431-446.
Blevins, J., 2004. Evolutionary Phonology: The Emergence of Sound Patterns. Cambridge University Press, Cambridge.
Bladon, R., Fant, G., 1978. A two-formant model and the cardinal vowels, speech transmission laboratory. Quaterly Progress Status Report. Royal Institute of Technology, Stockholm 1, 1-8.
de Boer, B., 2001. The Origins of Vowel Systems. Oxford University Press, Oxford.
de Boer, B., 2006. Computer modeling as a tool for understanding language evolution. In: Gontier, N., van Bendegem, J. P., Aerts, D. (Eds.), Evolutionary Epistemology, Language and Culture: A Nonadaptationist Systems Theoretical Approach (Theory and Decision Library – Series A: Philosophy and Methodology of the Social Sciences). Springer, Dordrecht, pp. 381-406.
Bonabeau, E., 2002. Agent-based modeling: Methods and techniques for simulating human systems. Proceedings of the National Academy of Sciences of the United States of America 99(3), 7280-7287.
Bybee, J., 2001. Phonology and Language Use. Cambridge University Press, Cambridge. Camazine, S., Deneubourg, J-L., Franks, N. R., Sneyd, J., Theraulaz, G., and Bonabeau, E.,
2001. Self-Organization in Biological Systems. Princeton University Press, Princeton, N.J.
Carlson, R., Granström, B., Fant, G., 1970. Some studies concerning perception of isolated vowels. Speech Transmission Laboratory Quarterly Progress and Status Report 2-3, 19-35.
Carlson, R., Fant, G., Granström, B., 1975. Two-formant models, pitch, and vowel perception. In: Fant, G., Tathan, M. A. M. (Eds.), Auditory Analysis and Perception of Speech, Academic Press, London; New York; San Francisco, pp. 55-82.
Chao, Y. R., 1930. ə sɩstəm əv “toun-lɛtəz”. Le Maître Phonetique 30, 24-27.
Chirkova, K., 2009. Shixing, a Tibeto-Burman language of South-West China: A grammatical sketch with two appended texts. Linguistics of the Tibeto-Burman Area 32(1), 1-90. Chirkova, K., Chen, Y., 2013. Xumi, Part 1: Lower Xumi, the variety of the Lower and
Middle Reaches of the Shuiluo River. Journal of the International Phonetic Association 43(3), 363-379.
Chirkova, K., Chen, Y., Kocjančič Antolík, T., 2013. Xumi: Part 2: Upper Xumi, the variety of the Upper Reaches of the Shuiluo River. Journal of the International Phonetic Association 43(3), 381-396.
Ettlinger, M., 2007. An exemplar-based model of chain shifts. Proceedings of the 29th Annual Conference of the Cognitive Science Society. Cognitive Science Society, Austin, Texas, pp. 239-244.
Fant, G., 1973. Speech Sounds and Features. MTI Press, Cambridge, MA, and London, UK. Fant, G., 2005. Speech Acoustics and Phonetics. Kluwer Academic Publishers, Dordrecht,
Boston, London.
Fant, G., Risberg, A., 1963. Auditory matching of vowels with two formant synthetic sound. STL—Quarterly Progress Status Report: Stockholm 4, 7-11.
Gabioud, B., 1994. Articulatory models in speech synthesis. In: Keller, E. (Ed.), Fundamentals of Speech Synthesis and Speech Recognition: Basic Concepts, State of the Art and Future Challenges. John Wiley & Sons, Chichester, New York, Brisbane, Toronto, Singapore, pp. 215-230.
Gilbert, N. G., 2008. Agent-Based Models. (Quantitative Applications in the Social Sciences; 153.) Sage Publications, Thousand Oaks, California.
Gong, T., Shuai, L., 2013. Computer simulation as a scientific approach in evolutionary linguistics. Language Sciences 40, 12-23.
Gong, T., Shuai, L., Zhang, M., 2014. Modeling language evolution: Examples and predictions. Physics of Life Reviews 11, 280-302.
Gordon, M. J., 2001. Small-Town Values and Big-City Vowels: A Study of the Northern Cities Shift in Michigan. (Publication of the American Dialect Society, No. 84.) Duke University Press, Durham, N.C.
Gordon, M. J., 2002. Investigating chain shifts and mergers. In: Chambers, J. K., Trudgill, P., Schilling-Estes, N. (Eds.), The Handbook of Language Variation and Change. Blackwell, Oxford, pp. 244-266.
Kendall, T., Thomas, E.R., 2010. Vowels: Vowel Manipulation, Normalization, and Plotting in R. R package, version 1.1. Software Resource: http://ncslaap.lib.ncsu.edu/tools/norm/, accessed June 2014.
Labov, W., 1994. Principles of Linguistic Change (Vol. 1): Internal Factors. Blackwell, Oxford.
Liljencrants, J., Lindblom, B., 1972. Numerical simulation of vowel quality systems: The role of perceptual contrast. Language 48, 839-862.
Lindblom, B., Lubker, J., 1985. The speech homunculus and a problem of phonetic linguistics. In: Fromkin, V. A. (Ed.), Phonetic Linguistics: Essays in Honor of Peter Ladefoged. Academic Press, Orlando, pp. 169-192.
Maeda, S., 1990. Compensatory articulation during speech: Evidence from the analysis and synthesis of vocal tract shapes using an articulatory model. In: Hardcastle, W. J., Marchal, A. (Eds.), Speech Production and Speech Modeling. Kluwer, Dordrecht, pp. 131-149. Mantakas, M., Schwartz, J. L., Escudier, P., 1986. Modèle de prédiction du “deuxième
formant effectif” F2’—Application à l’étude de la labialité des voyelles avant du français. In: Proceedings of the 15th Journées d’Étude sur la Parole. Société Française d’Acoustique, Paris, pp. 157-161.
Martinet, A., 1952. Function, structure and sound change. Word 8: 1-32. Reprinted in 1978 in: Baldi, P., Werth, R. (Eds.), Readings in Historical Phonology. The Pennsylvania State University Press, University Park, pp. 121-159.