HAL Id: hal-00304904
https://hal.archives-ouvertes.fr/hal-00304904
Submitted on 1 Jan 2003HAL is a multi-disciplinary open access archive for the deposit and dissemination of sci-entific research documents, whether they are pub-lished or not. The documents may come from teaching and research institutions in France or abroad, or from public or private research centers.
L’archive ouverte pluridisciplinaire HAL, est destinée au dépôt et à la diffusion de documents scientifiques de niveau recherche, publiés ou non, émanant des établissements d’enseignement et de recherche français ou étrangers, des laboratoires publics ou privés.
on sulphate concentrations
P. J. Dillon, K. M. Somers, J. Findeis, M. C. Eimers
To cite this version:
P. J. Dillon, K. M. Somers, J. Findeis, M. C. Eimers. Coherent response of lakes in Ontario, Canada to reductions in sulphur deposition: the effects of climate on sulphate concentrations. Hydrology and Earth System Sciences Discussions, European Geosciences Union, 2003, 7 (4), pp.583-595. �hal-00304904�
Coherent response of lakes in Ontario, Canada to reductions in
sulphur deposition: the effects of climate on sulphate
concentrations
P.J. Dillon
1,2, K.M. Somers
2, J. Findeis
1and M.C. Eimers
1 1Environmental and Resource Studies, Trent University, Peterborough, Ontario, Canada K9J 7B82Dorset Environmental Science Centre, Ontario Ministry of the Environment, P.O. Box 39, Dorset, Ontario, Canada P0A 1E0 Email for corresponding author: [email protected]
Abstract
Sulphate deposition in south-central Ontario declined between 1976 and 2000 by more than 50%, whereas lake sulphate (SO42) concentrations
decreased by, on average, only half as much. To investigate the factors that controlled this slower than expected response, the temporal patterns in lake SO42 concentrations were compared with patterns in both deposition and climate, since climate has a major influence on the
hydrological cycle in this part of the continent. To do this, the temporal coherence in SO42 concentrations between 9 lake basins was
estimated using the intraclass correlation from a repeated-measures analysis of variance and two subsets of lakes were found (six in one group, four in the other), each with lakes having synchronous patterns. One subset (4 lakes) included the 3 with the longest water replenishment times (>3.4 yr) which are expected to respond to decreases in SO42 deposition more slowly. However, the average pattern reflecting the
temporal changes of each of the two subsets was very similar. The response of both subsets of lakes to the decreasing SO42 deposition over
two decades was independent of the degree of acidification or sensitivity to acidification of the lakes. In a determination of which factors best predicted each of those two subsets SO42 time series, good predictive models were produced by regional/global-scale climate indices,
specifically the Southern Oscillation Index (SOI) describing the El Niño Southern Oscillation (ENSO) and the North Atlantic Oscillation Index (NAOI), as well as by SO42 deposition indices. When the predictor variables were combined, models which described the long-term
changes in lake SO42 concentration best included the SOI, the NAOI and SO42 deposition. Thus, large-scale climate factors play a major role
in determining the response of aquatic systems to changes in SO42 deposition, perhaps through their influence on lake and/or catchment
processes that effectively delay recovery.
Keywords: Atmospheric deposition, lake recovery, temporal trends, climate, temporal coherence
Introduction
Sulphur emission control programmes, some of which were implemented as early as the 1970s, have reduced both SO2 emissions and S deposition in most regions of Europe, the United States (Hedin et al., 1987; Driscoll et al., 1995) and Canada (Dillon et al., 1988; Sirois and Summer, 1989; Bouchard, 1997). Furthermore, these declining SO2 emissions and S deposition have resulted generally in lower concentrations of SO42 (sulphate) in surface waters, the simplest and most direct measure of lake recovery, in both the United States (Driscoll and van Dreason, 1993; Newell, 1993; Stoddard and Kellogg, 1993; Webster et al., 1993;
Webster and Brezonik, 1995; Stoddard et al., 2003) and Canada (Dillon and LaZerte, 1992; Clair et al,. 1995; Jeffries et al., 2000; Bouchard, 1997).
However, the reductions in surface water SO42 concentrations have often been much less than those anticipated, following the reduction in atmospheric S deposition (Driscoll et al., 1995; Dillon et al., 1997; Dillon and Evans, 2001; Löfgren et al., 2001). Furthermore, other important measures of chemical recovery, namely increases in lake pH and acid neutralising capacity, ANC, have provided conflicting evidence. In a few cases (Kahl et al., 1993; Webster and Brezonik, 1995; Stoddard et al., 1998),
they have provided limited evidence of chemical recovery but in many others (Clair et al., 1995; Houle et al., 1997; Dillon et al., 1997), there has been little or no change in these parameters despite declining S deposition.
The apparent lack of proportional response in lake SO42 concentrations in certain areas has been attributed to several mechanisms, including 1) re-oxidation of reduced S in the lakes catchments followed by increasing flux to the lakes (Dillon and LaZerte, 1992; Schindler et al., 1996; Dillon et al., 1997; Dillon and Evans, 2001), 2) desorption of previously adsorbed SO42 in the soil (Driscoll et al., 1995; Löfgren et al., 2001; Alewell, 2001; Wilander, 2001; Hill et al., 2002) and/or 3) mineralisation and oxidation of organically bound S (Löfgren et al., 2001; Mitchell et al., 2001) from the catchments.
Superimposed on any long-term changes that might have occurred in the chemistry of the soils, precipitation and surface waters as a result of decreasing SO2 emissions, is the influence of natural year-to-year and between-season variations in weather, particularly temperature and precipitation. These fluctuations induce variability in surface water chemistry (Monteith et al., 2000) and may obscure the detection of trends that are expected as a result of reductions in anthropogenic SO42 deposition. For example, if the time frame for the analysis of temporal response is short relative to the lag time of the lake or to weather variations, then natural fluctuations in lake water chemistry may limit the ability to detect patterns in many lake water quality parameters and to relate these patterns to decreased loading of acid pollutants (Bouchard, 1997). On the other hand, a longer term data set may obscure shorter trends occurring within the series. If the trends are not uni-directional, then the detection of trends is dependent on the time window used in the analysis and can even make a significant difference regarding the detection of the presence and the direction of a trend (Clair et al., 2002). For example, Clair et al. (1992) found significant decreases in SO42 concentrations in lakes in Nova Scotia, Canada, for the period 1983-1989 but, with the addition of two more years of data, these trends were mostly reversed (Clair et al., 1995). The intra- and inter-annual fluctuations in weather are further complicated by the effects of longer term weather patterns i.e. climate and climate change. In North America, droughts in south and central Ontario (Dillon and LaZerte, 1992; Dillon et al., 1997; Devito et al., 1999), in northwestern Ontario (Schindler et al., 1996) and in the upper midwest US (Webster and Brezonik, 1995), were hypothesised to cause re-oxidation of reduced S stored in wetlands, followed by subsequent increases in SO42 net export in wet periods to downstream lakes. It was also suggested that the frequency of these droughts was
increasing (Schindler et al., 1996).
Climate has long been recognised as an external factor that drives the behaviour of lake and catchment biogeochemistry and often has a greater influence on the physical, chemical and biological properties of the lakes than do in-lake processes, catchment characteristics, or landscape position (Magnuson et al., 1990; Webster et al., 2000; George et al., 2000; Baron and Caine, 2000). Few studies addressed the impact of known long-term climatic patterns or repeated events on surface waters although Anderson et al. (1996) related the dates of ice breakup in 20 Wisconsin lakes to the warm phase of El Niño Southern Oscillation (ENSO) episodes and George et al. (2000) found that winter temperatures in several Windermere catchment lakes were positively correlated to the North Atlantic Oscillation (NAO). These relationships reflect physical rather than chemical properties of the lakes. In addition, experimental manipulations at the ecosystem scale, such as the RAIN and CLIMEX projects (Wright and Jenkins, 2001), have shown that climate is a confounding factor in recovery from acidification.
Recently Evans et al. (2001) linked fluctuations in marine ion (Cl, Na+, Mg2+) concentrations to the NAO; an inverse relationship between non-marine SO42 and Cl concentrations at five of their lake sites in Great Britain suggested that soil retention and release of SO42 also may be a sea-salt related process, that might impede the detection of long term trends in lake recovery. In North America, Dillon et al. (1997) and Dillon and Evans (2001) reported a connection between S redox reactions and ENSO episodes. They found that elevated stream SO42 concentrations and export rates in south-central Ontario occurred in the autumn of years with prolonged severe drought, and that these droughts occurred in the years following strong El Niño events, i.e. when the SOI was strongly negative. A link between precipitation patterns in the North American Great Lakes basin and the two extreme phases of the SOI, i.e. El Niño and La Niña, was established by Shabbar et al. (1997) who reported a distinct pattern of negative precipitation anomalies in the region during the first winter following the onset of El Niño events.
In this paper, the temporal coherence in SO42 concentrations has been examined in a set of 8 lakes (9 basins in total) in south-central Ontario that have experienced significant reductions in sulphate deposition over the past two decades. Lake SO42 concentration was chosen as a simple measure of the lakes recovery following decreases in S deposition. Because the change in SO42 concentration in these lakes has been substantially less than anticipated, the relationships between the observed patterns and external factors have been investigated, particularly climate, which
may have affected lake recovery. In a subsequent paper, changes in pH, alkalinity and base cation concentrations, parameters that are relevant to biological recovery, are evaluated.
Study area
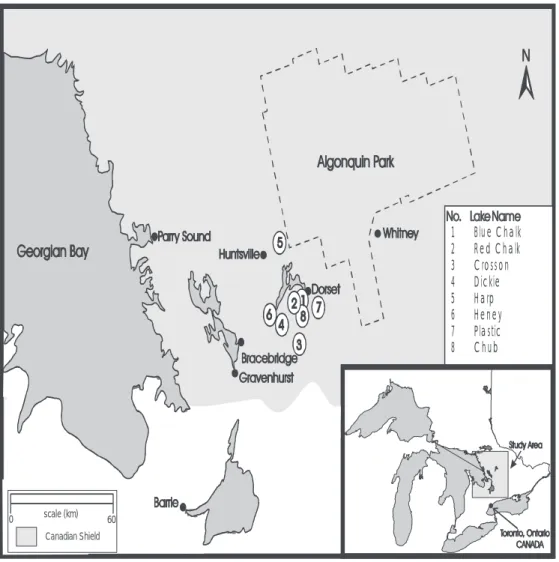
The study lakes are located in the District of Muskoka and the County of Haliburton in central Ontario on a southern extension of the Precambrian Shield, near the southern limit of the Boreal ecozone (Fig. 1). Because the bedrock comprises sparingly soluble silicate minerals, and because the overburden is very shallow (typically less than 1 m, often less than 0.3 m), this region is very sensitive to acid deposition. Furthermore, it has received levels of S deposition that are among the highest in eastern Canada, with deposition levels of between 80 and 100 meq m2 yr1 at the start of this study. Bedrock in the region is primarily
granitised biotite and hornblende gneiss, with lesser areas of amphibolite and schist. The surface geology of the upland areas is dominated by basal tills and sand deposits; these are usually covered by peat in the lowland areas. Upland soils are primarily orthic humo-ferric and ferro-humic podzols and brunisols, while the lowland areas have humisols and humic mesisols. Bedrock outcrops are found in most catchments and small, shallow beaver ponds are found in half the catchments. Several of the catchments were partially cleared c. 100130 years ago but the forests have regrown after farming was abandoned in the early 1900s. The economy of the region is controlled largely by activities related to recreation and tourism, with shoreline development extensive on two of the lakes (Harp, Dickie), light on three (Blue Chalk, Chub, Red Chalk) and absent on three (Heney, Plastic, Crosson). Selective forest harvesting has been practised periodically at several of the sites but there has been little in the past several decades. Upland
1 Blue Chalk 2 Red Chalk 3 Crosson 4 Dickie 5 Harp 6 Heney 7 Plastic 8 Chub
C:\Maps\DRC_AREA\A lakes showing CdnShield_B&W.cdr
scale (km)
0 60
Canadian Shield
portions of the lakes catchments are dominated by sugar maple (Acer saccharum Marsh.) and red maple (A. rubrum L.) with some American beech (Fagus grandifolia Ehrh.), yellow birch (Betula alleghaniensis Britt.), red oak (Quercus rubra L.), eastern hemlock (Tsuga canadensis L.) and white pine (Pinus strobus L.). Nutrient cycling in the catchments of several of the lakes (Plastic, Harp, Chub, Red Chalk) has been studied extensively (Watmough and Dillon, 2001, 2003a,b,c). Over the past 20 years, the mean precipitation in the study area was 976 mm (30% as snow), with about 5055% generating stream runoff, and the mean temperature was 5.3 degrees C.
Seven of the eight lakes are headwater lakes, while the eighth (Red Chalk) has one lake upstream; as a result, catchment to lake area ratios are relatively low for this region, and water replenishment rates are long, ranging from 1.6 to 5.7 years (Table 1). Because Red Chalk Lake has two distinct basins (East and Main) that differ chemically, and because the basin that is downstream (Main) receives only about 10% of its inflowing water from the upstream (East) basin, the basins have been treated as individual,
independent sites in the following analyses. The lakes are all dilute (conductivities of 2235 mS cm-1), with low levels of algal nutrients (TP of 414 mgL-1), and with moderate concentrations of dissolved organic carbon (DOC 25 mg CL1) that depend on the relative importance of wetlands in each lakes catchment. Both the sensitivity of the lakes to acid deposition and the degree of acidification of the study lakes varies substantially, from lakes such as Plastic and Heney that have very low alkalinities and documented biological damage (Dillon et al, 1987), to others such as Harp and Blue Chalk that, because of their thicker surficial deposits, have higher alkalinities, base cations and pHs (Table 2).
Methods
LAKE SAMPLING
The lakes were sampled from 1976; however, as there were significant changes in the analytical methods used for SO42 in 1979, data reported here for lakes begin in 1980. These
Table 2. Average SO42, total base cations (TBC) and alkalinity (measured by Gran titration) in 1980
and 1981, and in 1997 and 1998. All data in mequivL-1.
Lake Alkalinity Total Base Cations Sulphate
1980/81 2000/01 1980/81 2000/01 1980/81 1997/98 Blue Chalk 77.8 87.9234 215 148 112 Chub 13.6 18.8 217 179161 117 Crosson 10.6 11.7 196 162 150 108 Dickie 18.2 34.5 210 316 143 105 Harp 62.7 69.4 281 311 174 126 Heney 5.4 22.3 183 167 155 92 Plastic 12.7 3.3 170 129141 111
Red Chalk Main 67.3 67.7 240 206 148 116
Table 1. Area (A0), mean depth (z), drainage area (Ad), water replenishment time (Tw), conductivity, pH and
DOC; chemical data are whole-lake, ice-free period, long-term averages for 1980-2001. Red Chalk morphometry data are from the whole lake, while chemistry data are from the larger basin, Red Chalk Main.
Lake A0 (ha) z (m) Ad (ha) Tw (yr) Cond pH DOC
(uS cm-1) (mg/L) Blue Chalk (BC) 52.4 8.5 105.95.71 28.4 6.63 1.8 Chub (CB) 34.4 8.9271.8 2.15 27.1 5.62 4.9 Crosson (CN) 56.7 9.2 521.8 1.67 25.2 5.57 4.2 Dickie (DE) 93.6 5.0 406.4 1.90 30.2 5.87 5.2 Harp (HP) 71.4 13.3 470.7 3.40 35.5 6.26 3.9 Heney (HY) 21.4 3.3 71.7 1.55 23.6 5.88 3.0 Plastic (PC) 32.1 7.995.5 4.04 21.4 5.75 2.2 Red Chalk Main (RC) 57.1 14.2 480.0 2.58 28.7 6.292.5
changes in methods did not affect precipitation samples, or any other samples with low dissolved organic matter. Lakes were sampled, on average 68 times per year during the ice-free season (typically late April to the end of November). All samples were collected at the deepest location in the lake either from the upper 5 m of the water column during spring and fall overturn, or from the entire water column during the period of thermal stratification (June to October). In the latter case, samples collected from each 2 m interval were volume-weighted according to the relative contribution of that 2 m stratum to each thermal layer (epi-, meta-, hypolimnion) of the lake and combined for chemical analysis. This approach yielded volume-weighted samples representative of each layer; the analytical results for the three layers were then weighted according to the proportion of the whole lake volume that each thermal layer represented to give single, whole-lake, volume-weighted chemistry measures for each sampling date.
DEPOSITION SAMPLING AND METEOROLOGICAL PARAMETERS
Samples of bulk deposition for chemical analysis were collected in continuously open, 0.25 m2, Teflon-coated collectors positioned in the study lakes catchments and at the field laboratory. Between four and eight collectors located throughout the study area were used over the duration of this study (1976 to the present). Deposition was estimated daily at each collector site and, because all deposition collectors (and lakes) are within a 50 km radius, all collectors with data on any day were averaged to yield a daily deposition. These were summed to give monthly and annual depositions for the region. Wet-only deposition was also measured for several of the years of study and was typically 1520% lower than bulk deposition. This difference was consistent with estimates of dry deposition made using measured SO2 and particulate SO42 data with estimated deposition velocities (Dillon et al., 1988). Only bulk deposition data are reported here.
Indices describing the El Nimo Southern Oscillation, the North Atlantic Oscillation and the Arctic Oscillation were used in the statistical analyses to determine whether these global-scale phenomena were related to observed changes in the chemistry of the study lakes. The Southern Oscillation Index is a standardised measure of the concurrent differences in atmospheric pressure across the South Pacific Ocean. The occurrence of El Niño is indicated by a negative SOI value for several consecutive months (NOAA, http:// www.cpc.noaa.gov/data/indices/soi). The El Niño phase of the Southern Oscillation generally results in colder and wetter than average conditions on the west coast of North
America but warmer, drier conditions in central and eastern North America. The North Atlantic Oscillation Index is related to conditions over the Atlantic Ocean, and is calculated using sea level atmospheric pressure differences between Iceland and Gibraltar or the Azores. High positive values of the NAOI are strongly related to climatic conditions in Europe, with strong westerly winds, frontal precipitation and relatively high temperatures. Less is known about relationships with North American climate. Similarly, the Arctic Oscillation Index (AOI) relates to Arctic air masses and pressure differentials across that region. In addition to the annual values for these indices (the sum of the reported monthly values), annual data lagged by one and two years were used because earlier evidence indicated that droughts induced by the El Niño followed the onset of negative SOIs by a half year or more. In addition, seasonal values of the indices were used (each three-month period, with the summer and fall seasons being those from the previous year), and a seven-month period from September to March, as this window best captured the majority of El Niño events. In this way, each climate phenomenon created 8 summary indices. The SO42 deposition data were also combined in an analogous fashion to yield eight measures corresponding to the same time steps as the climate indices.
ANALYTICAL METHODS
From 197679, SO42 in deposition samples was measured colorimetrically (methyl thymol blue) and, from 1980 to 1999, sulphate was measured in both lake and deposition samples by ion chromatography following standard methods (Ontario Min. Envir., 1983). The two methods yielded virtually identical results for samples low in dissolved organic matter, such as deposition samples.
STATISTICAL ANALYSIS
Magnuson et al. (1990) evaluated temporal coherence among a set of Wisconsin lakes using Pearson product-moment correlations between their time-series data for all-possible pairs of lakes. Herein, temporal coherence has been estimated in SO42 concentrations between lakes using the intraclass correlation from a repeated-measures (or randomised block) analysis of variance (ANOVA; see Donner, 1986; Somers et al., 1996). The ANOVA was a two-way model without replication, with year as one factor incorporating the repeated-measures nature of the data and the pair of lakes as the second factor. The two-way interaction term in the ANOVA represents variation between lakes over years (i.e. interaction plus error given no replication). Here, lake is a blocking factor (i.e. this variation
is factored out) such that differences in the overall means for each lake are partitioned from the year-to-year variation and ignored. Since this blocking does not control differences in variances that are often correlated with the mean value, the variances for each time series were standardised to unity to ensure that the intraclass and Pearson correlations provide the same values, being analogous to using z-scored time series in either approach, but with slightly different degrees of freedom (Cronbach and Gleser, 1953). Both the Pearson and intraclass correlations measure the parallel or synchronous nature of the two time series but, relative to the Pearson correlation, the intraclass correlation is a more-general type of correlation that is not restricted to pair-wise comparisons. The intraclass correlation is better suited when the variables are responses (i.e. measured with error), and the intraclass correlation can accommodate missing data.
As in Magnuson et al. (1990), individual correlations summarise temporal coherence among pairs of lakes. The time series for 9 lake basins resulted in 36 correlations among all-possible pairs of lakes. Evaluating each of these correlations for significance presents a variety of statistical problems; alternatively an overall test of the entire matrix of between-lake correlations is available (Brien et al., 1984) to determine if: (1) the matrix of between-lake correlations is homogeneous (i.e. all pair-wise correlations are equal and hence, all of the time series are synchronous); and (2) the average between-lake correlation is significantly different from zero. Because the full matrix of correlations failed the test of homogeneity (i.e. all of the time series were not synchronous), Rusak et al. (1999) were followed and Briens test was used as an exploratory tool to identify homogeneous subsets of lakes by examining groups of lakes sequentially much as in cluster analysis. This analysis revealed two subsets of lakes with synchronous SO42 patterns. One set included 6 lakes, and the second set 4 lakes; one lake was intermediate and could be included in either subset of lakes. The z-score SO42 concentrations for each synchronous subset of lakes were averaged for each year to produce two summary time series, one for the subset of 6 lakes, and one for the subset of 4 lakes. Subsequently, multiple regression was used to determine which summary climate indices best predicted these two SO42 time series.
For each climate index, simple correlation and multiple regression were used to identify the seasonal and annual summaries that best explained variance in the SO42 patterns (P< 0.10). Because the various seasonal summaries are inter-correlated to varying degrees (i.e. redundant or multi-collinear; see Rencher and Pun, 1987), the resultant r, F and P values (and associated partial correlation statistics) were used to identify the best subsets of predictors for each of the SO42 patterns. In the final assessment, the best predictors
for each of the climate indices were included in forward-and backwards- selection stepwise multiple regressions to determine which indices accounted for the greatest amount of the between-year variation in multi-lake SO42 concentrations. Again, among-predictor redundancies were minimised to reduce problems with multi-collinearity in the multiple regressions.
Results and discussion
DEPOSITION TRENDS
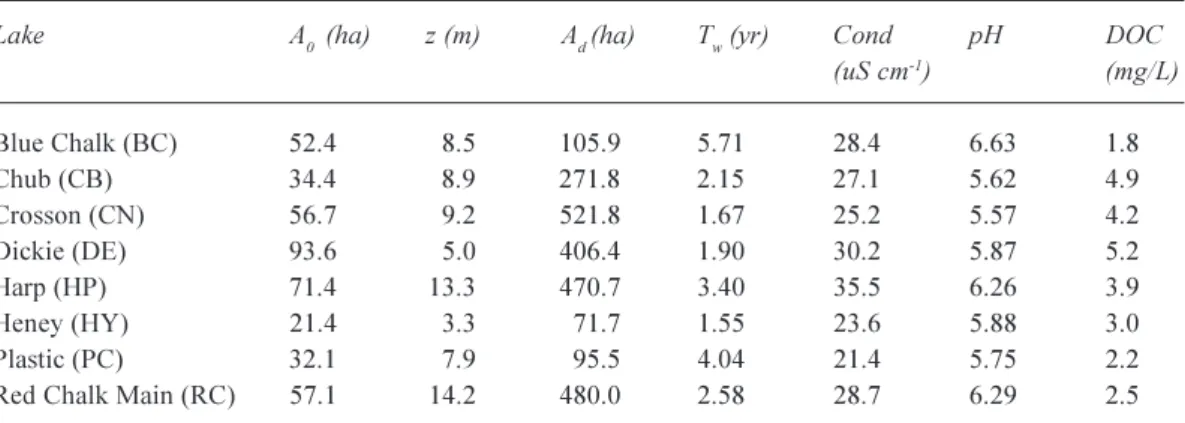
Changes in SO42, NO3 and NH4+ deposition in the study area for parts of the present investigation period have been discussed in Dillon et al. (1988), Dillon et al. (1997), Dillon and Evans (2001), Eimers and Dillon (2002) and are summarised briefly here. Deposition from 1976 to 2000 is shown in Fig. 2(A). Sulphate deposition has declined by 53% from that measured in 197678, and 46% from that of 1980; most of the decrease occurred prior to 1986. Although there were several years in the 1990s with very low SO42 deposition, these resulted from unusually low precipitation depths rather than reduced concentrations (Fig. 2B). N deposition is also reported here because it now exceeds S deposition in the study area, although NO3 and NH4+ deposition (and concentration) have changed little in 25 years, with no significant downward trends. Total inorganic nitrogen (NO3 + NH4) deposition in the study area now exceeds SO42 deposition by a substantial margin. At present, most of the inorganic nitrogen is retained in lakes (Kaste and Dillon, 2003) and catchments (Watmough and Dillon, 2003b,c), although in a few catchments NO3 leakage is relatively high (Schiff et al., 2003).
These decreases are consistent qualitatively with the change in S emissions in eastern North America. Emissions of SO2 in the U.S.A. dropped from an estimated 17.3 million tons in 1980, the baseline year for the Clean Air Act amendments of 1990, to 15.7 million in 1990 followed by 10.6 million in 2001, a total drop over 21 years of 39% (Stoddard et al., 2003). A further drop of 3.3 million tons is scheduled for 2010, bringing the total decrease to 10 million tons or almost 60%. In Canada, SO2 has declined from 3.81 million tones in 1980 to 2.52 million in 1990, 1.74 million in 1996 and 1.25 million in 2000, a drop of 68% over 20 years. Thus, the decrease in measured deposition of SO42 is consistent with the changes in SO2 emissions in eastern North America as a whole.
CHANGES IN LAKE SO42 CONCENTRATION
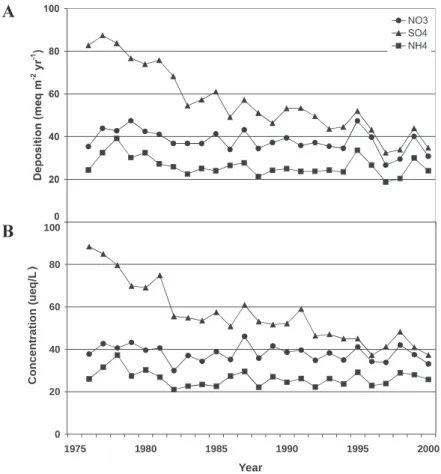
Although the 8 lakes are within a 50 km radius and SO42 deposition was uniform in this region, the SO42 concentrations differed between lakes by up to 33 meq L1 (range 141 to 174 meq L1) at the start of the study and by 34 meqL1 (range 92 to 126 meq L1) at the end of the study (Fig. 3A). The decreases in concentration over the 19-year duration of this study ranged between 21 and 41% (Table 2). The overall decline from 1980 to 1998 averaged 27%, which was substantially less than the decline in deposition over the same period. The biggest decline in SO42 concentration (Heney) was similar in magnitude to the decrease in SO42 deposition, while the decline in SO42 in all the other lakes was substantially less than that in deposition.
Changes in lake SO42 concentrations that result from a change in deposition and subsequent input rates or mass balances including catchment sources are unlikely to be instantaneous; rather, they will reflect the water replenishment rate (a measure of the hydrological turnover time) of each lake. If SO42 behaviour in the lakes is conservative (the mean mass transfer coefficient for SO42
in these lakes based on mass balance measurements over 18 years was not significantly different from 0.0 m yr1; P. J. Dillon, unpub. studies), then, based on a simple mass balance model, the half-life for change in lake concentration is (ln 2/replenishment time). Therefore, in three half-lives, the concentration would have changed c. 90% of the way to the new steady-state level, i.e. in 4.7 to 17 years for these lakes. Thus, lakes with a short water replenishment time such as Heney should respond more quickly to decreasing inputs than those with long replenishment times, e.g. Blue Chalk (Table 1). However, because almost all of the change in SO42 deposition took place pre-1986, the current lake SO42 concentrations should almost fully reflect the expected changes in all of the lakes if there are no lags in response.
A second observation is that the trends in SO42 concentration were not monotonic, nor did they match the temporal changes in SO42 deposition. During certain time periods such as 198384 and 198892, SO42 in all of the lakes, in fact, increased rather than declined. When the lake SO42 concentrations were standardised (i.e., z-score transformed Fig. 3B), it was apparent that the pattern in all lakes was consistent. Sulphate concentration declined
0 20 40 60 80 100 1975 1980 1985 1990 1995 2000 Year C o n c e n tr a ti o n (u e q /L
Fig. 2. Annual bulk deposition (top panel) and volume-weighted concentration in
deposition (bottom panel) of SO42, NO3 and NH4 in the study area.
A
A
B
Fig. 3. (A) Average annual SO42 concentration during the ice-free period (May-November) in the study lakes,
and (B) z-score transformed average annual ice-free SO42 concentration.
and increased in all lakes at the same times over the 19 years, and the patterns were independent of the water replenishment time of the lakes. This synchrony in patterns was independent of the physical or chemical characteristics of the lakes or their catchments; although differences in these factors may well have caused the differences in initial concentrations of SO42 in these lakes.
Using coherence analysis to pick the subsets of lakes with patterns that were not significantly different, it was determined that Red Chalk East, Chub, Dickie, Red Chalk Main, Crosson and Plastic Lakes formed a set with a common temporal SO42 pattern, while Harp, Blue Chalk, Heney and Plastic Lakes formed a second set. Since the lake selection was done with replacement, it was possible for a lake to belong to more than 1 subset; however, Plastic Lake was the only instance where this occurred. Three of the four lakes in the second group have the longest water replenishment times, suggesting that their response to changes in deposition or other factors may become evident at a slower rate, i.e. that the response of the second group may be similar to, but less than that of the first group.
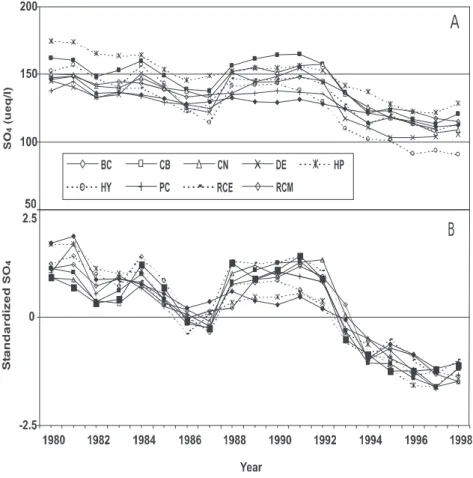
The mean of the z-scored concentrations of the lakes in each grouping were used in the subsequent development of predictive models. Although this analysis generated two groups of lakes, the two SO42 concentration patterns were very similar (Fig. 4). As noted above, the similarity in the patterns may simply reflect a delay in the timing of the response between the two subsets of lakes. In addition, the fact that Plastic Lake was intermediate between the two subsets suggests that a gradient in response actually exists. Alternatively, different climatic factors may be involved.
FACTORS AFFECTING THE SO42 CONCENTRATION
PATTERNS
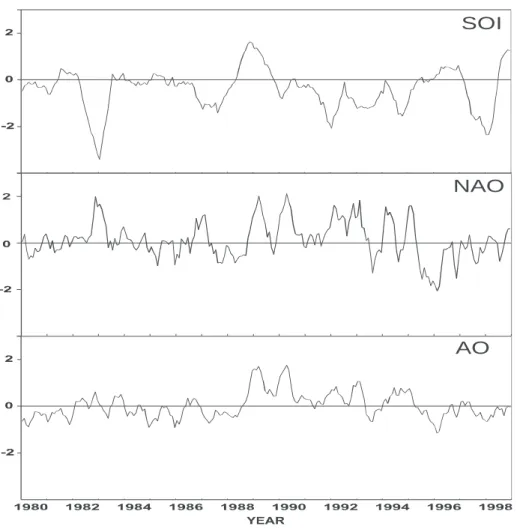
The SO42 pattern of each of the subset of lakes demonstrated increases in specific periods, e.g. 198384, 198892, etc. Dillon and Evans (2001) reported increases in lake SO42 concentration after each El Niño, i.e. following periods where the SOI was negative for 6 or more months (Fig. 5). Previously, this has been explained, qualitatively, in the cases of Plastic and Heney Lakes (Dillon et al., 1997; Dillon and
-2.5 0.0 2.5 1980 1982 1984 1986 1988 1990 1992 1994 1996 1998 year St andar d iz ed SO 4 CB CN DE PC RCE RCM BC HP HY PC
SOI
NAO
AO
Fig. 4. Trend in z-scored SO42 concentration for the 2 lake groups. Group 1 includes Chub, Crosson, Dickie, Plastic,
Red Chalk East and Red Chalk Main, while group 2 includes Harp, Blue Chalk, Heney and Plastic Lakes.
Fig. 5. Southern Oscillation Index (SOI), North Atlantic Oscillation Index (NAOI) and Arctic Oscillation Index (AOI) (standardised values). Lines represent 6-month moving averages of monthly data.
Evans, 2001; Eimers and Dillon, 2002) on the basis of drought-induced re-oxidation of previously stored S and/or enhanced mineralisation of S-containing material that was subsequently mobilised from the catchments into the lakes as SO42. The results reported here are consistent with this interpretation. Although it might be expected that the North Atlantic and the Arctic Oscillations are linked to the ENSO, correlations of the NAOI and AOI with the SOI were weak in almost all cases. The strongest correlation coefficient between any SOI and any of the NAOI or AOI was only 0.47 (the SOI lagged by 1 year with the spring AOI), and virtually all correlations were not significant. On the other hand, almost half (24 of 64) of the correlations between NAOI and AOI were significant.
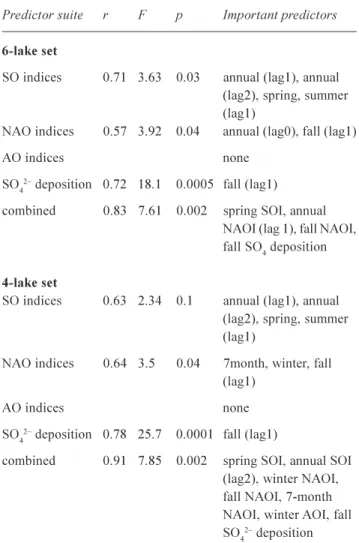
Because there were only 19 years of lake chemistry data, the predictor variables in each suite were examined separately to avoid over-parameterisation of the models. In both cases, i.e. for each lake group, good models using the SOI, the NAOI or the SO42 deposition resulted (Table 3). Using only the SOI, significant contributors to the model included the annual SOI, with both one-year and two-year lags, as well as the spring and summer SOI. The same four SOI indices were chosen for both lake groups, suggesting a common response to the El Niño phenomenon. Although there is, obviously, some degree of collinearity between these four SOI indices, the modelling procedure takes this into consideration and includes additional variables only after the most strongly correlated variables have been selected, and only if they explain significantly more of the variance. It is noteworthy that the indices chosen that are related to the ENSO all represented atmospheric conditions prior to the period when the lake measurements were made, with data up to two years earlier being important (annual SOI lagged two years). These results are consistent with the hypothesis that the response of the lakes is affected by the ENSO.
When the suite of NAO indices was used, significant models based on the unlagged annual index plus the fall index (lake set 1) and the winter, fall and seven-month indices (lake set 2) were produced. These were weaker (lake set 1) or comparable (lake set 2) to the models based on the SOI suite (Table 3). The suite of AO indices yielded no significant models despite the many significant correlations between individual NAO and AO indices.
The suite of SO42 deposition indices was also tested separately. Since both lake SO42 concentration and SO42 deposition declined over the duration of the study, and since other studies had reported that declining lake levels were related to declining deposition, it was thought that changes in deposition would have been at least partially responsible for the measured changes in lake chemistry. Significant
Table 3. SO42 predictions (using backwards elimination stepwise
multiple regression) for each of the two groupings of lakes based on suites of parameters
Predictor suite r F p Important predictors 6-lake set
SO indices 0.71 3.63 0.03 annual (lag1), annual (lag2), spring, summer (lag1)
NAO indices 0.57 3.92 0.04 annual (lag0), fall (lag1)
AO indices none
SO42 deposition 0.72 18.1 0.0005 fall (lag1)
combined 0.83 7.61 0.002 spring SOI, annual NAOI (lag 1), fall NAOI, fall SO4 deposition
4-lake set
SO indices 0.63 2.34 0.1 annual (lag1), annual (lag2), spring, summer (lag1)
NAO indices 0.64 3.5 0.04 7month, winter, fall (lag1)
AO indices none
SO42 deposition 0.78 25.7 0.0001 fall (lag1)
combined 0.91 7.85 0.002 spring SOI, annual SOI (lag2), winter NAOI, fall NAOI, 7-month NAOI, winter AOI, fall SO42 deposition
fall = average for Sept-Nov; winter = average for Dec-Feb; spring = average for Mar-May; summer = average for Jun-Aug; ann (lag0) = annual average for same year; ann (lag1) = average value for preceeding year; ann (lag2) = annual average 2 years prior
models for both lake sets resulted, in each case with the SO42 deposition in the previous fall period being the only predictor. For lake set 1, this model was comparable in predictive ability to the SOI-based model, while for lake set 2, it was somewhat better (Table 3). Models that were almost as good as these models based on the fall deposition could be built using the SO42 deposition measurements for any of the time periods but, because of the very strong inter-correlation between the depositions measured over each of the time intervals, only one parameter was needed.
The subset of parameters from each of the four suites used to generate the suite-specific models were combined to build a model based on both SO42 deposition and climate-related parameters. This allowed a smaller, more reasonable total
number of parameters to be used (7 identified in Table 3 for lake set 1, 8 for lake set 2). To each model set was added the AOI parameter (winter AOI) that had the strongest correlation with the lake SO42 because backwards stepwise multiple regression procedures may include pairs of variables that are not significant individually but, jointly, account for significant amounts of the total variation. The backwards stepwise regression yielded better models (Table 3) than those based on single predictor suites, with 69 and 83% of the variance in lake SO42 being explained for lake sets 1 and 2, respectively. In both cases, SOI, NAOI and SO42 deposition measures were included in the overall model.
These results indicate clearly that the response of lakes to declining SO42 deposition is controlled by changes in both deposition and climate. These climate factors are regional if not global in scale, rather than dependent simply on local variations in meteorological variables. They may act by influencing local climate or weather but almost certainly have broad regional impacts, as phenomena such as the ENSO result in perturbations on scales greater than continental.
There is evidence that the ENSO results in changes in hydrology through altered precipitation and temperature regimes in eastern North America (Shabbar et al., 1997). This is consistent with drought-induced changes to S cycling, including redox and mineralisation processes. Reduced precipitation and higher temperature both favour lower water tables in the wetland portions of lakes catchments; these, in turn, can result in re-oxidation of previously-stored reduced S species (Schindler et al., 1996). Since re-oxidation is an acid-producing process and since the product (SO42) is much more soluble than the initial reduced species, this mechanism can effectively buffer downstream lake SO42 concentrations. Similarly, mineralisation of organic matter in the lakes catchments, with release of soluble SO42 (Löfgren et al., 2001) is favoured by higher temperatures. The third SO42 buffering mechanism, desorption of previously adsorbed SO42 from the soil (Alewell, 2001), is likely to be more dependent on changes in S deposition than on climate parameters. These mechanisms that relate the climate indices to the measurements of lake response are currently being explored.
Summary
Temporal coherence can be defined as the correlation or synchrony between time series. When temporal coherence in SO42 concentrations between nine lake basins was estimated using the intraclass correlation from a repeated-measures analysis of variance, two subsets of lakes with
synchronous patterns were found. The difference between the subsets patterns is most likely related to the response time of the lakes in each subset; one subset (4 lakes) included those with the longest water replenishment time, which are expected to respond less to decreases in SO42 deposition. The response of the lakes to the decrease in SO42 deposition over two decades was independent of the degree of acidification or sensitivity to acidification of the lakes. The factors which best predicted the temporal pattern of SO42 in the lakes were regional/global-scale climate indices, specifically the Southern Oscillation Index describing the ENSO and the North Atlantic Oscillation Index, and SO42 deposition indices; each produced good individual predictive models. When the predictor variables were combined, the best models describing the long-term changes in lake SO42 concentration included the SOI, NAOI and SO42 deposition. Thus, large-scale climate factors play a major role in determining the response of aquatic systems to changes in SO42 deposition and should be considered when predicting and interpreting the response of lakes to changes in SO42 deposition.
Acknowledgments
This study was funded by grants from the Natural Sciences and Engineering Research Council of Canada and Ontario Power Generation Inc. to PJD and the Ontario Ministry of the Environment. The authors thank Lem Scott for assistance with the field work, and Peter Sutey and Don Evans for laboratory work. This work was conducted as part of a collaborative research programme between Trent University and the Commission of European Communities RECOVER: 2010 project (EVKI-CT-1999-00018).
References
Alewell, C., 2001. Predicting reversibility of acidification: The European sulfur story. Water Air Soil Pollut., 130, 12711276. Anderson, W.L., Robertson, D.M. and Magnuson, J.J., 1996. Evidence of recent warming and El-Niño-related variations in ice breakup of Wisconsin lakes. Limnol. Oceanogr., 41, 815 821.
Baron, J.S. and Caine, N., 2000. Temporal coherence of two alpine lake basins of the Colorado Front Range, U.S.A. Freshwater
Biol., 43, 463476.
Bouchard, A., 1997 Recent lake acidification and recovery trends in southern Quebec, Canada. Water Air Soil Pollut., 94, 225 245.
Brien, C.J., Venables, W.N., James, A.T. and Mayo, O., 1984. An analysis of correlation matrices: equal correlations. Biometrika,
71, 545554.
Clair, T.A., Devarennes, G. and Howell, G., 1992. Chemistry Trends
in Atlantic Canada Lakes, Environment Canada, Conservation
and Protection Service, Inland Waters Branch, Moncton, New Brunswick.
Clair, T.A., Dillon, P.J., Ion, J., Jeffries, D.S., Papineau, M. and Vet, R.J., 1995. Regional precipitation and surface water chemistry trends in southeastern Canada (1983-1991). Can. J.
Fisheries Aquat. Sci., 52, 197-212.
Clair, T.A., Ehrman, J.M., Ouellet, A.J., Brun, G., Lockerbie, D. and Ro, C.-U., 2002. Changes in freshwater acidification trends in Canadas Atlantic provinces: 1983-1997. Water Air Soil
Pollut., 135, 335354.
Cronbach, L.J. and Gleser, G.C., 1953. Assessing similarity between profiles. Psychol. Bull., 50, 456473.
Devito, K.J., Hill, A.R. and Dillon, P.J., 1999. Episodic sulphate export from wetlands in acidified headwater catchments: prediction at the landscape scale. Biogeochem., 44, 187203. Dillon, P.J. and LaZerte, B.D., 1992. Response of the Plastic Lake
catchment, Ontario to reduced sulphur deposition. Environ.
Pollut., 77, 211217.
Dillon, P.J. and Evans, H.E., 2001. Long-term changes in the chemistry of a soft-water lake under changing acidic deposition rates and climate fluctuations. Verh. Int. Verein. Limnol., 27, 26152619.
Dillon, P.J., Reid, R.A. and de Grosbois, E., 1987. The rate of acidification of aquatic ecosystems in Ontario, Canada. Nature,
329, 4548.
Dillon, P.J., Lusis, M., Reid, R. and Yap, D., 1988. Ten-year trends in sulphate and nitrate deposition in central Ontario. Atmos.
Environ., 22, 901905.
Dillon, P.J., Molot, L.A. and Futter, M., 1997. The effect of El-Niño-related drought on the recovery of acidified lakes. Environ.
Monit. Assess., 46, 105111.
Donner, A., 1986. A review of inference procedures for the intraclass correlation coefficient in the one-way random effects model. Int. Statist. Rev., 54, 6782.
Driscoll, C.T. and van Dreason, R., 1993. Seasonal and long-term temporal patterns in the chemistry of Adirondack lakes. Water
Air Soil Pollut., 67, 319344.
Driscoll, C.T., Postek, K.M., Kretser, W. and Raynal, D.J., 1995. Long-term trends in the chemistry of precipitation and lake water in the Adirondack region of New York, USA. Water Air Soil
Pollut., 85, 583588.
Eimers, M.C. and Dillon, P.J., 2002. Climate effects on sulphate flux from forested catchments in south-central Ontario.
Biogeochem., 61, 337355.
Evans, C.D., Monteith, D.T. and Harriman, R., 2001. Long-term variability in the deposition of marine ions at west coast sites in the UK Acid Waters Monitoring Network: impacts on surface water chemistry and significance for trend detection. Sci. Total
Environ., 265, 115129.
George, D.G., Talling, J.F. and Rigg, E., 2000. Factors influencing the temporal coherence of five lakes in the English Lake District.
Freshwater Biol., 43, 449461.
Hedin, L.O., Likens, G.E. and Bormann, F.H., 1987. Decrease in precipitation acidity resulting from decreased SO42
concentration. Nature, 325, 244246.
Hill, T.J., Skeffington, R.A. and Whitehead, P.G., 2002. Recovery from acidification in the Tillingbourne catchment, southern England: catchment description and preliminary results. Sci.
Total Environ., 282-283, 8197.
Houle, D., Paquin, R., Camiré, Ouimet, R. and Duchesne, L., 1996. Response of the Lake Clair Watershed (Duchesnay, Quebec) to changes in precipitation chemistry (1988-1994). Can. J. Forest
Res., 27, 18131821.
Jeffries, D.S., Lam, D.C.L., Wong, I. and Moran, M.D., 2000. Assessment of changes in lake pH in southeastern Canada arising from present levels and expected reductions in acidic deposition.
Can. J. Fisheries Aquat. Sci., 57, 4049.
Kahl, J.S., Haines, T.A., Norton, S.A. and Davis, R.B., 1993.
Recent trends in the acid-base status of surface waters in Maine, USA. Water Air Soil Pollut., 67, 281300.
Kaste, O. and Dillon, P.J., 2003. Inorganic nitrogen retention in acid-sensitive lakes in southern Norway and southern Ontario, Canada - a comparison of mass balance data with an empirical N retention model. Hydrol. Process., 17, 23932408.
Löfgren, S., Bringmark, L., Aastrup, M., Hultberg, H., Kindbom, K. and Kvarnäs, H., 2001. Sulphur balances and dynamics in three forested catchments in Sweden. Water Air Soil Pollut.,
130, 631636.
Magnuson, J.J., Benson, B.J. and Kratz, T.K., 1990. Temporal coherence in the limnology of a suite of lakes in Wisconsin, U.S.A. Freshwater Biol. 23, 145159.
Mitchell, M.J., Mayer, B., Bailey, S.W., Hornbeck, J.W., Alewell, C., Driscoll, C.T. and Likens, G.E., 2001. Use of stable isotope ratios for evaluating sulphur sources and losses at the Hubbard Brook Experimental Forest. Water Air Soil Pollut., 130, 7586. Monteith, D.T., Evans, C.D. and Reynolds, B., 2000. Are temporal variations in the nitrate content of UK upland freshwaters linked to the North Atlantic Oscillation? Hydrol. Process., 14, 1745 1749.
Newell, A., 1993. Inter-regional comparison of patterns and trends in surface water acidification across the United States. Water
Air Soil Pollut., 67, 257280.
Ontario Ministry of the Environment, 1983. Handbook of
Analytical Methods for Environmental Samples, vol. 1 and 2,
Toronto, Ontario, Canada.
Rencher, A.C. and Pun, F.C., 1987. Inflation of R2 in best subset
regression. Technometrics, 22, 4953.
Rusak, J.A., Yan, N.D., Somers, K.M. and McQueen, D.J., 1999. The temporal coherence of zooplankton population abundances in neighbouring north-temperate lakes. Amer. Naturalist, 153, 4658.
Schiff, S.L., Devito, K.J., Elgood, R.J., McCrindle, P.M., Spoelstra, J. and Dillon, P.J., 2002. Two adjacent catchments: dramatically different nitrate export. Water Resour. Res., 38, 1292.. Schindler, D.W., Bayley, S.E., Parker, B.R., Beaty, K.G.,
Cruikshank, D.R., Fee, E.J., Schindler, E.U and Stainton, M.P., 1996. The effects of climatic warming on the properties of boreal lakes and streams at the Experimental Lakes Area, northwestern Ontario. Limnol. Oceanogr., 41, 10041017.
Sirois, A. and Summers, P.W., 1989. An estimation of atmospheric deposition input of sulphur and nitrogen oxides to the Kejimkujik watershed: 1979-1987. Water Air Soil Pollut., 46, 2943.
Shabbar, A., Bonsal, B. and Khandekar, M., 1997. Canadian precipitation patterns associated with the Southern Oscillation.
J. Climate, 10, 30163027.
Somers, K.M., Reid, R.A., David, S.M. and Ingram, R. 1996. Are the relative abundances of orconectid crayfish better indicators of water-quality changes than cambarid abundances? Freshwater
Crayfish, 11, 249265.
Stoddard, J.L. and Kellogg, J.H., 1993. Trends and patterns in lake acidification in the state of Vermont: evidence from the long-term monitoring project. Water Air Soil. Pollut., 67, 301 317.
Stoddard, J.L., Driscoll, C.T., Kahl, J.S. and Kellogg, J.H., 1998. A regional analysis of lake acidification trends for the northeastern U.S., 1982-1994. Environ. Monitor. Assess., 51, 399413.
Stoddard, J.L., Kahl, J.S., Deviney, F.A., DeWalle, D.R., Driscoll, C.T., Herlihy, A.T., Kellogg, J.H., Murdoch, P.S., Webb, J.R. and Webster, K.E., 2003. Response of Surface Water Chemistry
to the Clean Air Act Amendments of 1990, U.S. Environmental
Protection Agency, Office of Research and Development, Research Triangle Park, NC. EPA 620/R-03/001, 74pp.
Watmough, S.A. and Dillon, P.J., 2001. Base cation losses from a coniferous catchment in central Ontario, Canada. Water Air Soil
Pollut, Focus, 1, 507524.
Watmough, S.A. and Dillon, P.J., 2003a. Major element fluxes from a coniferous catchment in central Ontario, 1983-1999.
Biogeochem., (in press).
Watmough, S.A. and Dillon, P.J., 2003b. Base cation and nitrogen budgets for a mixed hardwood catchment in south-central Ontario. Ecosystems, 6, 675693.
Watmough, S.A. and Dillon, P.J., 2003c. Base cation and nitrogen budgets for seven forested catchments in central Ontario, 1983-1999. Forest Ecol. Manage, 177, 155177.
Webster, K.E. and Brezonik, P.L., 1995. Climate confounds detection of chemical trends related to acid deposition in upper Midwest lakes in the USA. Water Air Soil Pollut. 85, 1575 1580.
Webster, K.E, Brezonik, P.L. and Holdhusen, B.J., 1993. Temporal trends in low alkalinity lakes of the Upper Midwest (1983-1989).
Water Air Soil Pollut., 67, 397-414.
Webster, K.E., Soranno, P.A., Baines, S.B., Kratz, T.A, Bowser, C.J., Dillon, P.J., Campbell, P., Fee, E.J. and Hecky, R.E., 2000. Structuring features of lake districts: landscape controls on lake chemical responses to drought. Freshwater Biol., 43, 499515. Wilander, A., 2001. Effects of reduced S deposition on large-scale transport of sulphur in Swedish rivers. Water Air Soil Pollut.,
130, 14211426.
Wright, R.F. and Jenkins, A., 2001. Climate change as a confounding factor in reversibility of acidification: RAIN and CLIMEX projects. Hydrol. Earth Syst. Sci., 5, 477486.