HAL Id: hal-00728428
https://hal.archives-ouvertes.fr/hal-00728428
Submitted on 8 Jun 2021
HAL is a multi-disciplinary open access
archive for the deposit and dissemination of
sci-entific research documents, whether they are
pub-lished or not. The documents may come from
teaching and research institutions in France or
abroad, or from public or private research centers.
L’archive ouverte pluridisciplinaire HAL, est
destinée au dépôt et à la diffusion de documents
scientifiques de niveau recherche, publiés ou non,
émanant des établissements d’enseignement et de
recherche français ou étrangers, des laboratoires
publics ou privés.
Distributed under a Creative Commons Attribution| 4.0 International License
PPARγ contributes to PKM2 and HK2 expression in
fatty liver.
Ganna Panasyuk, Catherine Espeillac, Céline Chauvin, Ludivine A Pradelli,
Yasuo Horie, Akira Suzuki, Jean-Sebastien Annicotte, Lluis Fajas, Marc
Foretz, Francisco Verdeguer, et al.
To cite this version:
Ganna Panasyuk, Catherine Espeillac, Céline Chauvin, Ludivine A Pradelli, Yasuo Horie, et al..
PPARγ contributes to PKM2 and HK2 expression in fatty liver.. Nature Communications, Nature
Publishing Group, 2012, 3, pp.672. �10.1038/ncomms1667�. �hal-00728428�
Received 10 nov 2011 | Accepted 9 Jan 2012 | Published 14 Feb 2012 DOI: 10.1038/ncomms1667
Rapidly proliferating cells promote glycolysis in aerobic conditions, to increase growth rate. Expression of specific glycolytic enzymes, namely pyruvate kinase m2 and hexokinase 2, concurs to this metabolic adaptation, as their kinetics and intracellular localization favour biosynthetic processes required for cell proliferation. Intracellular factors regulating their selective expression remain largely unknown. Here we show that the peroxisome proliferator-activated receptor gamma transcription factor and nuclear hormone receptor contributes to selective pyruvate kinase m2 and hexokinase 2 gene expression in PTEN-null fatty liver. Peroxisome proliferator-activated receptor gamma expression, liver steatosis, shift to aerobic glycolysis and tumorigenesis are under the control of the Akt2 kinase in PTEN-null mouse livers. Peroxisome proliferator-activated receptor gamma binds to hexokinase 2 and pyruvate kinase m promoters to activate transcription. In vivo rescue of peroxisome proliferator-activated receptor gamma activity causes liver steatosis, hypertrophy and hyperplasia. our data suggest that therapies with the insulin-sensitizing agents and peroxisome proliferator-activated receptor gamma agonists, thiazolidinediones, may have opposite outcomes depending on the nutritional or genetic origins of liver steatosis.
1 Inserm, U845, Paris 75015, France. 2 Université Paris Descartes, Faculté de Médecine, UMRS-845, Paris, France. 3 Inserm, U895, Centre Méditerranéen de Médecine Moléculaire (C3M), équipe AVENIR, Nice 06204, France. 4 Université de Nice-Sophia-Antipolis, Faculté de Médecine, Nice F-06204, France. 5 Department of Gastroenterology, Akita University Graduate School of Medicine, Akita 010-8543, Japan. 6 Division of Cancer Genetics, Medical Institute of Bioregulation, Kyushu University, Fukuoka 812-8582, Japan. 7 Global COE program, Akita University Graduate School of Medicine, Akita, Japan 010-8543. 8 Institut de Recherche en Cancérologie de Montpellier, INSERM U896, Montpellier 34298, France. 9 Institut Cochin, Université Paris Descartes, CNRS (UMR 8104), Inserm, U1016, Paris F-75014, France. 10 INSERM, Centre de Recherches des Cordeliers, UMR-S 872, 75006 Paris, France. 11 INSERM UMR865, Faculté Laennec, F–69372 Lyon Cedex 08, France. 12 Howard Hughes Medical Institute and The Department of Medicine, University of Pennsylvania School of Medicine, Philadelphia, Pennsylvania 19104, USA. Correspondence and requests for materials should be addressed to M.P. (email: [email protected]).
PPAR
γ contributes to PKm2 and HK2 expression
in fatty liver
Ganna Panasyuk
1,2, Catherine Espeillac
1,2, Céline Chauvin
1,2, Ludivine A. Pradelli
3,4, Yasuo Horie
5,
Akira suzuki
6,7, Jean-sebastien Annicotte
8, Lluis Fajas
8, marc Foretz
9, Francisco Verdeguer
9,
marco Pontoglio
9, Pascal Ferré
10, Jean-Yves scoazec
11, morris J. Birnbaum
12, Jean-Ehrland Ricci
3,4& mario Pende
1,2ARTICLE
nATuRE CommunICATIons | DoI: 10.1038/ncomms1667G
lycolysis generates energy and intermediates for macro-molecule biosynthesis. Hence the growth factors, ana-bolic hormones and oncogenic events perfected molecular mechanisms to upregulate glycolytic enzyme activities and gene expression1. The phosphatidylinositol-3-kinase (PI3K) pathway,a master regulator of cell growth, proliferation and metabolism in response to insulin, growth factors and oncogenic insults, is a potent stimulator of glycolysis by acting on different levels, from the upregulation of glucose uptake at the membrane, to the post-translational modifications of glycolytic enzymes, to the induction of glycolytic gene expression2. In the nucleus, the transcription
factor c-Myc, encoded by the MYC oncogene, directly binds and activates the majority of glycolytic gene promoters3. In addition,
the hypoxia-inducible factor 1 (HIF-1), which can accumulate in cells as a consequence of inactivating mutations in the Von Hippel– Lindau (VHL) tumour suppressor gene, cooperates with c-Myc on the transcriptional activity of the glycolytic gene promoters4. Further
complexity comes from the existence of multiple isozymes catalys-ing specific reactions in glycolysis. For instance, four hexokinases (HK1-4) catalyse the first step of glycolysis, that is, the phosphoryla-tion of glucose, while four pyruvate kinases (PKM1, PKM2, PKL, PKR) catalyse the last step of glycolysis, that is, the final conver-sion of phosphoenolpyruvate to pyruvate. These isozymes display differential tissue distribution and confer specific kinetic and regu-latory properties to the glycolytic flux5–7. However the molecular
mechanisms favouring selective expression of specific isozymes remain mysterious.
Pyruvate, the end product of glycolysis, can be reduced to lactate in the cytosol during anaerobic conditions or enter the mitochondria to be further oxidized during aerobic respiration. In rapidly dividing cells, lactate production is also observed under normal oxygen con-ditions, a phenomenon called aerobic glycolysis or Warburg effect, which may provide a growth advantage by producing carbon inter-mediates as building blocks for cellular components1. Among the
gly-colytic isozymes, the expression of hexokinase 2 (HK2) and the M2 isoform of pyruvate kinase (PKM2) may particularly favour aerobic glycolysis and cell proliferation owing to their intracellular locali-zation and kinetic properties. The features of HK2 that may favour aerobic glycolysis are mitochondrial localization that allows the consumption of mitochondrially produced ATP to start glycolysis, a relatively high affinity for glucose and presence of two catalytically active domains that double the rate of glucose-6-phosphate forma-tion5,6. Although the other pyruvate kinase isozymes are exclusively
tetrameric enzymes, PKM2 can also switch to a less active dimeric form by allosteric regulation in presence of mitogenic signals, lead-ing to the accumulation of glycolytic intermediates that can be used to increase the biomass8. Consistently, HK2 and PKM2 isozymes
are reported to be predominantly expressed in highly malignant tumours, and their functional role in promoting tumour progression has been demonstrated7,9. Particularly, a relative switch from HK4
(also named glucokinase) to HK2, and from PKL to PKM2 has been observed during progressive stages of liver transformation10–12.
In liver, insulin signalling through the PI3K pathway has a fundamental role in the regulation of lipid and glucose metabolism, and pathophysiological growth. Gene deletions abrogating PI3K activity in mouse liver lead to severe insulin resistance, glucose intol-erance, increased glucose output and defective lipid neogenesis13.
Conversely, mutations activating the PI3K pathway, including the liver-specific deletion of the phosphatidylinositol (3,4,5)-triphos-phate-lipid phosphatase and tumor suppressor PTEN (phosphatase and tensin homologue) gene, caused insulin hypersensitivity, improved glucose tolerance, hepatomegaly, steatosis in young adult mice, followed by adenocarcinoma formation since 7 months of
age14,15. Among the PI3K-dependent effectors, the serine/threonine
kinase Akt2 is required for the regulation of hepatic glucose output, lipid accumulation, and tumorigenesis in PTEN-null livers16–19. In
this report, we therefore performed genetic epistasis experiments to address the impact of PI3K/Akt2 activity on liver glycolysis. Strikingly, we find that, whereas PTEN deletion causes a general upregulation of glycolytic gene expression, Akt2 selectively controls HK2 and PKM2 isozymes. We identify peroxisome proliferator- activated receptor gamma (PPARγ) nuclear hormone receptor as a novel transcription factor turning on these specific glycolytic iso-zymes that are frequently upregulated in pathophysiological growth.
Results
Activation of glycolysis in PTEN-null liver. Consistent with the
positive role of the PI3K pathway on the cell switch to glycolytic metabolism2, PTEN-null mouse livers showed a global upregulation
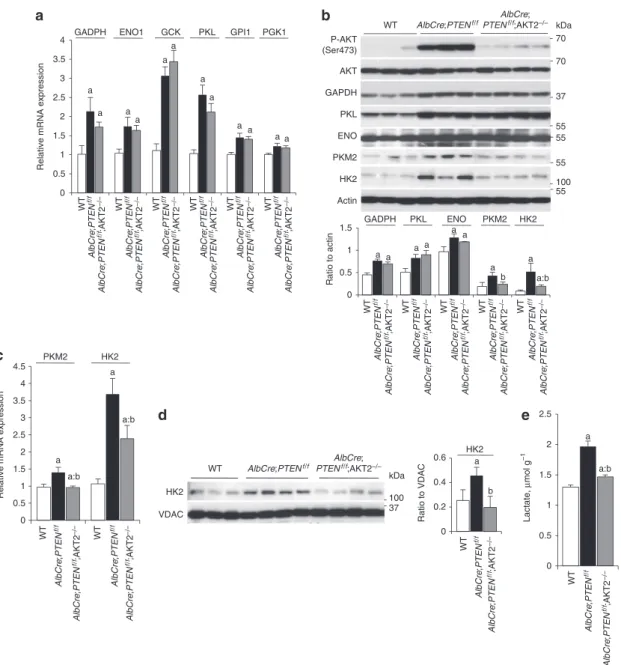
of glycolytic enzymes (Fig. 1). The expression of multiple glycolytic enzymes that are commonly expressed in liver, including glucokinase (GCK), glucose phosphate isomerase 1 (GPI1), glyceraldehyde 3-phosphate dehydrogenase (GAPDH), enolase 1 (ENO1), phos-phoglycerate kinase 1 (PGK1) and L-type pyruvate kinase (PKL) was augmented at the messenger RNA and protein levels (Fig. 1a,b). The increase in expression paralleled increased enzymatic activity, while mitochondrial enzymes such as citrate synthase and cytochrome c oxydase were not affected (Supplementary Fig. S1). These metabolic changes were concomitant with liver triglyceride accumulation (steatosis) and hyperplasia, hypoglycaemia and insulin hypersensitivity, and preceded the adenocarcinoma formation that was observed since 7 months of age14,15 (Supplementary Fig. S2).
As Akt2 has a crucial role mediating the action of insulin and PI3K on hepatic glucose homeostasis, steatosis, hyperplasia and tumorigenesis16,17,19 (Supplementary Fig. S2), we addressed the
effect of Akt2 deletion on glycolysis of PTEN-null livers. Surprisingly, the upregulation of all the above mentioned glycolytic enzymes was also observed in AlbCre;PTENf/f;Akt2 − / − livers (Fig. 1a,b;
Supplementary Fig. S1), ruling out an involvement of Akt2 in this general activation of glycolysis.
Akt2 controls expression of HK2 and PKM2 in PTEN-null liver.
Specific glycolytic isozymes, namely HK2 and PKM2 have been demonstrated to favour aerobic glycolysis and growth7,20. PKM2
and HK2 are expressed at low levels in wild-type adult mouse livers. As shown in Figure 1b and in Figure 1c, PTEN deletion upregulated HK2 and PKM2 mRNA and protein expression. Importantly, Akt2 deletion was sufficient to reduce by 40–60% the expression of both isozymes at 3 months of age, well before tumour onset. In addition,
Akt2 deletion also blunted mitochondrial levels of HK2 (Fig. 1d),
which should affect ATP usage towards glycolysis20. Finally, the
dif-ference in HK2 and PKM2 expression in AlbCre;PTENf/f;Akt2 − / −
livers was accompanied by lower levels of hepatic lactate as com-pared with AlbCre;PTENf/f (Fig. 1e). Taken together, these data
indi-cate that Akt2 promotes aerobic glycolysis in PTEN-null fatty liver.
Expression of HK2 and PKM2 isozymes promotes liver growth.
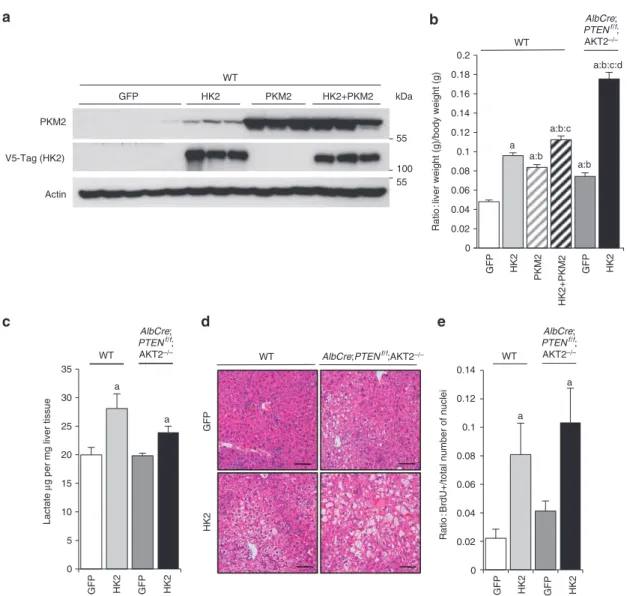
To evaluate the functional outcome of glycolytic isozymes expres-sion on liver pathophysiology, adenoviral-mediated HK2 overex-pression was achieved in vivo (Fig. 2a). HK2 overexoverex-pression led to a 100% increase in liver mass in wild type, and a 135% increase in AlbCre;PTENf/f;Akt2 − / − mice (Fig. 2b). In addition, HK2
pro-moted lactate production, steatosis and hepatocyte proliferation (Fig. 2c,d,e). HK2 also upregulated triglyceride content and lactate release after 60 h of overexpression in wild-type primary hepatocyte cultures (Supplementary Fig. S3). PKM2 overexpression in vivo in wild-type mice caused a 74% increase in liver mass, an effect that was comparable to HK2 (Fig. 2b). The combination of both HK2 and PKM2 further increased liver mass to 134% as compared with green fluorescent protein (GFP)-treated control mice. Thus HK2 and PKM2 overexpression at supraphysiological levels is sufficient to cause liver steatosis and growth. In conclusion, a specific pattern
of glycolytic isozyme expression correlates with the Akt2-depend-ent steatosis, hyperplasia and oncogenic potAkt2-depend-ential of PTEN-null liver cells.
Akt2 controls PPARγ activity in PTEN-null liver. Given the
distinctive features of PKM2 and HK2 isozymes in regulating cell metabolism, we set out to determine the transcription factor(s) responsible for their selective Akt2-dependent regulation in PTEN-null hepatocytes. We initially considered the involvement of c-Myc and HIF1α transcription factors, two potent stimulators of glycolytic gene transcription4. Consistently, adenoviral
transduc-tion of c-Myc and HIF1α in primary hepatocytes increased PKM2 and HK2 expression in addition to other glycolytic enzymes such as GAPDH, PGK1, ENO1 as well as LDHA, a known non-glycolytic target of both factors (Supplementary Fig. S4a). However, we failed
to reveal a significant regulation of c-Myc and HIF1α expression at the level of mRNA, total protein and nuclear protein in the wild type, AlbCre;PTENf/f and AlbCre;PTENf/f;Akt2 − / − livers
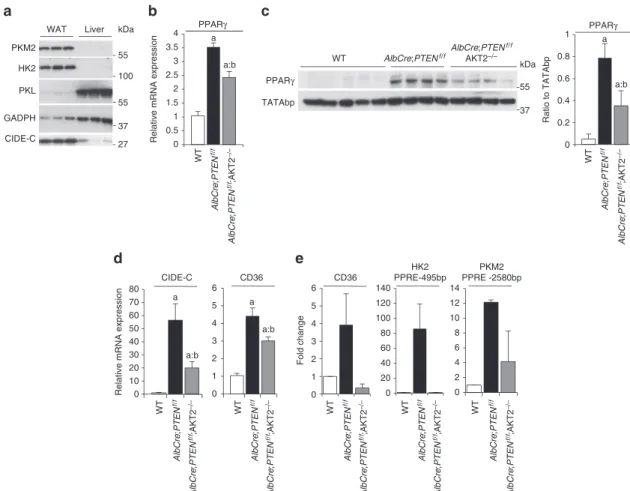
(Supplementary Fig. S4b,c,d). Furthermore, the HIF1α- and c-Myc-target genes GAPDH, PGK1, ENO1, were not regulated in an Akt2-dependent manner in livers (Fig. 1). These observations would be consistent with extra mechanisms downstream of Akt2 control-ling PKM2 and HK2 expression. We noticed that fat storing tissues also contained abundant amount of PKM2 and HK2. This was the case for the epididymal adipose tissues in wild-type mice (Fig. 3a), and for steatotic livers in AlbCre;PTENf/f mice (Fig. 1). PPARγ is a
master regulator of adipogenesis and fat storage21. In liver, PPARγ
levels are increased during steatosis induced by high fat diet22,
leptin deficiency23, or the genetic deletion of PTEN14. Importantly,
we found that the increase of PPARγ mRNA and nuclear protein 0 0.5 1 1.5 2 2.5 3 3.5 4 4.5 a a a:b a:b WT WT AlbCr e; PTE N f/ f PKM2 HK2
Relative mRNA expression
0 0.5 1 1.5 2 2.5 Lactate, µmol g –1 a a:b WT AlbCre;PTENf/f PTENAlbCre;f/f;AKT2–/–
VDAC HK2 0 0.2 0.4 0.6 WT AlbCr e; PTE N f/ f HK2 a b Ratio to VDAC a a a a WT GADPH ENO1 GCK PKL a a a a a a GPI1
Relative mRNA expression
0 0.5 1 1.5 2 2.5 3 3.5 4 a a PGK1 P-AKT (Ser473)
WT AlbCre;PTENf/fPTENAlbCre;f/f;AKT2–/–
HK2 Actin PKL ENO PKM2 AKT GAPDH GADPH PKL ENO PKM2 HK2 Ratio to actin 0 0.5 1 1.5 a a a a a a a a a:b b AlbCr e; PTE N f/ f;AKT2 –/ – kDa 70 70 37 55 55 55 100 55 kDa 100 37 AlbCre ;PTE N f/ f;AKT2 –/ – AlbCre ;PTE N f/ f AlbCr e; PTE N f/ f;AKT 2 –/ – WT AlbCr e; PTE N f/ f AlbCr e; PTE N f/ f;AKT 2 –/ – AlbCre ;PTE N f/ f;AKT 2 –/– WT AlbCre ;PTE N f/ f AlbCre ;PTEN f/ f;AKT2 –/ – WT AlbCre ;PTE N f/ f AlbCre ;PTEN f/ f;AKT2 –/ – WT AlbCre ;PTE N f/ f AlbCre ;PTEN f/ f;AKT2 –/ – WT AlbCre ;PTE N f/ f AlbCre ;PTEN f/ f;AKT2 –/ – WT AlbCre ;PTE N f/ f AlbCre ;PTEN f/ f;AKT2 –/ – WT AlbCre ;PTE N f/ f AlbCre ;PTE N f/ f;AKT 2 –/– WT AlbCre ;PTE N f/ f AlbCre ;PTE N f/ f;AKT 2 –/– WT AlbCre ;PTE N f/ f AlbCre ;PTE N f/ f AlbCre ;PTE N f/ f;AKT 2 –/– WT AlbCre ;PTE N f/ f AlbCre ;PTE N f/ f;AKT 2 –/– WT AlbCre ;PTE N f/ f AlbCre ;PTE N f/ f;AKT 2 –/–
Figure 1 | Akt2 controls expression of specific glycolytic isozymes in PTEN-null liver. Relative transcript (a) and protein (b) levels of glycolytic enzymes
in the mouse livers of indicated genotypes. For protein analysis, the ratio to β-actin of the densitometric assay is presented. Data are mean ± s.e.m., n = 3–7 (P < 0.05 (a) versus WT; (b) versus AlbCre;PTENf/f; 2-tailed, unpaired student’s t test). (c) RT–QPCR for PKm2 and HK2 expression from mice livers of
indicated genotypes. Data are mean ± s.e.m., n = 7 (P < 0.05 (a) versus WT; (b) versus AlbCre;PTENf/f; 2-tailed, unpaired student’s t test). (d) Immunoblot
analysis of HK2 in liver mitochondria extracts from mice of indicated genotypes. The ratio to VDAC of the densitometric assay ± s.e.m. is presented,
n = 3–4 (P < 0.05 (a) versus WT; (b) versus AlbCre;PTENf/f; 2-tailed, unpaired student’s t test). (e) Hepatic lactate levels of random-fed mice of indicated
ARTICLE
nATuRE CommunICATIons | DoI: 10.1038/ncomms1667levels in AlbCre;PTENf/f livers was reduced by 35% and 55%,
respectively, in the AlbCre;PTENf/f;Akt2 − / − genotype (Fig. 3b,c),
correlating with the extent of steatosis (Supplementary Fig. S2). The reduction of PPARγ expression in AlbCre;PTENf/f;Akt2 − / −
livers was accompanied by a comparable reduction of FoXo phos-phorylation (Supplementary Fig. S5a). FoXo transcription factor family members were previously shown to be Akt substrates and to regulate PPARγ expression in fat tissues24,25. Interestingly, Akt2
deletion also abrogated expression of hepatic Cyclooxygenase-2 (Supplementary Fig. S5b), a rate-limiting enzyme in prostaglandin synthesis that was previously shown to be upregulated in PTEN-null cells26. Although the nature of PPARγ endogenous ligands is still
under debate, prostaglandins were proposed as natural regulators of PPARγ27. Thus, it is possible that Akt2 activity might affect both
PPARγ expression and activation in liver. Consistently, Akt2 activity contributed to control of the mRNA expression of PPARγ targets, namely cluster of differentiation 36 (CD36) and cell death-inducing
DFFA-like effector-C (CIDE-C) (Fig. 3d). Chromatin immunopre-cipitation from liver extracts using PPARγ antibodies demonstrated that the binding of PPARγ to the promoter of CD36 was dependent on Akt2 activation (Fig. 3e).
PKM2 and HK2 are novel transcriptional targets of PPAR.
By in silico analysis, it appeared that the promoter regions of PKM2 and HK2 genes also contained several PPAR response elements (PPRE). Namely, for HK2, they were localized at positions − 2,694 bps, − 1,216 bp, − 1,162 bp, − 756 bp, − 495 bp and for PKM2 at − 2580 bp, − 2108 bp, − 2086 bp, − 1,927 bp, − 1,028 bp and − 235 bp from the transcription start site. Independent chromatin immunoprecipitation assays demonstrated that, in
PTEN-deficient livers, PPARγ binding to one PPRE in the promoter
of PKM2 (at − 2,580 bp position) and to one PPRE in the promoter of HK2 (at − 495 bp position) was enriched more than tenfold over the IgG control immunoprecipitations (Fig. 3e). Importantly, this
AlbCre;PTENf/f;AKT2–/– GF P HK 2 WT Actin PKM2 V5-Tag (HK2) GFP HK2 PKM2 HK2+PKM2 WT GF P HK2 GF P HK2 Lactate
µg per mg liver tissue
a a 0 5 10 15 20 25 30 35 WT 0 0.02 0.04 0.06 0.08 0.1 0.12 0.14 GF P HK2 GF P HK2 a a Ratio
:BrdU+/total number of nuclei
WT 0 0.02 0.04 0.06 0.08 0.1 0.12 0.14 0.16 0.18 0.2 Ratio
:liver weight (g)/body weight (g)
GF P HK2 PKM 2 HK2+PKM 2 GF P HK2 a a:b a:b:c a:b:c:d a:b AlbCre; PTENf/f; AKT2–/– AlbCre; PTENf/f; AKT2–/– AlbCre; PTENf/f; AKT2–/– WT kDa 55 100 55
Figure 2 | HK2 and PKM2 glycolytic isozyme expression promotes liver growth. (a) Immunoblot analysis of PKm2 and HK2 protein expression in livers
of mice, 7 days after transduction with indicated adenoviruses. (b) Liver weight relative to body weight of mice transduced with indicated adenoviruses. Data are means ± s.e.m., n = 3–8 (P < 0.05 (a) versus GFP/WT; (b) versus adenoHK2/WT; (c) versus adenoPKm2/WT; (d) versus GFP/AlbCre;PTENf/f;
Akt2 − / − ; 2-tailed, unpaired student’s t test). (c) Hepatic lactate levels of random-fed mice of indicated genotypes 7 days after transduction with
HK2 adenovirus. Data are means ± s.e.m., n = 3 (P < 0.05 (a) versus GFP; 2-tailed, unpaired student’s t test). (d) H&E-stained sections of WT and
AlbCre;PTENf/f;Akt2 − / − livers transduced with GFP or HK2 adenoviruses. Bar represents 100 µm. (e) Increased proliferation rate of hepatocytes induced
by HK2 overexpression in the livers of mice of indicated genotypes. Brdu + nuclei and total number of nuclei were scored in the livers of adenovirus-transduced mice 1 day after administration of Brdu in drinking water. Data presented as a ratio of Brdu + to total number of nuclei ± s.e.m., n = 3–8 (P < 0.05 (a) versus GFP; 2-tailed, unpaired student’s t test).
binding required Akt2 activity as it was reduced in AlbCre;PTENf/f;
Akt2 − / − livers. Taken together, these findings indicate that PKM2
and HK2 are novel and direct targets of PPARγ, consistent with their expression in adipose tissue and fatty liver.
Pioglitazone treatment induces growth of PTEN-null liver. Our
data suggest that PPARγ may promote metabolic adaptations down-stream of PI3K and Akt2 pathway favouring hepatocyte steatosis and proliferation. However, PPARγ in other systems may also pro-mote cell differentiation and cell-cycle withdrawal28. Intriguingly,
PTEN expression has been proposed as one of the possible mecha-nisms by which PPARγ may exert anti-tumoral actions29. Therefore,
the functional outcome of PPARγ activity on PTEN-negative liver growth is difficult to predict and is important to assess, given the potential for pharmacological intervention with PPARγ synthetic ligands to treat metabolic diseases30. To this end, PPARγ activity
was modulated in PTEN-null livers. AlbCre;PTENf/f and wild-type
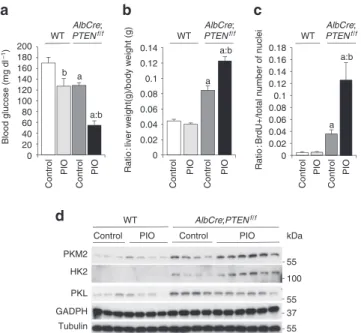
mice were daily treated for 12 days with the PPARγ agonist pioglita-zone. This reduced fed glycaemia in both genotypes (Fig. 4a), con-sistent with the insulin-sensitizing systemic effect of pioglitazone. However, pioglitazone promoted a 62% increase in liver/body ratio (Fig. 4b), and a threefold increase in BrdU-positive cells (Fig. 4c), exclusively in PTEN-null livers, whereas growth was not induced in wild-type liver controls in agreement with the low PPARγ expression
in this genotype. Strikingly, pioglitazone selectively raised the levels of PKM2 and HK2 proteins in AlbCre;PTENf/f livers with no effect
on PKL and GAPDH levels (Fig. 4d).
PPAR overexpression in vivo induces liver growth. To analyse
the effects of cell-autonomous activation of PPARγ on liver growth, wild-type, AlbCre;PTENf/f and AlbCre;PTENf/f;Akt2 − / − mice were
in vivo transduced with PPARγ-expressing adenoviral vector that
has a pronounced tropism for liver. In line with the results of PPARγ activation by pharmacological agents, PPARγ overexpression led to a significant increase in liver/whole body ratio in wild type,
AlbCre;PTENf/f and AlbCre;PTENf/f;Akt2 − / − livers as compared
with control transduced livers (Supplementary Fig. S6a). The effect on liver hypertrophy and steatosis was particularly striking in wild type and AlbCre;PTENf/f;Akt2 − / − tissues, that express low levels
of endogenous PPARγ (Fig. 5a). Induction of PKM2 and HK2 by PPARγ expression was comparable to well-established PPARγ target such as CD36 (Fig. 5b). The massive and selective upregulation of PKM2 and HK2 over other glycolytic enzymes was confirmed at the level of both mRNA and protein (Fig. 5b,c). PKM1 and PKM2 isoforms are transcribed from the same PKM locus and arise from alternative splicing of PKM pre-mRNA leading to inclusion of either exon 9 in the PKM1 mature mRNA, or exon 10 in PKM2 (ref. 31). Despite their similarities, the effects on aerobic glycolysis and cancer TATAbp WT AlbCre;PTENf/f AlbCre;PTEN f/f AKT2–/– PPARγ PKM2 HK2 GADPH PKL WAT Liver CIDE-C 0 0.2 0.4 0.6 0.8 1 WT AlbCre ;PTE N f/ f PPARγ Ratio to TATAbp a a:b PPARγ a:b a 0 0.5 1 1.5 2 2.5 3 3.5 4
Relative mRNA expression
0 20 40 60 80 100 120 140 0 1 2 3 4 5 6 0 2 4 6 8 10 12 14 CD36 PPRE-495bpHK2 PPRE -2580bpPKM2 Fold change kDa 55 100 55 37 27 kDa 55 37 a a:b 0 10 20 30 40 50 60 70 80 0 1 2 3 4 5 6 a a:b CIDE-C CD36
Relative mRNA expression
AlbCr e; PTE N f/ f;AKT2 –/ – WT AlbCre ;PTE N f/ f AlbCr e; PTE N f/ f;AKT2 –/ – WT AlbCre ;PTE N f/ f AlbCr e; PTE N f/ f;AKT2 –/ – WT AlbCre ;PTE N f/ f AlbCr e; PTE N f/ f;AKT2 –/ – WT AlbCre ;PTE N f/ f AlbCr e; PTE N f/ f;AKT2 –/ – WT AlbCre ;PTE N f/ f AlbCr e; PTE N f/ f;AKT2 –/ – WT AlbCre ;PTE N f/ f AlbCr e; PTE N f/ f;AKT2 –/ –
Figure 3 | PPARγ controls HK2 and PKM2 expression in PTEN-null liver. (a) Immunoblot analysis of protein expression in liver and WAT tissue of WT
mice. (b) RT–QPCR analysis of relative transcript levels of PPARγ in the mouse livers of indicated genotypes. Data are mean ± s.e.m., n = 5 (P < 0.05 (a) versus WT; (b) versus AlbCre;PTENf/f, 2-tailed, unpaired student’s t test). (c) Immunoblot analysis showing levels of PPARγ in liver nuclear extracts.
The ratio to TATA-binding nuclear protein of the densitometric assay ± s.e.m. is presented, n = 4–5 (P < 0.05 (a) versus WT; (b) versus AlbCre;PTENf/f,
2-tailed, unpaired student’s t test). (d) Relative transcript levels of CD36 and CIDE-C in the mouse livers of indicated genotypes. Data are mean ± s.e.m.,
n = 7 (P < 0.05 (a) versus WT; (b) versus AlbCre;PTENf/f; 2-tailed, unpaired student’s t test). (e) Endogenous PPARγ chromatin immunoprecipitation
assessed for CD36, PKm2 and HK2 murine promoters relative to immunoprecipitation with nonspecific IgG. Data are presented as an average of fold induction over WT control mice of two independent experiments, n = 4.
ARTICLE
nATuRE CommunICATIons | DoI: 10.1038/ncomms1667progression are mainly ascribed to PKM2 rather than PKM1 (ref. 7). In PPARγ-transduced livers, the transcription of PKM gene was upregulated, leading to increased levels of both PKM1 and PKM2 mRNAs (Fig. 5b). Although the formation of both PKM splice vari-ants was detected, PKM2 mRNA was more abundant than PKM1 (Supplementary Fig. S6b). Taken together, our findings indicate that PPARγ acts in vivo on PKM and HK2 gene transcription, and that hepatocytes are competent for PKM2 production. To address whether glycolysis may concur to the growth-promoting action of PPARγ in liver, PPARγ-transduced wild-type mice were treated with the glycolytic inhibitor 3-bromopyruvate (3-BrPA)32. 3-BrPA
inhib-ited PPARγ-induced liver growth because of effects on hepatocyte proliferation and steatosis (Fig. 5d,e,f).
The liver-cell type expressing PKM2 after PPARγ expression was determined by immunostaining as the hepatocytes (Fig. 5g), rul-ing out the contribution of other cell types to the observed effects on PKM2 expression. It was also independently confirmed by modulating PPARγ levels in primary hepatocyte cultures by adeno-viral transduction, where increasing doses of PPARγ upregulated HK2 and PKM2 mRNA and protein levels (Fig. 5h and i). PPARγ overexpression had similar effects on the well-established targets CD36 and aP2, whereas the levels of other glycolytic enzymes such as GAPDH and PGK1 remained constant. Conversely, overexpres-sion of PPARα was not able to stimulate HK2 and PKM2 mRNA levels in primary hepatocytes (Supplementary Fig. S7a). Moreover, PPARα and PPARβ expression was not regulated by Akt2 in livers (Supplementary Fig. S7b). Altogether, our data suggest a cell-autonomous regulation of HK2 and PKM2 specifically by the γ type of PPARs.
Strikingly, the AlbCre;PTENf/f;Akt2 − / − livers showed
pathologi-cal signs 2 weeks after adeno-PPARγ transduction, including bile duct hyperplasia, hepatic lobule disorganization, and ballooning hepatocytes (Fig. 5g). Thus, PPARγ orchestrates a gene-expression program downstream the PI3K/Akt2 pathway, favouring aerobic glycolysis, lipogenesis and pathophysiological growth.
Discussion
Although the role of c-Myc and HIF-1α in general regulation of glycolytic enzyme expression is well documented, our understanding of molecular mechanisms selectively controlling specific glycolytic enzymes is limited. Regulation of HK2 and PKM2 isozymes is espe-cially interesting, owing to their function in aerobic glycolysis and growth. Here we provide evidence that PPARγ has an important role in HK2 and PKM2 glycolytic isozyme gene trascription in PTEN-null fatty liver. We propose that these novel targets, in addition to other well-established target genes, concur to the growth and meta-bolic adaptation of liver to nutrition, insulin, PI3K, Akt2 and PPARγ signalling: aerobic glycolysis, steatosis and hepatomegaly (Fig. 5j).
Intense efforts have been made to evaluate whether therapy with insulin-sensitizing agents, and PPARγ agonists could be ben-eficial against steatosis-associated human liver diseases, though the outcome is not conclusive yet30. The rationale behind these clinical
trials is that PPARγ agonists should alleviate liver steatosis, promot-ing lipid accumulation in adipose tissue and suppresspromot-ing hepatic inflammation. This strategy may be appropriate when the origin of liver steatosis is environmental, owing to nutritional habits. However, liver steatosis and hepatic PPARγ expression may arise from genetic insults, as observed when PTEN is deleted and Akt2 upregulated in hepatocytes. In these cases, we show that PPARγ activation is detri-mental, leading to massive steatosis and hepatocyte proliferation.
Regulation of HK2 and PKM2 by hepatic PPARγ is observed well before tumour onset, which in PTEN-deficient livers appears since 7 months of age. It is tempting to speculate that these effects may be causally involved in the well-established correlation between liver steatosis and increased cancer risk. Whereas PPARγ may act as a tumour suppressor in colon, breast and prostate cancers33,34, PPARγ
activation promotes polyp formation in colon cells carrying muta-tions in the APC gene35–37. Interestingly, in liver, histone
deacety-lase 3 (Hdac3) and nuclear hormone co-repressor (N-CoR) are recruited by several nuclear hormone receptors, including PPARγ, to regulate transcription in the absence of the ligand. Loss-of- function mutations in these transcriptional repressors promote steatosis and pathological liver growth culminating in cancer in mice and humans38,39. These studies in combination with our data
suggest a functional PPARγ/Hdac3/N-CoR complex in the regula-tion of liver metabolism, which may have important implicaregula-tions in tumorigenesis.
Methods
Animal experiments. Generation of AlbCre;PTENf/f and Akt2 − / − mice has been
previously described14,16. Mice were maintained at 22 °C with a
12-h-dark/12-h-light cycle and had free access to food. All animal studies were approved by the Direction Départementale des Services Vétérinaires, Préfecture de Police, Paris, France (authorization number 75-1313). Pioglitazone was diluted in 0.5%
carboxymethyl cellulose and was administered at 30 mg kg − 1 dose by daily gavage
for 12 days. Group of wild-type mice transduced with PPARγ adenovirus were
treated with 4 mg kg − 1 3-BrPA (Sigma) freshly prepared in PBS and adjusted to
pH7.4. The drug was injected intraperitoneally every day for 7 days. The first injection was 12 h after transduction with adenovirus.
Adenoviruses. Recombinant adenovirus expressing untagged full-length human PPARγ2 was a generous gift from Renaud Dentin (Institut Cochin, INSERM U1016, UMR8104). Recombinant adenovirus expressing c-Myc was a generous gift from Heiko Hermeking (Institute of Pathology Ludwig-Maximilians-University
Munich)40. Recombinant adenovirus expressing HIF-1αCA5 mutant was a
generous gift from Gregg L. Semenza (The Johns Hopkins University School of
Medicine)41. Recombinant adenovirus expressing untagged full-length mouse
PPARα was described previously42. Recombinant adenovirus expressing V5-tagged
PKL GADPH Tubulin HK2 PKM2
Control PIO Control PIO WT 0 0.02 0.04 0.06 0.08 0.1 0.12 0.14 Rati o
:liver weight(g)/body weight (g)
Control PIO Control PIO WT a a:b WT 0 0.02 0.04 0.06 0.08 0.1 0.12 0.14 0.16 0.18 Rati o
:BrdU+/total number of nuclei
Control PIO Control PIO a a:b 0 20 40 60 80 100 120 140 160 180 200 Control PIO Control PIO WT a:b b a Blood glucose (mg dl –1) kDa 55 100 55 37 55 AlbCre;
PTENf/f AlbCre;PTENf/f AlbCre;PTENf/f
AlbCre;PTENf/f
Figure 4 | Pharmacological activation of PPARγ by Pioglitazone promotes
growth of PTEN-null liver. (a) Blood glucose level of random-fed mice of
the indicated genotypes. Data are means ± s.e.m., n = 8 (P < 0.05 (a) versus WT; (b) versus control; 2-tailed, unpaired student’s t test). (b) Liver- to body-weight ratio of WT and AlbCre;PTENf/f mice after PIo treatment.
Data are means ± s.e.m., n = 5–8 (P < 0.05 (a) versus WT; (b) versus control; 2-tailed, unpaired student’s t test). (c) Increased proliferation rate of hepatocytes after PIo treatment. number of Brdu + nuclei and total number of hepatocytes nuclei were scored in the liver of untreated and PIo-treated mice, 5 days after administration of Brdu in drinking water. Data presented as a ratio of Brdu + to total number of nuclei ± s.e.m.,
n = 4–8 (P < 0.05 (a) versus WT; (b) versus control, 2-tailed, unpaired
student’s t test). (d) Immunoblot analysis of liver extracts of WT and
full-length human HK2 was custom-generated at GeneCust. Recombinant adenovirus expressing untagged human PKM2 was acquired from Excellgen. Viruses were generated through homologous recombination between a linearized transfer vector pAD-Track and the adenoviral backbone vector pAD-Easy. Viruses were purified by the CsCl method and dialysed against PBS buffer containing 7%
glycerol. For in vivo transduction, 109 of adenoviral infectious particles were
diluted in 0.9%NaCl and administered retro-orbitally, using 26G needle in total volume of 100 µl per mouse, and mice were killed 7 or 14 days postinfection. Adenovirus coding for GFP was used as a control in all experiments.
Metabolic studies in mice. At 3 months of age, a glucose tolerance test was performed in mice after an overnight fasting (14 h). Mice were intraperitoneally
injected with 2 g kg − 1 glucose, and blood was collected from the tail vein for
determination of glucose levels at 0, 15, 30, 45 and 100 min by Glucotrend gluco-meter (Roche Diagnostics). Insulin tolerance test was performed at 3 months of
age. Overnight-fasted mice were intraperitoneally injected with 1 U kg − 1 insulin
(Actrapid), and the glucose concentration in whole blood from the tail vein was measured at 0, 15, 30 and 60 min. Fasting insulin levels were measured by ELISA assay (Crystal chem).
Immunohistochemistry and morphometric analysis. Liver tissue was fixed over-night in phosphate-buffered 10% formalin and embedded in paraffin, sectioned in 4 µm, and stained with eosin/hematoxylin. Immunohistochemistry was performed using anti-BrdU antibody (Roche), anti-β-catenin (Calbiochem) and anti-PKM2xp (Cell Signalling Technology) antibodies. For 5-bromo-2′deoxyuridine (BrdU)
incorporation, mice were fed with BrdU (3 mg ml − 1, Sigma-Aldrich) dissolved
in drinking water for either for 5 days (PIO treatment) or last 24 h (adenoviral transduction) before killed. The results were expressed as the ratio of BrdU-positive
nuclei and total number of nuclei in at least 10 areas of 33,500 µm2 for anti-BrdU
staining analysed. WT/GFP DKO/PPARγ DKO/GFP WT/PPARγ 0 5 10 15 20 CD36 HK2 PKM2 PKL PKM1 GCK 30 40
Relative mRNA expression
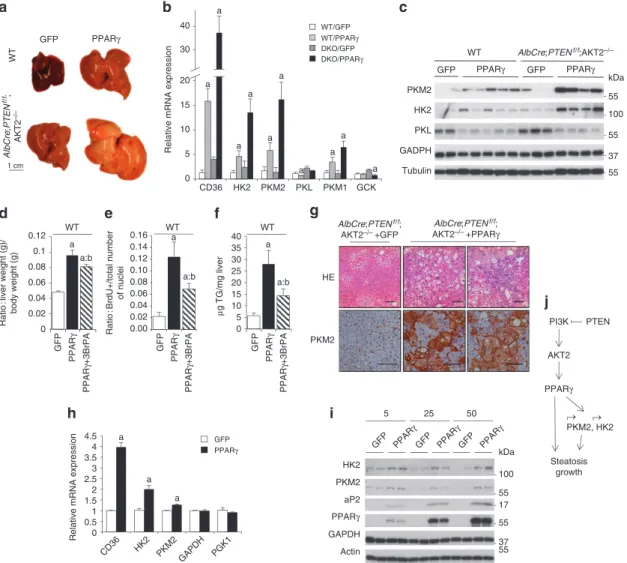
a a a a a a a a a a GFP PPARγ WT AlbCr e; PTE N f/ f; AKT2 –/– 1 cm PKL PKM2 GADPH Tubulin HK2 GFP PPARγ GFP PPARγ WT AlbCre;PTENf/f;AKT2–/– kDa 55 100 55 37 55 0.00 0.02 0.04 0.06 0.08 0.10 0.12 0.14 0.16 WT Rati o :BrdU+/total number of nuclei a a:b PI3K PTEN AKT2 PPARγ Steatosis growth PKM2, HK2 a a:b 0 5 10 15 20 25 30 35 40 WT µg TG/mg liver 0 0.02 0.04 0.06 0.08 0.1 0.12 Rati o :l iver weight (g)/ body weight (g) a a:b PPAR γ GFP PPAR γ+3BrPA PPAR γ GFP PPAR γ+3BrPA PPAR γ GFP PPAR γ+3BrPA WT a a a GFP PPARγ 0 0.5 1 1.52 2.5 3 3.54 4.5 CD36 HK2 PKM2 GFP PPAR γ GFP PPAR γ GFP PPAR γ Actin HK2 PKM2 PPARγ aP2 GAPDH 5 25 50 kDa 100 55 17 55 37 55 PKM2 AlbCre;PTENf/f; AKT2–/– +GFP AlbCre;PTENf/f; AKT2–/– +PPARγ HE
Relative mRNA expression
GAPDH PGK1
Figure 5 | Rescue of PPAR expression in liver causes hypertrophy. (a) macroscopic view of WT and AlbCre;PTENf/f;Akt2 − / − mice 7 days after
adenoviral transduction of GFP or PPARγ. (b) Relative transcript levels and (c) immunoblot analysis of protein levels in livers of mice transduced with GFP or PPARγ adenoviruses for 7 days. Data are means ± s.e.m., n = 3–5 (P < 0.05 (a) versus GFP; 2-tailed, unpaired student’s t test). (d) Liver to body weight ratio of WT mice transduced with adenoviruses expressing GFP or PPARγ and treated with 3BrPA. Data are means ± s.e.m., n = 5–11 (P < 0.05 (a) versus WT; (b) versus PPARγ control; 2-tailed, unpaired student’s t test). (e) Hepatocyte proliferation after PPARγ overexpression is inhibited by 3BrPA treatment. number of Brdu + nuclei and total number of hepatocyte nuclei were scored in the livers of mice transduced with indicated adenoviruses treated for 1 day before sacrifice with Brdu in drinking water. Data are presented as a ratio of Brdu + to total number of nuclei ± s.e.m.,
n = 3–7 (P < 0.05 (a) versus GFP; (b) versus PPARγ control; 2-tailed, unpaired student’s t test). (f) Triglyceride concentration in liver tissue of mice transduced with GFP or PPARγ adenoviruses, and treated with 3BrPA. Data are means ± s.e.m., n = 5–11 (P < 0.05 (a) versus GFP; (b) versus PPARγ control; 2-tailed, unpaired student’s t test). (g) H&E staining and immunohistochemistry using anti-PKm2 antibody of liver sections of AlbCre;PTENf/f;Akt2 − / −
mice 14 days after adenoviral transduction with GFP or PPARγ. Bar represents 100 µm. (h) RT–QPCR analysis of relative transcript levels of glycolytic enzymes in primary WT hepatocytes 40 h postinfection with 5 moI of adenoviruses expressing GFP or PPARγ. Data are means ± s.e.m., n = 3 (P < 0.05 (a) versus GFP; 2-tailed, unpaired student’s t test). (i) Immunoblot analysis of protein levels of glycolytic enzymes in primary hepatocytes transduced with different doses of PPARγ or GFP adenovirus collected 40 h postinfection. (j) Proposed model of PPARγ contribution to metabolic changes and pathophysiological growth in PTEN-null livers.
ARTICLE
nATuRE CommunICATIons | DoI: 10.1038/ncomms1667Subcellular fractionation and western blot. Mitochondria were isolated as
previ-ously described43. Briefly, 50–100 mg of snap-frozen liver tissue was homogenized
in IBc buffer complemented with complete protease inhibitors (Roche). After centrifugation at 600 g for 10 min, the supernatant containing the mitochondria was centrifugated at 7,000g for 10 min. The pellet of mitochondria was washed three times with IBc buffer and, after the final centrifugation, the mitochondria were lysed in extraction buffer (20 mM Tris–HCl (pH 8,0), 5% glycerol, 138 mM NaCl, 2,7 mM KCl, 1% NP-40, 20 mM NaF, 5 mM EDTA, 1 mM DTT) comple-mented with complete protease inhibitors (Roche). Nuclear extracts were prepared using NE-PER Kit (Pierce), according to manufacturer’s recommendations, using 50–100 mg of snap-frozen liver tissue as a starting material. Total protein extracts
were prepared as described before44. Proteins were resolved by SDS–PAGE,
transferred to polyvinylidene difluoride membrane and incubated with anti-phospho Akt (Ser473), anti-aP2, anti-PKM2, anti-HK2, anti-Akt, anti-c-Myc, anti-Lamin A/C, anti-phosphoFoXo1/3a (Thr24/32), anti-FoXo3a, anti-phosphoGSK3β (Ser9), anti-GSK3β (Cell Signalling), anti-PKL (a generous gift of Benoit Viollet, Cochin Institut, Paris), anti-tubulin and anti-β-actin (Sigma), anti-VDAC and anti-CIDE-C (Millipore), anti-HK2, anti-TATABP, anti-PPARγ and anti-enolase (Santa Cruz), anti-GAPDH and anti-V5 (Abcam), anti-HIF1α (Novus) antibodies.
Hepatic metabolites analysis. TG levels were determined using Triglycerides FS Kit (Diasys) according to the manufacturer’s instructions. 50–100 mg of powdered liver tissue or pelleted primary hepatocytes were used for acetone extraction. Lac-tate concentrations were assayed in liver extracts of random-fed mice as described
previously45. Briefly, metabolites were extracted in 9% perchloric acid from
clamp-frozen liver tissues, neutralized using potassium hydroxide, and assayed using a spectrophotometric enzymatic procedure. Lactate levels after adenovirus-mediated HK2 overexpression were determined using Lactate reagent (Trinity Biotech) using 50–100 mg of liver tissue or cell culture medium supernatants. Liver tissue extracts before measurement were filtered using 10 K Amicon Ultra columns (Millipore).
RT–QPCR. Total RNA was isolated from 50–100 mg of snap-frozen liver tissue using a RNAeasy Lipid Tissue Midi or Mini Kit (Qiagen). Total RNA from hepato-cytes was isolated using a RNAeasy Mini Kit (Qiagen). Single-strand complemen-tary DNA was synthesized from 1 µg of total RNA with random hexamer primers and SuperScript II (Invitrogen). Real-time quantitative PCR (RT–QPCR) was performed on Taqman instrument (Applied Biosystem) using a SYBR Green PCR Master Mix (Applied Biosystem). The relative amounts of the mRNAs studied were
determined by means of the 2 − ∆∆CT method, with pinin, actin or cyclophilin as
reference genes and control-treated samples as the invariant controls. Primers used for analysis are listed in Supplementary Table S1.
For PKM isoform ratio analysis, 1 microlitre of the complementary DNA was amplified using DreamTaq Green PCR Master Mix (Fermentas) in total volume of 50 microlitres. Five microlitres of PCR product was digested by FastDigest EcoNI (Fermentas) and the products analysed on agarose gel. An EcoNI site is present in exon 9 of mouse PKM1, whereas it is absent in exon 10 of PKM2. Primers used for amplification of PKM isoform identification are shown in Supplementary Table S2.
Chromatin immunoprecipitation. Random-fed mice were used for experiment with two mice of the same genotype used for preparation in each sample for each independent experiment. Chromatin was prepared from freshly dissected liver,
as previously described46,47. Chromatin was sonicated in SBAR buffer (50 mM
HEPES, 140 mM NaCl, 1 mM EDTA, 1% Triton, 0.1% sodium deoxycholate and 0.1% SDS with complete protease inhibitors (Roche) and incubated with antibody to PPARγ (Santa Cruz, sc-7196) or IgG as control. Next, immunocomplexes were recovered with Protein A sepharose beads (Amersham). After washing, DNA– protein complexes were eluted and cross-linking was reversed by heating the samples at 65 °C for 16 h. DNA was then purified using Qiagen PCR purification kit. Real-time quantitative PCR (RT–QPCR) was performed using a Taqman in-strument (Applied Biosystem) according to the manufacturer’s instructions, using a SYBR Green PCR Master Mix (Applied Biosystem). The relative amounts of the
immunoprecipitated DNA were determined by means of the 2 − ∆CT method, with
input DNA values for each sample as the control. The enrichment over IgG control of more than tenfold was considered as a cutoff. The results are presented as average of fold induction over wild type (WT) for the PPREs confirmed in inde-pendent experiments. The location of putative PPREs within promoter region of PKM2 and HK2 genes was determined using MatInspector software (Genomatix) and 3 kb fragment of DNA sequence upstream the transcription start. Numer-ous potential PPREs were located upstream first exon of HK2 and PKM2 genes: HK2: − 2,694 bp; − 1,216 bp; − 1,162 bp; − 756 bp; − 495 bp; PKM2: − 2,580 bp; − 2,108 bp; − 2,086 bp; − 1,927 bp; − 1,028 bp; − 235 bp. Confirmed PPREs for PKM2 and HK2 promoters are PKM2: − 2,580 bp; HK2: − 495 bp. The primer pairs flanking putative PPREs used for amplification have been designed using PrimerBlast software and are listed in Supplementary Table S3.
Hepatocyte culture. Primary hepatocytes were isolated from wild-type C57BL/6J
mice by collagenase perfusion method as described previously44. 4×10⁵ cells were
plated in 6-well plates in William’s medium (Invitrogen) supplemented by 20%
FBS, INS (4 µg ml − 1), 10 units ml − 1 penicillin, 10 g ml − 1 streptomycin, and 25 nM
dexamethasone (Sigma). After attachment, cells were transduced with adenoviruses
expressing GFP, PPARα, PPARγ2, c-Myc or HIF-1αCA5 in serum-free William’s medium for 2 h in 5-50 MOI dose as indicated. Subsequently, medium was changed and cells were maintained in serum-free William’s medium complemented with INS and dexametasone.
References
1. Vander Heiden, M. G., Cantley, L. C. & Thompson, C. B. Understanding the Warburg effect: the metabolic requirements of cell proliferation. Science 324, 1029–1033 (2009).
2. Jones, R. G. & Thompson, C. B. Tumor suppressors and cell metabolism: a recipe for cancer growth. Genes Dev. 23, 537–548 (2009).
3. Kim, J. W. et al. Evaluation of myc E-box phylogenetic footprints in glycolytic genes by chromatin immunoprecipitation assays. Mol. Cell Biol. 24, 5923–5936 (2004).
4. Dang, C. V. The interplay between MYC and HIF in the Warburg effect. Ernst.
Schering. Found. Symp. Proc. 4, 35–53 (2007).
5. Mathupala, S. P., Ko, Y. H. & Pedersen, P. L. Hexokinase-2 bound to
mitochondria: cancer′s stygian link to the “Warburg Effect” and a pivotal target for effective therapy. Semin. Cancer Biol. 19, 17–24 (2009).
6. Robey, R. B. & Hay, N. Mitochondrial hexokinases, novel mediators of the antiapoptotic effects of growth factors and Akt. Oncogene 25, 4683–4696 (2006).
7. Christofk, H. R. et al. The M2 splice isoform of pyruvate kinase is important for cancer metabolism and tumour growth. Nature 452, 230–233 (2008). 8. Christofk, H. R., Vander Heiden, M. G., Wu, N., Asara, J. M. & Cantley, L.
C. Pyruvate kinase M2 is a phosphotyrosine-binding protein. Nature 452, 181–186 (2008).
9. Wolf, A. et al. Hexokinase 2 is a key mediator of aerobic glycolysis and promotes tumor growth in human glioblastoma multiforme. J. Exp. Med. 208, 313–326 (2011).
10. Rempel, A., Bannasch, P. & Mayer, D. Differences in expression and intracellular distribution of hexokinase isoenzymes in rat liver cells of different transformation stages. Biochim. Biophys. Acta 1219, 660–668 (1994). 11. Mayer, D., Klimek, F., Rempel, A. & Bannasch, P. Hexokinase expression in
liver preneoplasia and neoplasia. Biochem. Soc. Trans. 25, 122–127 (1997). 12. Hacker, H. J., Steinberg, P. & Bannasch, P. Pyruvate kinase isoenzyme shift from
L-type to M2-type is a late event in hepatocarcinogenesis induced in rats by a choline-deficient/DL-ethionine-supplemented diet. Carcinogenesis 19, 99–107 (1998).
13. Taniguchi, C. M. et al. Divergent regulation of hepatic glucose and lipid metabolism by phosphoinositide 3-kinase via Akt and PKClambda/zeta. Cell
Metab. 3, 343–353 (2006).
14. Horie, Y. et al. Hepatocyte-specific Pten deficiency results in steatohepatitis and hepatocellular carcinomas. J. Clin. Invest. 113, 1774–1783 (2004).
15. Stiles, B. et al. Liver-specific deletion of negative regulator Pten results in fatty liver and insulin hypersensitivity [corrected]. Proc. Natl Acad. Sci. USA 101, 2082–2087 (2004).
16. Cho, H. et al. Insulin resistance and a diabetes mellitus-like syndrome in mice lacking the protein kinase Akt2 (PKB beta). Science 292, 1728–1731 (2001).
17. Leavens, K. F., Easton, R. M., Shulman, G. I., Previs, S. F. & Birnbaum, M. J. Akt2 is required for hepatic lipid accumulation in models of insulin resistance.
Cell Metab. 10, 405–418 (2009).
18. He, L. et al. The critical role of AKT2 in hepatic steatosis induced by PTEN loss.
Am. J. Pathol. 176, 2302–2308 (2010).
19. Galicia, V. A. et al. Expansion of hepatic tumor progenitor cells in Pten-null mice requires liver injury and is reversed by loss of AKT2. Gastroenterology
139, 2170–2182 (2010).
20. Nakashima, R. A., Paggi, M. G., Scott, L. J. & Pedersen, P. L. Purification and characterization of a bindable form of mitochondrial bound hexokinase from the highly glycolytic AS-30D rat hepatoma cell line. Cancer Res. 48, 913–919 (1988).
21. Tontonoz, P. & Spiegelman, B. M. Fat and beyond: the diverse biology of PPARgamma. Annu. Rev. Biochem. 77, 289–312 (2008).
22. Vidal-Puig, A. et al. Regulation of PPAR gamma gene expression by nutrition and obesity in rodents. J. Clin. Invest. 97, 2553–2561 (1996).
23. Matsusue, K. et al. Liver-specific disruption of PPARgamma in leptin-deficient mice improves fatty liver but aggravates diabetic phenotypes. J. Clin. Invest.
111, 737–747 (2003).
24. Kim, J. J. et al. FoxO1 haploinsufficiency protects against high-fat diet-induced insulin resistance with enhanced peroxisome proliferator-activated receptor gamma activation in adipose tissue. Diabetes 58, 1275–1282 (2009). 25. Armoni, M. et al. FOXO1 represses peroxisome proliferator-activated
receptor-gamma1 and -gamma2 gene promoters in primary adipocytes. A novel paradigm to increase insulin sensitivity. J. Biol. Chem. 281, 19881–19891 (2006).
26. St Germain, M. E., Gagnon, V., Mathieu, I., Parent, S. & Asselin, E. Akt regulates COX-2 mRNA and protein expression in mutated-PTEN human endometrial cancer cells. Int. J. Oncol. 24, 1311–1324 (2004).
27. Forman, B. M. et al. 15-Deoxy-delta 12, 14-prostaglandin J2 is a ligand for the adipocyte determination factor PPAR gamma. Cell 83, 803–812 (1995).
28. Altiok, S., Xu, M. & Spiegelman, B. M. PPARgamma induces cell cycle withdrawal: inhibition of E2F/DP DNA-binding activity via down-regulation of PP2A. Genes Dev. 11, 1987–1998 (1997).
29. Teresi, R. E. et al. Increased PTEN expression due to transcriptional activation of PPARgamma by Lovastatin and Rosiglitazone. Int. J. Cancer 118, 2390–2398 (2006).
30. Sanyal, A. J. et al. Pioglitazone, vitamin E, or placebo for nonalcoholic steatohepatitis. N. Engl. J. Med. 362, 1675–1685 (2010).
31. David, C. J., Chen, M., Assanah, M., Canoll, P. & Manley, J. L. HnRNP proteins controlled by c-Myc deregulate pyruvate kinase mRNA splicing in cancer.
Nature 463, 364–368 (2009).
32. Geschwind, J. F., Ko, Y. H., Torbenson, M. S., Magee, C. & Pedersen, P. L. Novel therapy for liver cancer: direct intraarterial injection of a potent inhibitor of ATP production. Cancer Res. 62, 3909–3913 (2002).
33. Sarraf, P. et al. Loss-of-function mutations in PPAR gamma associated with human colon cancer. Mol. Cell 3, 799–804 (1999).
34. Grommes, C., Landreth, G. E., Schlegel, U. & Heneka, M. T. The nonthiazolidinedione tyrosine-based peroxisome proliferator-activated receptor gamma ligand GW7845 induces apoptosis and limits migration and invasion of rat and human glioma cells. J. Pharmacol. Exp. Ther. 313, 806–813 (2005).
35. Lefebvre, A. M. et al. Activation of the peroxisome proliferator-activated receptor gamma promotes the development of colon tumors in C57BL/6J-APCMin/+ mice. Nat. Med. 4, 1053–1057 (1998).
36. Saez, E. et al. Activators of the nuclear receptor PPARgamma enhance colon polyp formation. Nat. Med. 4, 1058–1061 (1998).
37. Girnun, G. D. et al. APC-dependent suppression of colon carcinogenesis by PPARgamma. Proc. Natl Acad. Sci. USA 99, 13771–13776 (2002). 38. Knutson, S. K. et al. Liver-specific deletion of histone deacetylase 3 disrupts
metabolic transcriptional networks. EMBO J. 27, 1017–1028 (2008). 39. Bhaskara, S. et al. Hdac3 is essential for the maintenance of chromatin
structure and genome stability. Cancer Cell 18, 436–447 (2010).
40. Hermeking, H. et al. Identification of CDK4 as a target of c-MYC. Proc. Natl
Acad. Sci. USA 97, 2229–2234 (2000).
41. Kelly, B. D. Cell type-specific regulation of angiogenic growth factor gene expression and induction of angiogenesis in nonischemic tissue by a constitutively active form of hypoxia-inducible factor 1. Circ. Res. 93, 1074–1081 (2003).
42. Knauf, C. et al. Peroxisome proliferator-activated receptor-alpha-null mice have increased white adipose tissue glucose utilization, GLUT4, and fat mass: role in liver and brain. Endocrinology 147, 4067–4078 (2006).
43. Frezza, C., Cipolat, S. & Scorrano, L. Organelle isolation: functional
mitochondria from mouse liver, muscle and cultured fibroblasts. Nat. Protoc. 2, 287–295 (2007).
44. Espeillac, C. et al. S6 kinase 1 is required for rapamycin-sensitive liver proliferation after mouse hepatectomy. J. Clin. Invest. 121, 2821–2832 (2011).
45. Ferre, P. & Williamson, D. H. Evidence for the participation of aspartate aminotransferase in hepatic glucose synthesis in the suckling newborn rat.
Biochem. J. 176, 335–338 (1978).
46. Verdeguer, F. et al. A mitotic transcriptional switch in polycystic kidney disease. Nat. Med. 16, 106–110 (2010).
47. Annicotte, J. S. et al. The CDK4-pRB-E2F1 pathway controls insulin secretion.
Nat. Cell Biol. 11, 1017–1023 (2009).
Acknowledgements
We are grateful to the members of INSERM-U845 for support, and to David Sabatini, Stefano Fumagalli, Benoit Viollet, Fabienne Foufelle, Renaud Dentin, Pascal Pineau, Isabelle André-Schmutz, Olivier Danos and Anne Dejean for helpful discussions and sharing reagents. We thank Sophie Berissi, Dominique Chretien and Sylvie Fabrega for technical support. This work was supported by grants from the European Research Council, from Fondation de la Recherche Medicale (DEQ20061107956) and from Fondation Schlumberger pour l’Education et la Recherche to M.P., and from the Association pour la Recherche sur le Cancer to M.P. and J.-E.R. L.A.P received a fellowship from the Région Provence-Alpes-Cote-d’Azur and INSERM, C.E. from Ministere de Recherche et Technologies and from Fondation de la Recherche Medicale.
Author contributions
G.P. designed, performed most of the experimental work and analysed data with contribution of C.E. and C.C. M.J.B., Y.H. and A.S. provided expertise and the mouse lines. M.F. provided adenoviral vectors. J.-S.A., L.F., F.V., M.Po. shared reagents and expertise, helped with in vivo ChIP experiments. L.A.P., J.-E.R., P.F. performed the lactate metabolite measurements and enzymatic assays. J.-Y.S. performed pathophysiological analysis. M.Pe. conceived, directed the study and wrote the manuscript. All authors discussed the results and commented on the manuscript.
Additional information
Supplementary Information accompanies this paper at http://www.nature.com/
naturecommunications
Competing financial interests: The authors declare no competing financial interests. Reprints and permission information is available online at http://npg.nature.com/
reprintsandpermissions/
How to cite this article: Panasyuk, G. et al. PPARγ contributes to PKM2 and HK2
expression in fatty liver. Nat. Commun. 3:672 doi: 10.1038/ncomms1667 (2012).
License: This work is licensed under a Creative Commons
Attribution-NonCommercial-NoDerivative Works 3.0 Unported License. To view a copy of this license, visit http:// creativecommons.org/licenses/by-nc-nd/3.0/