HAL Id: hal-01282258
https://hal.archives-ouvertes.fr/hal-01282258
Submitted on 3 Mar 2016HAL is a multi-disciplinary open access archive for the deposit and dissemination of sci-entific research documents, whether they are pub-lished or not. The documents may come from teaching and research institutions in France or abroad, or from public or private research centers.
L’archive ouverte pluridisciplinaire HAL, est destinée au dépôt et à la diffusion de documents scientifiques de niveau recherche, publiés ou non, émanant des établissements d’enseignement et de recherche français ou étrangers, des laboratoires publics ou privés.
Dual Energy Radioscopy Applied to Waste Sorting
Florian Montagner, Valérie Kaftandjian, Philippe Duvauchelle, Nathalie
Pedoussaut, Antoine Bourely
To cite this version:
Florian Montagner, Valérie Kaftandjian, Philippe Duvauchelle, Nathalie Pedoussaut, Antoine Bourely. Dual Energy Radioscopy Applied to Waste Sorting. European Conference on Non Destructive Testing, Oct 2014, Prague, Czech Republic. �hal-01282258�
Dual Energy Radioscopy Applied to Waste Sorting
Florian MONTAGNER1, Valérie KAFTANDJIAN1, Philippe DUVAUCHELLE1, Nathalie PEDOUSSAUT2, Antoine BOURELY2
1
INSA-Lyon, Vibrations and Acoustics laboratory (LVA), University of Lyon, 25bis avenue Capelle, 69621 Villeurbanne Cedex, France, valerie.kaftandjian@insa-lyon.fr
2
PELLENC ST, BP 124 ZAC St Martin, 84120 Pertuis
1. Introduction
Dual energy X-ray transmission technique is routinely used in luggage inspection [1], as well as in the medical field, firstly introduced by Jacobson in 1953 [2]. Alvarez and Macovski developed the concept for tomodensitometry in 1976 [3-4]. In their work, the attenuation coefficient, µ, is mathematically written as a function of interaction type (Compton and photoelectric effect in the typical medical energy domain < 200 keV), and the attenuation at both energies thus allows to retrieve an information related to density and atomic number. Another kind of decomposition consists in writing the µ coefficient as a linear combination of two known materials µ coefficients with their equivalent thicknesses [5]. Obtaining the µ coefficient requires a tomographic device. In the case of radioscopic inspection, the information measured is the attenuation coefficient multiplied by the crossed thickness d, i.e. µd. As such, dual energy radioscopy allows computing the equivalent thicknesses of two known materials from their two attenuation factors (µd). The theoretical problem can be treated in a monochromatic or polychromatic way, as detailed in [6]. In the industrial field of waste sorting, especially for recycling and re-use of certain waste materials, several scenarios can be investigated : detection of copper in various metallic pieces, batteries in compost, etc…Dual energy radioscopy using a basis of known materials is attractive for such applications. However, a preliminary theoretical step is necessary for feasibility and performance assessment of different sorting scenarios. A simulation tool is of great interest as the materials nature is perfectly known, and all acquisitions parameters can be optimized, which would be a tedious experimental task. In our study, we have used the “Virtual X-ray Imaging” simulation software (VXI) developed at INSA-Lyon (LVA laboratory) in order to optimize the detector geometry, but also to assess performances of the method.
2. Simulation of dual energy radioscopy inspection in industrial conditions
The VXI software is a deterministic simulation code developed by INSA-Lyon [7-8]. The principle is based on a ray tracing approach and Beer-Lambert law. Simulation of first order X-ray scattering is also included in the code [9-10].For dual energy radioscopy, two different acquisition strategies can be adopted: either the energy separation is done at the tube level with two separate high voltages, or the separation is done at the detector level, using the same X-ray tube spectrum. Due to our industrial constraints (high acquisition speed and final cost of the machine), the separation at the detector level is preferred. As far as the detector type is concerned, two types also can be considered. Scintillator-based integration detectors with two detection lines are the most industrially used. The two lines are most often in a sandwich configuration, but another solution with parallel lines is also commercially available. The second type of detector is a spectrometry one with a semi-conductor detecting material such as CdTe. Such detectors are also commercially available, although their use in industrial environment is still not wide-spread.
Figure 1 shows an example of simulation of two typical spectra obtained at 140 kV with a sandwich-type detector (left), and a spectrometric detector (right). For the latter, the detector consists of 140 energy channels of 1 keV each, and a threshold is applied to separate the low and high energy photons. A gap is usually used to perform a better separation. In our simulation, the
detector is considered perfect, i.e., all incident photons are absorbed.
It is worth noting that scintillator-based detectors deliver a so-called “integration” signal, i.e., the measurement is proportional to the total absorbed energy, which is the product of the photons number and their energy. On the opposite, the spectrometric detectors are of counting type, i.e., the measurement is proportional to the sum of photons received in each energy band.
FIGURE 1 – Simulation of spectra obtained at 140 kV. Left : sandwich detector (low energy line: 0.3 mm Gd2O2S scintillator ; high energy line : filter 0.6 mm Cu; scintillator 3 mm CsI.).Right: spectrometric ideal
detector 500 µm CdTe.
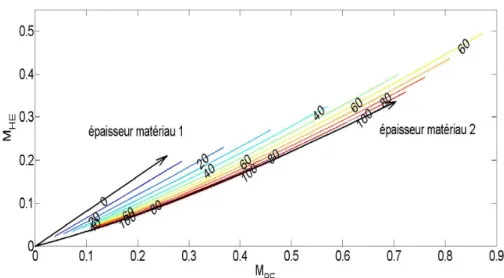
Dual energy radioscopic inspection requires a calibration step using a basis of two known materials. The attenuation factor (µd) is measured at the two energies for a range of known thicknesses of the two materials (fig.2). For each energy, the measurements are fitted by a polynomial. Then, when an unknown material is acquired, the calibration polynomials allow computing the equivalent thicknesses of the two materials of the basis.
NB : What is called “measurement” is indeed the neperian logarithm of the transmitted energy (or respectively the number of photons in case of a spectrometric detector), divided by the incident energy (resp. incident number of photons), in order to retrieve the attenuation factor µd (attenuation coefficient µ * thickness d).
FIGURE 2 – Calibration surfaces: each material thickness (one material alone or the two materials together) corresponds to a couple of measurements at low energy MBE and high energy MHE. Simulation carried out at
140 kV with material 1 : polyethylen (PE) ; material 2 : vinyl polychloride (PVC), sandwich detector (cf description figure 1).
Calibration surfaces can also be plotted as a 2D graph in the (MBE, MHE) plane, such as illustrated in
fig.3. When the two energies are monochromatic, the surfaces and lines are respectively planar and straight, instead of curves like in fig.2 and 3.
FIGURE 3– Calibration surfaces in the (MBE, MHE) plane (polychromatic simulation PE-PVC at 140 kV with sandwich detector). The calibration points of different thicknesses mat1/mat2 are represented in terms of
iso-percentage lines (material 2 %).
A quick interpretation of figure 3 shows that materials discrimination is easier for high thicknesses (because the lines converge at null thickness). On another hand, the more different are the materials in terms of chemical composition, the more different are their respective line in the (MBE, MHE) plane
(as it reflects their attenuation behavior). However, those interpretations are only qualitative and a quantitative image quality criterion is needed.
3. Image quality assessment
At first, for image quality optimization and choice of best operating conditions, different signal to noise ratios (SNR) are computed. First of all, the SNR on the initial measurements is determined, where the measurements are the deposited energies respectively in the high and low energy lines of the detector. Then, the SNR on the equivalent thickness is derived, where the signal refers to the equivalent thickness of material 1 (resp. material 2) obtained after dual energy processing. An analytical relation for the noise relative to each signal (measurements and equivalent thicknesses) is obtained theoretically from the error propagation rule, knowing the theoretical signal equation (function of the energy), as detailed in [11]. Measurement dispersion is simulated thanks to 50000 random runs with Gaussian distribution. In each energy bin, the photon number follows a Poisson distribution, which is modelled by a normal law of mean N and variance N.
Thus, a complete theoretical evaluation is possible thanks to the fact that the deposited energy is perfectly known at each incident energy through the simulation code, which would not be possible to do experimentally.
Figure 4 illustrates the measurement dispersion obtained for 1mm of PVC (material 2). We observe that dispersion is higher in the high energy (HE) beam (standard deviation is 9.10-3 instead of 5.10
-3
for the low energy beam), due to the fact that energy absorption is less important than at low energy. The blue histogram on the left of the graph is the high energy signal which is lower than the low energy one (green line) as it represents the attenuation factor µd.
Once the equivalent thicknesses are computed from the measurements, the uncertainty in the resulting thickness can be assessed which is directly due to the measurement dispersion (figure 5).
FIGURE 4 – Dispersion of measurement points for 1 mm of material 2 (PVC) and 0 mm of material 1 (PE). Left : representation in the calibration map (sandwich detector, 140 kV); right : representation with histograms.
FIGURE 5 – Histograms of equivalent thicknesses of material 1 (blue line) and 2 (red line) computed from the measurements of fig.4. Mean values computed are d1 = 0.07 mm et d2 = 0.96 mm (instead of d1real = 0 mm et
d2real = 1 mm).
The different SNR allow us to optimize acquisition conditions for a given sorting scenario (high voltage influence, detector type, etc…). As an example, fig.6 shows the influence of scintillator thickness in a scenario where chloride materials are to be detected in a neutral plastic flux. The chosen SNR is computed with the material 2 thickness divided by its uncertainty in the considered most difficult case (1 mm PVC alone). An optimal thickness of less than 100 µm is found for the low energy scintillator, because it allows only very low energies to be absorbed, while for the high energy line, the highest the thickness, the best is the SNR because the more energy is absorbed. It is worth noting that the final detector choice is a result of a compromise because the machine should adapt to different scenarios. A detailed study of all acquisition parameters can be found in [11].
4. Performance assessment of a sorting scenario
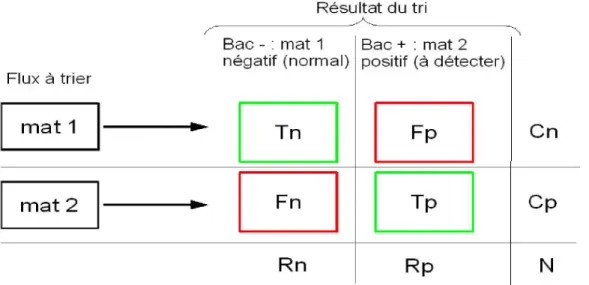
After having illustrated how simulation can serve to optimize acquisition parameters, we show how it can help to assess performances of different scenarios. For this final assessment, we introduce a decision threshold associated to a confidence level, which allows quantifying the performance of various waste sorting scenarios in terms of purity and efficiency. Let’s consider a scenario where material 2 should be detected (thus denoted “positive”), and material 1 should be considered normal (thus denoted “negative”). As defined in [14 -15], efficiency and purity are given by the following relations:
- Efficiency = Tp/Cp - Purity = Tn/Rn Where:
- Tp is the mass of material 2 which has been correctly detected (« true positive »), - Cp is the mass of material 2 present in the initial flux to be sorted,
- Tn is the mass of material 1 which has been correctly detected (« true negative »), - Rn is the total mass of material considered as normal (negative) after sorting.
The different sorting situations are represented in figure 7 as a confusion matrix. The whole set of materials is denoted N. Cn and Cp represent respectively the real quantities of material 1 (normal) and 2 (positive) in the initial flux to sort (this is the reality). Rn and Rp represent the materials as classified by the sorting machine, respectively normal and positive. Thus we have N=Cp+Cn=Rp+Rn. Among the quantities Rn and Rp, a part of materials have been correctly sorted by the machine (respectively Tn and Tp), while another part is a sorting error (respectively Fn, which represents the quantity of material 2 undetected, and Fp which is the normal materials which have been wrongly detected as positive).
Efficiency and purity are good performance metrics for sorting applications, because it allows assessing how the materials can be exploited after sorting: a good sorting machine should not only be efficient but purity is also important because the normal material can be recycled afterwards.
FIGURE 6 – Influence of the scintillator thickness for the low energy line (left) and the high energy line (right) on the obtained SNR (1mm PVC alone, 140 kV, detector with two parallel lines). Default thickness for the
Figure 7 – Confusion matrix where green boxes represent the good classifications, and red boxes the sorting errors
In order to obtain the different terms (Tn, Tp, Fn, Fp), a decision threshold is needed. We define it as a detection threshold in the measurement space (MBE, MHE). This is illustrated in figure 8 where
zone 1 correspond to the normal zone, and zone 2 represent the zone where materials will be classified as positive.
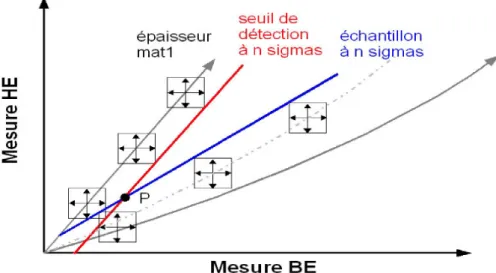
In practice, we choose a detection threshold equal to the line corresponding to the material 1 (i.e. the normal material in our configuration) plus a number “n” times the standard deviation. The role of this “n” value is illustrated in figure 9. Measurement dispersion (σ) is represented as boxes of size ±nσ. An example of measurement line for a given sample is plotted as a dotted line (for this sample, the chemical composition is fixed while the thickness increases, and for each thickness, a couple of measurements MBE, MHE is obtained). In order to assess the performances of sorting at “nσ”, the sample
curve minus σ is plotted (blue line). This line intersects the threshold curve at point P. The sample will be correctly classified as soon as its thickness is above the P point.
The bigger the n, the lower the risk to classify a normal material as positive (Fp type error, which influences the purity value). But on another hand, the risk to miss a positive material increases also (Fn type error, which influences efficiency). Thus the best n value is the result of a compromise.
FIGURE 8 – Detection or decision threshold (blue line) represented in the calibration map. Black arrows represent growing thicknesses of material 1 and 2 alone. Then two examples of normal and positive
material are represented with growing thicknesses (red parts =sorting errors, green parts =correct classifications).
FIGURE 9 – Detection threshold as obtained by the material 1 line plus n times the standard deviation σ. Then, for a given sample, the measurement line (dotted line) minus n times σ (blue line) defines an intersection point
P with the detection threshold. This point P gives the minimal thickness of the sample which will be detected.
Simulation allows to assess the behavior of different materials in the calibration map, allowing thus to define the smallest thickness which can be detected for a given threshold. This limit of thickness is obtained via the P intersection point.
The table 1 shows the limit of detection of different materials using a calibration PE/PVC. This scenario corresponds to the detection of flame retardants (brome, chloric of phosphor based) inside various plastics. Only neutral plastics (without flame retardants) can be recycled. As can be seen from the table values, when the flame retardant is heavy (Br), the detection is easier and the limit is lower. Some flame retardants contain antimony (Sb), which makes their detection easier. Two plastics (<3% Cl and P) remain “undetectable” in the thickness range considered here (<10 mm).
Table 1 : Limits of detection of different plastics with flame retardants (calibration PE/PVC) Material 1 (typical name ) Material 2 (typical name ) mass% of element to detect (nature)
%Sb2O3 minimal detectable thickness at 1σσσσ (mm)
ABS TBBPA 6 (Br) 3,6 à 6 0.3
PS HBCDD 3 (Br) - 0.9
PE Dechlorane plus 13 (Cl) 10 0.2
ABS Dechlorane plus 11 (Cl) 6 0.4
PE PVC 57 (Cl) - 0.3 ABS TCPP 3.3 (Cl) - undetectable PE APP 3.2 (P) - undetectable PA APP 3.2 (P) - 5.5 PE ATH 3.5 (Al) - 2.1 PE MDH 3.5 (Mg) - 2.3
4. Experimental validation in industrial conditions
4.1 Prototype trials
Based on the simulation study, a prototype was built by BERTIN company, using a sandwich detector. Although it was not the best detector from the simulation study, it was selected as the best compromise between cost, performance and commercial availability.
FIGURE 10: Dual energy inspection prototype built by BERTIN at Pellenc ST site
Dynamic trials were carried out in industrial conditions (speed 3 m.s-1). Table 2 shows the results obtained on plastics among which those containing brome should be detected (positive). All materials were manually tested to check the real part with and without brome.
TABLE 2. trials with prototype at industrial speed (3m/s) Initial flux (manual
check)
After sorting : negative materials (kg)
After sorting : positive materials (kg) Total (kg) without Br Tn = 0,900 Fp = 0,071 Cn = 0,971 with Br Fn = 0,005 Tp = 0,700 Cp = 0,705 Rn = 0,905 Rp = 0,771 N = 1,676 Purity 99, 4 % Efficiency 99,3 %
The results obtained are very high due to the fact that the materials were between 1 and 2 mm in thickness, which is much higher that the limit of detection which was simulated from brome samples (see table 1).
4.2. Field trials with industrial machine
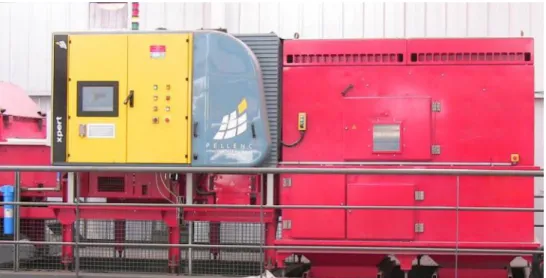
From the expertise gained with the prototype, a sorting machine « XPert » was built by PELLENC ST (fig.11). Three machines are operating on site by now. Mechanical design includes radioprotection and Xpert machine do not require a safety area as regards NFC-15160 standard. Two principal applications have been developed with corresponding calibrations, metals and plastics sorting.
FIGURE 11 : Industrial sorting machine Xpert (PELLENC ST)
Sorting of metals
At present, metals coming from old vehicles after crushing are inspected by a floating process in order to re-use the part with aluminum (light fraction) which can directly be recycled in casting industry. However, the heavy fraction can still contain aluminum which can be inspected afterwards with the Xpert machine. In the future, it is expected to replace the floating process by the Xpert machine used directly, which would prevent the waste water station.
Depending on the aluminum quantity in the initial flux, the sorting machine can be adapted in order to consider aluminum as the positive material to be separated (case where aluminum is the minor part), or aluminum is considered as the normal fraction, and the dense materials as positive (case where aluminum is the major part). In practice positive materials are ejected by a blower.
As seen in table 3, the best result is obtained on the purity of the normal fraction (aluminum) which is important as it is the valuable part.
Table 3. Performances obtained in the case of heavy metals ejection (field trials)
Material Ejected +
(heavy, g)
Not ejected -
(light, g) Efficiency
Aluminum 330 25000
Heavy metals (Cu, Zn + mix) 2000 499 80%
Purity 86% 98%
Sorting of plastics
European directive RoHS (2002/95/CE) restricts the use of two brome-based molecules, PBB and PBDE. Nevertheless, this list is expected to become longer as soon as toxicity of brome-based molecules is discovered. Thus, a sorting machine able to separate brome-based molecules is of great interest.
The threshold detection was chosen at 3% weight of brome. Sorting allows separating brome plastics from a plastics flux, allowing future re-use of normal plastics. This is interesting as electronic type waste products have a chemical composition very complex due to the presence of additives mostly unknown.
Trials have been carried out on high quantities of plastics (600 kg to 1 t per test) using a 3% Br weight threshold. Fluxes containing about 90% of normal plastics have been tested, one of the result is given in table 4. Purity of the two classified fraction are good (especially the recyclable part), and efficiency is also high.
Material Classified as negative (kg) Classified as positive (kg) Efficiency Without Br of Br <3% 579 4 With Br >3% 1 76 98% Purity 99.8% 98% Br content (XRF) 309 ppm
5.
Conclusion
Our study shows the interest of using a simulation code such as VXI in order to optimize acquisition conditions and assess the performances that can be expected before building a dedicated prototype. A criterion has been defined allowing to quantify the performance of a given sorting scenario. Limits of detection of different flame retardants have been shown as an exemple result. A prototype has been built by BERTIN allowing to validate the feasibility as forecasted by simulation. Finally an industrial machine was designed and built by PELLENC ST, with very good results obtained. At present, three machines are in operation at three industrial sites for metal and plastic sorting.
It is worth noting that the sandwich detector was selected for the machine as the best compromise between cost, quality and commercial availability. However, in the future, spectrometric detectors should allow increasing performances as shown by our simulations.
Acknowledgements
This study was funded by OSEO public company (now BPI France) in the framework of TRI+ project. F. Montagner did his PhD with an ANRT-CIFRE grant with BERTIN company, supervised by INSA-Lyon. The authors wish to thank R. Le Floch for his contribution to the project.
References
[1] H. VOGEL and D. HALLER. “Luggage and shipped goods”. European Journal of Radiology, Vol. 62, pp. 242–253, 2007.
[2] B. JACOBSON. “Dichromatic absorption radiography : dichromography”.Acta Radiol., Vol. 39, pp. 436–452, 1953.
[3] R. ALVAREZ and A. MACOVSKI. “Energy-selective reconstructions in X-ray computerized tomography”. Phy. Med. Biol., Vol. 21, pp. 733–744, 1976.
[4] R. ALVAREZ, A. MACOVSKI, J. CHAN, J. STONESTROM, and L. ZATZ. “Energy dependent reconstruction in X-ray computerized tomography”. Comput. Biol. Med., Vol. 6, pp. 325–336, 1976.
[5] T. WANG and J. EVANS. “Stereoscopic dual-energy X-ray imaging for target materials identification”. Institution of Electrical Engineers, Vol. 150, pp. 122–130, 2003
[6] V. REBUFFEL and J. DINTEN. “Dual-Energy X-Ray Imaging : Benefits and Limits”. British
Institute of Non-Destructive Testing, Vol. 49, pp. 572–609, 2007.
[7] P. DUVAUCHELLE, N. FREUD, V. KAFTANDJIAN, D. BABOT. “A computer code to simulate X-ray imaging techniques”.NIM B, Vol. 170, pp. 245–258, 2000.
[8] N. FREUD, P. DUVAUCHELLE, and D. BABOT. “New developments in virtual X-Ray imaging : fast simulation using a deterministic approach”. Rev. of QNDE, Vol. 22, pp. 553–560, 2003. [9] N. FREUD, P. DUVAUCHELLE, S. PISTRUI-MAXIMEAN, J. LETANG, D. BABOT.
“Deterministic simulation of first order scattering in virtual X-ray imaging”. NIM B, Vol. 222, pp. 285–300, 2004.
[10] P. DUVAUCHELLE and J. BERTHIER. “New developments in analytical calculation of first order scattering for 3D complex objects”. International Symposium on Digital industrial
Radiology and Computed Tomography, DIR 2007, Lyon.
[11] F.MONTAGNER, “Nouvelles méthodes de tri des déchets par rayons X”, PhD of INSA de Lyon, 2012, 174p.
[14] C. METZ. “Basic principles of ROC analysis”, Seminars in Nuclear Medicine, vol.8, 1978. [15] P. BRADLAY. “The use of area under the ROC curve in the evaluation of machine learning