HAL Id: cea-02509097
https://hal-cea.archives-ouvertes.fr/cea-02509097
Submitted on 16 Mar 2020
HAL is a multi-disciplinary open access
archive for the deposit and dissemination of
sci-entific research documents, whether they are
pub-lished or not. The documents may come from
teaching and research institutions in France or
abroad, or from public or private research centers.
L’archive ouverte pluridisciplinaire HAL, est
destinée au dépôt et à la diffusion de documents
scientifiques de niveau recherche, publiés ou non,
émanant des établissements d’enseignement et de
recherche français ou étrangers, des laboratoires
publics ou privés.
Dynamic effects on fracture toughness for ferritic steel
in the ductile-to-brittle transition
C. Jacquemoud, I. Delvallee-Nunio, F. Balestreri
To cite this version:
C. Jacquemoud, I. Delvallee-Nunio, F. Balestreri. Dynamic effects on fracture toughness for ferritic
steel in the ductile-to-brittle transition. PVP 2015 - ASME Pressure Vessel and Piping Conference,
Jul 2015, Boston, United States. �cea-02509097�
Proceedings of the ASME 2015 Pressure Vessels & Piping Division Conference PVP2015 July 19-23, 2015, Boston, Massachusetts, USA
PVP2015-45450
DYNAMIC EFFECTS ON FRACTURE TOUGHNESS FOR FERRITIC STEEL IN THE
DUCTILE-TO-BRITTLE TRANSITION
C. Jacquemoud
CEA, DEN, DM2S, SEMT, LISN, F-91191 Gif-sur-Yvette, France
I. Delvallée-Nunio, F. Balestreri,
Institut de Radioprotection et de Sûreté Nucléaire IRSN, PSN-EXP, SES
F-92262 Fontenay-aux-Roses, France
ABSTRACT
Dynamic loading effects on ferritic steel toughness have been evaluated in the brittle-to-ductile transition, considering loading rates representative of object drops. To verify that the brittle-to-ductile transition curve, initially defined from static tests, tends to shift to higher temperatures due to dynamic effects even in the case of object drops, experiments on 16MND5 steel have been performed.
A three-point bending set-up and a thermal chamber have been designed in order to perform dynamic fracture tests on large Single Edge-notched Bending SE(B) specimen, at very low temperature using a drop-shock machine. In a first step, considering that the reference temperature of the material (according to the master curve concept) is -122 °C, dynamic tests at -120 °C have been performed. These tests have confirmed that the fracture mode is still brittle at this temperature, when an impact speed of 4.85 m/s is used.
Elastic-plastic or viscoplastic dynamic simulations of the tests, compared to classical static analysis, have demonstrated that the effects of inertia and viscosity on fracture toughness are negligible considering the very low values obtained on these tests at -120 °C. These results also confirm the decrease of fracture toughness due to dynamic loading compared to experimental data from static tests. A further step will be to complete this demonstration with dynamic tests at higher temperatures in the brittle-to-ductile transition.
NOMENCLATURE
a crack depth
B specimen thickness
E Young’s modulus
J non-linear strain energy release rate
JC non-linear strain energy release rate value at crack initiation
KJ elastic plastic stress intensity factor
KJ = (E.J / (1-²))0.5
L specimen length
KJ̇ stress intensity rate
KJC fracture toughness T temperature t time Ux specimen deflection W specimen width Poisson’s ratio INTRODUCTION
In the safety assessment of packages used to transport radioactive materials, the absence of brittle fracture has to be demonstrated in case of severe accidents like the unlikely 9-m drop at -40 °C for instance [1, 2]. For an accurate analysis of the component structural integrity, fracture mechanics characteristics of the material have to be defined under high loading rates. Some material properties have been defined under dynamic loading conditions, however, fracture toughness behavior under these conditions still needs to be investigated.
Different authors have observed an influence of loading rates on fracture toughness for metallic materials [3, 4]. The brittle-to-ductile transition curve, initially defined from quasi-static tests, tends to be shifted to higher temperatures due to dynamic effects at high loading rates encountered in Charpy tests or Hopkinson Bar tests, around K̇ = 10J 6 MPa.m0.5/s. Even
if these levels are slightly lower, around 104 – 105 MPa.m0.5/s, under drop test conditions, Müller [5] has observed similar effect on large cast iron SE(B) specimens submitted to guided drop tests.
Until recently, equivalent static analyses were considered adequate to deal with dynamic loading conditions as the results obtained were considered to be conservative. But, in theory, accurate analysis of such tests should take into account both
inertial and viscous effects. Indeed, the behavior of feritic steels becomes viscous at high strain rates [3, 6]. In order to be as representative as possible, inertial and viscous effects on fracture toughness have to be quantified to be able to verify if a static analysis is conservative in these conditions.
In this paper, the effect of dynamic loading on the fracture toughness of the 16MND5 ferritic steel has been investigated. For this steel grade, a large experimental database, based on quasi-static CT tests, is already available and has been used as a reference for comparison. The aim is to verify if the dynamic loading conditions tend to shift the transition curve to higher temperatures for the 16MND5 steel, at loading rates representative of object drop conditions. For this evaluation, drop tests on large SE(B) specimens have been considered to determine the fracture mechanics characteristics of the material under dynamic loading conditions. A second aim in this study is to evaluate if the equivalent static analysis, used to deal with dynamic problems, is conservative, compared to dynamic analysis, taking into account inertial and viscous effects.
TESTING DEVICE
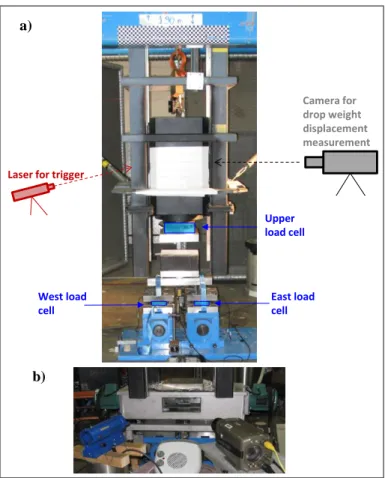
A drop test facility with a maximum height of 8 m and allowing impact velocities up to 12 m/s, has been used for the purpose of the study (Figure 1).
FIG. 1: (A) DROP TEST FACILITY WITHOUT THE THERMAL CHAMBER – (B) THERMAL CHAMBER WITH THE
HIGH-SPEED VIDEO CAMERA
A three-point bending set-up was placed under the drop test machine equipped with a drop weight of 113 kg. A fixed plate containing the upper anvil was placed on top of the specimen before testing, so that during the test, the sliding drop weight impacts this plate and not the specimen directly. To reduce high frequency waves and loading levels at impact, a honey comb was added on the top of the plate.
The specimen has been maintained on the lower supports (but free to move) to avoid loss of contact during the test. This problem has been observed by Kalthoff [7].
To conduct the test at very low temperature, a thermal chamber was especially designed to be included to the drop test machine. Its dimensions were adapted to the bending set-up in order to leave the load cells outside of the chamber. At very low temperature, during injection of gaseous nitrogen, air tightness is maintained while allowing video recording of the specimen through a window. A heating system was also necessary to maintain the window clear. The temperature capacity of this chamber was validated down to -150°C.
FIG. 2: (A) POINT FOR THE MEASUREMENT OF SPECIMEN DEFLECTION ON THE IMAGES OF THE HIGH-SPEED VIDEO CAMERA –POSITION OF STRAIN GAGES CLOSE TO
CRACK TIP (B) AND ON THE TOP SURFACE OF THE SPECIMEN (C)
With respect to the measuring techniques, the drop test device was initially equipped with load cells: one on each support below the specimen (noted East and West load cells on Figure 1-a) and one on the drop weight (noted Upper load cell on Figure 1-a). A Zimmer camera recorded the displacement of the drop weight.
a) b) East load cell West load cell Upper load cell Camera for drop weight displacement measurement
Laser for trigger
Side view J1 J2 5 J3 30 y x J4 30 1 Top view y z 440 a) I1 y x I2 East support West support Fixed plate Upper anvil Honey comb b) c)
Moreover, low temperature strain gages were placed on the specimen. Two of them (noted J1 and J2 on Figure 2) were installed close to the crack tip, one on each side of the supposed crack path, at a distance of 5 mm from the crack plane to measure crack opening strain. Two other strain gages (noted J3 and J4 on Figure 2) were placed on the top surface of the specimen, at a distance of 30 mm from the crack plane to measure longitudinal compressive strain.
All the previously described measurements (drop weight load and displacement, East and West support load and the four strain gages) were recorded at a frequency of 225 kHz.
A high-speed video camera was used to record crack initiation, crack propagation and the specimen deflection before initiation. A frequency of 152,000 frames per second was chosen as it was considered to be high enough to accurately capture the initiation time at such high loading rates and to allow an image resolution (which directly depends on the recording frequency) accurate enough to measure the specimen deflection.
A laser focusing on the drop weight was used as a common trigger for both recording systems (high-speed video camera and 225 kHz recording system).
Since the difficulty in such dynamic fracture tests is the determination of the impact and initiation times, the objective was to have a combination of measurements for these times. The first measurement was made on the images recorded by the high-speed video camera. The second one was given by the strain gages close to the crack tip, considering that the increase and then the sudden decrease on strain correspond respectively to the time of impact and the time at crack initiation. From literature [8, 9], to apply this second method for initiation time determination, strain gages are usually placed at a distance of 2 mm from the crack path. This limits the error introduced in the initiation time calculation due to the time needed for the stress wave to travel from crack tip to strain gage. The initiation time is usually calculated by deducing the travel time of the stress wave from the time when the maximum strain is measured on strain gages. Nevertheless, a larger distance of 5 mm has been chosen in this study for two reasons: firstly, when validating the finite element calculations, experimental comparison of strain measurements at 2 mm to numerical results has proven difficult and secondly, on previous feasibility tests, initiation time calculations with strain gages either at 5 mm or at 2 mm have given the same results.
The temperature was recorded before and during the test using six type K thermocouples placed on the specimen. When designing the thermal chamber, validation tests were performed with seventeen thermocouples placed on the specimen and through its thickness. The results have demonstrated the homogeneity of the specimen temperature and validated the use of six thermocouples for the tests.
IMPACT TESTS
TEST CONDITIONS
The material considered in this study is a 16 MND 5 ferritic steel (equivalent to SA 508 Cl. 3) manufactured by Creusot Loire Industrie. It has been subjected to the following heat treatments: first heat treated (890°C for 4 h 30 min) and water quenched and second tempered (660°C for 6 h 30 min) and cooled in air. Its chemical composition is reported in Table 1.
The material reference temperature, in the master curve representation, had been determined in [10], according to ASTM E1921, to be T0 = -121.8 °C.
TABLE 1: CHEMICAL COMPOSITION OF 16 MND 5 STEEL COMPARED TO SA 508 CL 3
Single Edge-notched Bend SE(B) specimens with a square section of 50 mm width (W), a total length (L) of 440 mm and span (S) of 300 mm were used in the tests. An initial crack size of a/W = 0.5 was obtained after fatigue pre-cracking. This value was chosen to be similar to the a/W ratio on specimens already tested in quasi-static conditions on this material. The crack propagation direction is also similar to those of quasi-static tests.
Considering the material reference temperature of -122°C (defined from quasi-static tests according to master curve concept), a temperature of -120°C was first investigated in order to confirm that the fracture mode is still brittle at this temperature due to the high loading rate. Six guided drop tests were performed. A drop height of 1.2 m was used, leading to a theoretical velocity at impact of 4.85 m/s. This value has been chosen to be consistent with the loading rates of drop tests on transport casks [5].
EXPERIMENTAL RESULTS
Complete brittle fracture was observed on the six specimens confirming that the fracture mode in tests on SE(B)50 specimens at high loading rate is brittle at a temperature nearly equal to the material reference temperature (T0) defined from static tests.
The homogeneity of the specimen temperature was checked before and during the test. The maximum temperature variation recorded on the six thermocouples placed on the specimen was less than 5°C for all tests. The temperature of the East and West load cells, below the thermal chamber, remained above -5°C during all tests, which is in accordance with the cell working recommendation.
C Mn P S Si Ni Mo Cu Sr Cr V Al Co SA 508 Cl 3 0,153 1,37 0,007 0,007 0,24 0,71 0,51 0,061 0,19 - - -
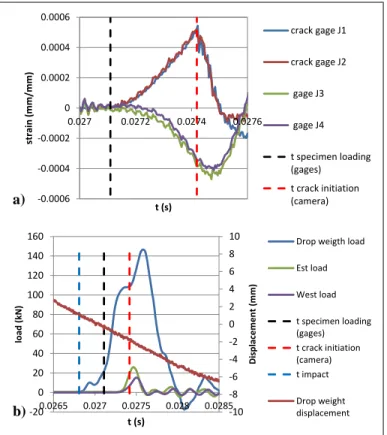
The experimental results are similar for all the tests conducted. As an example, results of test 14-134 have been described in detail in the following paragraphs.
FIG. 3: (A) TIME EVOLUTIONS OF LONGITUDINAL STRAIN ON GAGES J3 AND J4 AND OPENING STRAIN CLOSE TO
THE CRACK TIP ON GAGES J1 AND J2- (B) TIME EVOLUTIONS OF LOADS ON DROP WEIGHT, EAST AND WEST SUPPORTS AND DISPLACEMENT ON DROP WEIGHT
FOR TEST 14-134.
Figure 3-a) presents, for test 14-134, the time evolutions of longitudinal strain on gages J3 and J4 and of the opening strain close to the crack tip on gages J1 and J2. The time evolutions of loads on drop weight, the East and West supports and displacement on drop weight are plotted in Figure 3-b) for the same test. As illustrated in Figure 3-b), the loads at crack initiation (maximum load values) measured on each of the two supports (East and West) are different. This phenomenon appears in some other tests and is probably due to a slight displacement or rotation of the upper anvil at the time of impact, leading to an asymmetrical loading of the specimen. In fact, even if the upper anvil is precisely positioned on the specimen before the test (and is not expected to move), a mechanical clearance is necessary between the drop weight and the slide rails of the test facility, leading to slight inaccuracy in its position at the time of impact.
Synchronization of both recording systems was validated by comparing the time at crack initiation calculated from the
strain gage data and from the optical analysis of the high-speed video data. In Table 2, the crack initiation time given by the strain gages (J1 and J2) has been calculated by determining the wave travel time (from the crack tip to the strain gages) from the time of the maximum strain measured on strain gages (illustrated in Figure 3-a)). The difference between both values of initiation time (noted tinitiation in Table 2) remains very low and corresponds to an error less than 0.1%.
TABLE 2: EXPERIMENTAL DATA: IMPACT, BEGINNING OF LOADING AND CRACK INITIATION TIMES, DROP WEIGHT
VELOCITY AT IMPACT TIME
Displacement of the upper anvil remains very small during the first milliseconds after the impact. Therefore, considering the resolution of the images, the time of impact is difficult to define from the high-speed video camera data and thus is not used. The time of impact was considered to correspond to the start of load increase on the drop weight load cell. As only the specimen was modeled in the simulation, knowing the exact impact time is not considered necessary. Nevertheless, data concerning the specimen loading are needed with accuracy.
As a honey comb was placed between the specimen and the drop weight, the beginning of the specimen loading is delayed (from the impact time), because of the deformation of the honey comb. The time defining the beginning of the specimen loading, given in Table 2, corresponds to the time when strain starts to increase on strain gages (J1 to J4), which appears clearly on the four strain evolutions with time. This measurement is considered to be more accurate than the one given by East or West load, as the strain gages values (especially from J1 and J2) were measured on the specimen. In comparison, the load cells were placed below the support and it appears clearly on Figure 3-b) that the beginning of load increase is delayed compared to the beginning of strain increase. Therefore, the time defining the beginning of the specimen loading, considered further in the simulation, is the one given by the strain gages.
Considering this time as reference, the experimental specimen deflection was measured on the images of the high-speed video camera during specimen loading until crack initiation. The evolution with time, of specimen deflection measured at two points I1 and I2, placed on the upper anvil and on the specimen (Figure 2-a)), is plotted in Figure 4, as an example for test 14-134. A slight scatter is observed in experimental specimen deflections. This is due to the slight difference in the drop weight velocities at the time of impact.
-0.0006 -0.0004 -0.0002 0 0.0002 0.0004 0.0006 0.027 0.0272 0.0274 0.0276 str ai n ( mm /mm ) t (s) crack gage J1 crack gage J2 gage J3 gage J4 t specimen loading (gages) t crack initiation (camera) -10 -8 -6 -4 -2 0 2 4 6 8 10 -20 0 20 40 60 80 100 120 140 160 0.0265 0.027 0.0275 0.028 0.0285 Di sp lac e m e n t (m m ) lo ad ( kN ) t (s)
Drop weigth load Est load West load t specimen loading (gages) t crack initiation (camera) t impact Drop weight displacement a) b) impact time start of specimen loading velocity of drop weight #test t (s) t (s) t (s) camera t (s) gauges tinitiation (ms) (m/s)
14-129 0.026270 0.026510 0.026791 0.026778 13 5.04 14-130 0.026330 0.026580 0.026911 0.026896 14 4.87 14-131 0.026610 0.026840 0.027097 0.027108 11 4.82 14-132 0.026390 0.026670 0.027104 0.027088 16 4.60 14-133 0.026740 0.027050 0.027328 0.027349 21 4.82 14-134 0.026810 0.027108 0.027419 0.027420 1 4.79
These velocities, calculated from the drop weight displacement, are between 4.60 m/s and 5.04 m/s, which are close to the theoretical value of 4.85 m/s. This difference is directly linked to the initial drop height, which are not the same in all tests. Even if this difference is really slight, to avoid any error in the interpretation, each test has been simulated separately considering its own experimental deflection evolution.
FIG. 4: TIME EVOLUTIONS OF SPECIMEN DEFLECTION MEASURED AT TWO POINTS I1 AND I2 FOR TEST 14-134
COMPARED TO THE UX(T) INTERPOLATION USED AS INPUT DATA IN THE SIMULATION.
FRACTURE TOUGHNESS CALCULATION
MODEL DESCRITION
A 3D mesh of one quarter of the SE(B) specimen was generated with CASTEM® [11]. Each specimen was meshed independently with its exact crack dimensions measured experimentally on the fractured surface.
Symmetry boundary conditions were applied and a displacement, corresponding to the specimen deflection, was imposed on the top of the specimen. The experimental specimen deflection, measured on the images of the high-speed video camera, has not been directly used in the simulations but an interpolation of Ux(t) has been used instead. To take into account the slight scatter in the experimental specimen deflection discussed above, each test was simulated using its own interpolation Ux(t).
Considering that all specimens failed by brittle mode, all finite element analyses were performed assuming the small displacements and small deformation.
To compare viscosity and inertial effects on the stress intensity factor at fracture, three types of simulations were performed:
- Dynamic calculation considering an elastic-plastic material
- Dynamic calculation considering a viscoelastic material
- Static calculation considering an elastic-plastic material
The elastic-plastic simulations were performed using the experimental tensile curve of the material at -120°C which has been defined from static tests [10].
To take into account the viscosity effects on material behavior in dynamic simulations, a Symonds & Cowper type law was considered. A formulation, with parameters depending on temperature and equivalent plastic strain has been proposed for the chosen material in [6]. Parameters at -125°C, based on compressive tests at strain rates corresponding to the ones observed in our tests have been identified in [6] and were considered for the following simulations.
MODEL VALIDATION
This model was validated by comparing the results from the dynamic elastic-plastic simulations to the experimental results. These simulations show a good agreement with the experimental results for all tests. An illustration of this validation for test 14-134 is described below and also shown in Figure 5.
FIG. 5: COMPARISON OF SIMULATED AND EXPERIMENTAL RESULTS ON (A) TIME EVOLUTIONS OF LONGITUDINAL
STRAIN ON GAGES J3 AND J4 AND OPENING STRAIN CLOSE TO THE CRACK TIP ON GAGES J1 AND J2- (B) TIME EVOLUTIONS OF EAST AND WEST LOADS FOR TEST
14-134.
Firstly, in Figure 5-b), it can be seen that the numerical load-time evolution, obtained from dynamic calculation, contains large oscillations compared to its maximum value. The 0 0.1 0.2 0.3 0.4 0.5 0.6 0 0.0001 0.0002 0.0003 0.0004 0.0005 Ux (m m ) t (s)
14-134 : specimen deflection from images of video camera t0 = t specimen loading (gages) = 0.027108s
deflection point I1 deflection point I2 Ux(t) interpolation t crack initiation (camera) -7.E-04 -5.E-04 -3.E-04 -1.E-04 1.E-04 3.E-04 5.E-04 7.E-04 0 0.0001 0.0002 0.0003 0.0004 0.0005 0.0006 str ai n ( m m /m m ) t (s)
14-134 : avec t0 simu = timpactspecimen loading (gages) = 0.027108s
Mean strain on gages
gage (J1) gage (J2) Simu J1 gage (J3) gage (J4) Simu J3 -10 -5 0 5 10 15 20 25 30 0 0.0005 0.001 lo ad ( kN ) t (s)
14-134 : t0 simu = t specimen loading = 0.027108s East and West loads
East load (test) West load (test) Simulated load (dynamic) Simulated load (static) t crack initiation (camera) a) b)
numerical load-time evolution, obtained from the static calculation, appears to be an average curve of the dynamic load and thus presents a good correlation with the average experimental load (on the 2 load cells). As already mentioned, the load cells are located far below the specimen, whereas, the numerical load value is measured on the specimen, therefore, the numerical results appear qualitatively good.
Secondly, the local strain measurements on the specimen were considered to give more accurate data. The simulated opening strain on gage J1 and the longitudinal strain on gage J3, presented in Figure 5-a), are an average value of the strain at the Gauss points over a rectangular area corresponding to the gage active grid (5 mm by 4 mm). A very good correlation was obtained on the strain measurements, both on the maximum values and on the time evolutions. Indeed, the simulation reproduces accurately the time shift between the maximum strain on the gages J1/J2 (close to the crack tip) and on the gages J3/J4 (on the top surface of the specimen).
Except for the difference between static and dynamic load-time evolutions (for lower supports) discussed above, the strain evolutions with time resulting from either dynamic elastic-plastic, the dynamic viscoplastic or static elastic-plastic simulations give similar results that compare favorably with the experiments.
TABLE 3: J AND KJ VALUES, STRAIN RATE AND STRESS INTENSITY RATE CALCULATED FROM DYNAMIC ELASTIC
PLASTIC SIMULATIONS AT THE CRACK INITIATION TIME
Finally, the strain rate values were calculated from dynamic elastic-plastic simulations and presented in Table 3. The maximum strain rate close to the crack tip range from 80 s-1 to 150 s-1 and range from 40 s-1 to 70 s-1 on the supposed crack path, at the time of crack initiation. These results attest to the dynamic conditions of the test, as quasi-static conditions are assumed in [5] for strain rates below 0.1 s-1.
STRESS INTENSITY FACTOR AT FRACTURE
J integral value has been calculated during post treatment of each type of simulation giving 3 values of J at fracture time: dynamic elastic plastic, dynamic viscoplastic or static elastic plastic. The contour independency of J value has been checked on dynamic elastic plastic simulations. The JC values presented in table 3 are the maximum values along the crack tip.
The scatter in JC values at fracture, obtained from the dynamic elastic plastic simulations, is very low. For the
6 specimens tested, dynamic fracture occurs for JC values between 4.20 kJ/m² and 5.67 kJ/m². This JC value has been calculated at the crack initiation time measured from the images from the high-speed video camera. To evaluate the error that can be made on J value calculation induced by the method of crack initiation determination (from high-speed video camera or from strain gages), the JC variation, denoted as Jc in table 3, during the t given in table 2 and supposed to be the error on crack initiation time determination has been calculated. This
Jc value remains very low and does not put into question the very low scatter in the JC results at fracture.
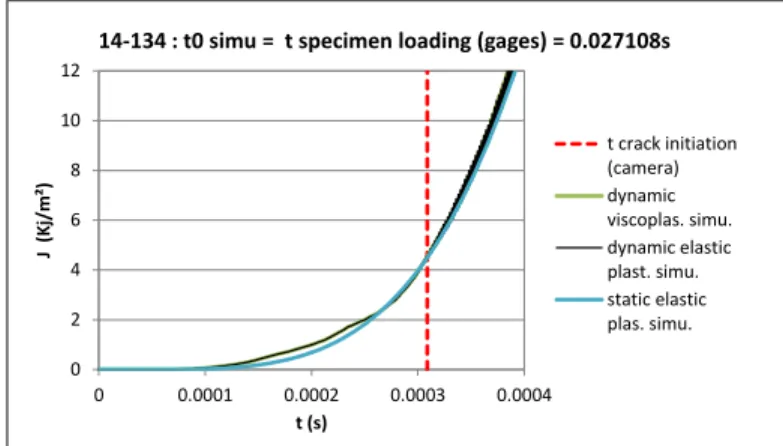
At such low JC values, the inertial and viscous effects are negligible. The J evolutions with time, obtained from the three types of simulation on test 14-134, confirm this observation. Nevertheless, at higher JC levels (which would correspond to JC levels obtained from tests at higher temperature), viscous effects (in dynamic simulation) tend to increase the J value, compared to the value obtained from dynamic elastic plastic simulation. An equivalent static simulation would also tend to increase the JC value. The question is: do viscous effects counterbalance inertial effects? The next step in the evaluation of the calculation method of JC at fracture in dynamic conditions would be to compare these 3 types of simulations on tests at higher temperature, to quantify the influence of inertial effects versus viscous effects for higher JC levels.
FIG. 6: J EVOLUTION WITH TIME FOR THE 3 TYPES OF SIMULATION OF TEST 14-134.
The lack of inertial or viscous effect observed on test 14-134 in Figure 6 was also observed in the simulations of the remaining tests as the JC values at fracture are nearly equal. Consequently, only the JC values at fracture obtained from dynamic elastic-plastic simulations have been reported in Table 3.
The corresponding values of stress intensity factors have been calculated from JC value for each test and are also presented in Table 3. They can be compared to the fracture toughness of the same material obtained from quasi-static tests
#test Jc (kJ/m²) Jc (kJ/m²) KJc (MPa.m0.5) max strain rate (s-1) mean strain rate (s-1) (MPa.m0.5.s-1) 14-134 4.5 0.45 0.00 145 70 2.50E+05 14-133 4.2 1.04 0.00 80 40 2.00E+05 14-132 5.67 0.87 0.00 120 40 1.90E+05 14-131 4.45 0.65 0.12 100 40 2.00E+05 14-130 5.29 1 0.00 150 70 2.50E+05 14-129 4.87 0.74 0.18 120 70 2.50E+05 crack initiation 0 2 4 6 8 10 12 0 0.0001 0.0002 0.0003 0.0004 J (K j/ m ²) t (s)
14-134 : t0 simu = t specimen loading (gages) = 0.027108s
t crack initiation (camera) dynamic viscoplas. simu. dynamic elastic plast. simu. static elastic plas. simu.
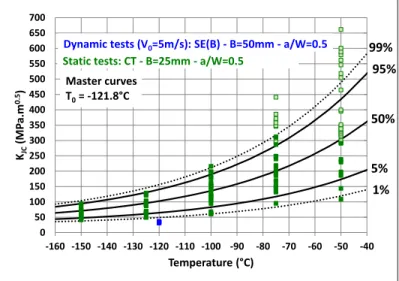
on CT specimen. Figure 7 shows the results from an exhaustive database presented in [12] corresponding to specimen size of W = 50 mm, B = 25 mm and a/W = 0.5. Fracture toughness obtained from tests under dynamic loading conditions clearly appears to be below the experimental dispersion of data from static tests.
FIG. 7: EVOLUTION OF KJ WITH TEMPERATURE FOR 16MND5 STEEL: VALUES FROM CT STATIC TESTS
COMPARED TO SE(B) DYNAMIC TESTS.
This confirms that the increase in the stress intensity rate, from less than 1 MPa.m0.5/s in quasi-static tests, such as the CT tests presented in Figure 7, to a value between 1.9x10⁵ MPa.m0.5/s and 2.5x10⁵ MPa.m0.5/s for the dynamic SE(B) tests (Table 3), leads to a decrease in the fracture toughness at -120°C for the 16MND5 ferritic steel. These results are consistent with a study dedicated to the safety assessment of transport package for radioactive materials. Müller [5] observed a decrease of fracture toughness of cast iron from quasi-static (K̇ = 0.1 J
MPa.m0.5/s) to dynamic (K̇ = 5x10J 4 MPa.m0.5/s) tests on SE(B)
specimens at a given temperature in the transition. Results on Hopkinson Bar tests on steel [3] also confirmed that at a given temperature, the ductile to brittle transition appears as the loading rate was increased.
All these observations are consistent with the assumption that the brittle-to-ductile transition curve, initially defined from static tests, tends to be shifted to higher temperatures due to dynamic effects even for the loading rates considered in the case of object drops. The next step in this study would be to verify the assumption at higher temperatures that are in the brittle-to-ductile transition region for the 16MND5 steel.
CONCLUSION
To evaluate effects of high loading rates on fracture toughness of ferritic steel, a three-point bending device has been designed to perform drop tests on large SE(B) specimens
at low temperature. A thermal chamber has been built to allow recording of the test with a high speed video camera.
The six specimens, tested at an impact velocity of about 5 m/s have all demonstrated brittle fracture at -120 °C. These experimental results show the proper functioning of the drop test machine and the thermal chamber. It also validates the measuring techniques which have been adapted for this type of test at high loading rates, giving accurate data to validate calculations.
The values of dynamic fracture toughness, calculated from elastic-plastic simulations, are below the ones obtained from quasi-static tests on CT specimens. The scatter in J values for the drop test is low: the fracture occurred for J between 4.20 kJ/m² and 5.67 kJ/m². The dynamic elastic-plastic and viscoplastic simulations compared to static elastic-plastic simulations illustrate that the inertial and viscous effects are negligible on the J calculation at fracture for such low J levels.
All these observations are consistent with the assumption that the brittle-to-ductile transition curve, initially defined from static tests, tends to be shifted to higher temperatures due to dynamic effects even for the loading rates considered in the case of object drops. The next step in this study will be to verify the assumption at a much higher temperatures that are in the brittle-to-ductile transition region for the 16MND5 steel. As the fracture toughness is expected to be higher at this temperature, these tests will allow quantifying the influence of inertial effects versus viscous effects.
REFERENCES
1 European PDSR Guide ISSUE 2 (September 2012) - Technical Guide, Package Design Safety Reports for the Transport of Radioactive Material.
2 IAEA Safety Standards – TS-R-1, Regulations for the Safe Transport of Radioactive Material, 2012 Edition.
3 O. Wall, 2002, Dynamic crack propagation in large steel specimens, Engineering fracture mechanics, 69(7), pp 835–849.
4 R. Chaouadi, J.L. Puzzolante, 2006, Loading rate effect on ductile fracture, 16th European Conference of Fracture (ECF16), Alexandroupolis, Greece, July 3-7 2006. 5 K. Müller et al., 2002, Fracture toughness behaviour of thick-walled nodular cast iron at elevated loading rates, In: Transferability of Fracture Mechanical Characteristics, 78, pp 283-290.
6 B. Prabel, S. Marie, A. Combescure, 2008, Using the X-FEM method to model the dynamic propagation and arrest of cleavage cracks in ferritic, Engineering fracture mechanics, 75(10), pp 2984-3009. 0 50 100 150 200 250 300 350 400 450 500 550 600 650 700 -160 -150 -140 -130 -120 -110 -100 -90 -80 -70 -60 -50 -40 KJC (MP a. m 0.5 ) Temperature (°C) Master curves T0= -121.8°C 5% 50% 95%
Static tests: CT - B=25mm - a/W=0.5
1% 99%
7 J.F. Kalthoff, 1985, On the measurement of dynamic fracture toughnesses - a review of recent work, International journal of fracture, 27(3), pp 277–298.
8 W.G. Guo et al., 1997, Analytical and experimental determination of dynamic impact stress intensity factor for 40 Cr steel, Theoretical and Applied Fracture Mechanics, 26, pp 29-34.
9 J. Fengchun et al. 2004, Evaluation of dynamic fracture toughness KId by Hopkinson pressure bar loaded instrumented Charpy impact test, Engineering Fracture Mechanics, 71, pp. 279–287.
10 M. Reythier et al., 2006, Thermomechanical analysis of thermal shock fracture in the brittle/ductile transition zone— Part II: Numerical calculations and interpretation of the test results, Engineering Fracture Mechanics, 73, pp 283-295.
11 CAST3M, http://www-cast3m.cea.fr
12 C. Jacquemoud et al., 2014, Additional data concerning French PWR RPV steel to evaluate the relevance of a size effect correction on toughness in the ductile-to-brittle transition, Proceedings of the ASME 2014 Pressure Vessels & Piping Division Conference, Anaheim, California, USA, July 20-24, 2014.