R E S E A R C H A R T I C L E
Open Access
Social dominance explains within-ejaculate
variation in sperm design in a passerine
bird
Alfonso Rojas Mora, Magali Meniri, Sabrina Ciprietti and Fabrice Helfenstein
*Abstract
Background: Comparative studies suggest that sperm competition exerts stabilizing selection towards an optimal sperm design– e.g., the relative size and covariation of different sperm sections or a quantitative measure of sperm shape - that maximizes male fertility, which results in reduced levels of within-male variation in sperm morphology. Yet, these studies also reveal substantial amounts of unexplained within-ejaculate variance, and the factors
presiding to the maintenance of such within-male variation in sperm design at the population level still remain to be identified. Sperm competition models predict that males should progressively invest more resources in their germline as their mating costs increase, i.e., the soma/germline allocation trade-off hypothesis. When access to fertile females is determined by social dominance, the soma/germline allocation trade-off hypothesis predicts that dominant males should invest less in the control of spermatogenesis. Hence, dominance should positively correlate with within-male variance in sperm design.
Results: In support of this hypothesis, we found that dominant house sparrow males produce ejaculates with higher levels of within-ejaculate variation in sperm design compared to subordinate males. However, after experimentally manipulating male social status, this pattern was not maintained.
Conclusions: Our results suggest that males might control variation in sperm design according to their social status to some extent. Yet, it seems that such within-ejaculate variation in sperm design cannot be rapidly adjusted to a new status. While variation in sperm design could result from various non-exclusive sources, we discuss how strategic allocation of resources to the somatic vs. the germline functions could be an important process shaping the relationship between within-male variation in sperm design and social status.
Keywords: Sperm competition, Social hierarchies, Within-ejaculate variation, Soma vs. germline, Sperm morphology Background
Spermatozoa are one of the most morphologically di-verse cells across animal taxa [1], with sizes ranging
from 8 μm in the Hymenoptera Meteorus sp. [1] to
58 mm in Drosophila bifurca [2]. Such large variation in sperm morphology has presented a conundrum to sexual selection studies. Most of the efforts were put into iden-tifying interspecific differences in the mean values of sperm morphology [3–9], though Ward [10] stressed that there is large intraspecific variation in sperm morphology. Further studies investigated such
within-species, among-male variation in sperm traits [11–19], and many of them suggested that post-copulatory sexual selection is an important selective pressure in reducing the levels of among-male variation in sperm morph-ology. Although within-male variation in sperm has also been reported in some studies (e.g., [20]), what causes and maintains within-male variation in sperm morph-ology has been seldom explored.
There exist several non-mutually exclusive explana-tions as to why sperm can vary within ejaculates. A con-flict between the diploid (i.e., the male phenotype) and the haploid genome (i.e., the spermatozoon phenotype) has been predicted to result in morphological variation [21, 22]. However, diploid genes are the main determi-nants of sperm morphology [23], and the optima for the * Correspondence:[email protected]
Laboratory of Evolutionary Ecophysiology, Institute of Biology, University of Neuchatel, Rue Emile-Argand 11, Neuchatel, Switzerland
© The Author(s). 2017 Open Access This article is distributed under the terms of the Creative Commons Attribution 4.0 International License (http://creativecommons.org/licenses/by/4.0/), which permits unrestricted use, distribution, and reproduction in any medium, provided you give appropriate credit to the original author(s) and the source, provide a link to the Creative Commons license, and indicate if changes were made. The Creative Commons Public Domain Dedication waiver (http://creativecommons.org/publicdomain/zero/1.0/) applies to the data made available in this article, unless otherwise stated.
diploid and haploid phenotype tend to be similar under strong sperm competition [21]. Production of large sperm numbers has been shown to be associated with more numerous errors in sperm production [24, 25], suggesting that inevitable developmental errors can partly maintain within male variation. It has also been suggested that sperm competition could lead to the evo-lution of different sperm phenotypes that play different roles in the ejaculate [19, 26], thus resulting in a mixed strategy ejaculate. Alternatively, Birkhead et al. [27] hy-pothesized that as the intensity of sperm competition is relaxed, males could afford lower sperm production control (e.g., higher morphological variation). Compara-tive studies have found support for the latter hypothesis [11, 13, 14, 28, 29], arguing that sperm competition ex-erts strong stabilizing selection towards optima in sperm
design – e.g., the relationship between different sperm
sections. While comparative studies stress the role of sperm competition in reducing intraspecific among-male variation, the levels of within-male variation do not seem to follow evident patterns (e.g., within-male variation does not match among-male variation [30]).
In species where the access to fertile females differs across males, theory predicts that non-favoured males should invest more resources in the production of high quality ejaculates (for reviews see [31, 32]). Further, sperm morphology and design have been correlated with male fertilizing success, and thus they might be im-portant components of ejaculate quality (for reviews see [33, 34]). Two models predict that a continuous increase in costs to obtain a mate should select for continuously increasing resource investment in the production of high quality ejaculates, i.e., the soma/ germline allocation trade-off hypothesis [35, 36]. In species where access to fertile females is determined by social dominance, we propose that the amount of within-male variation in sperm morphology will de-pend on male social status. Thus, based on the soma/ germline allocation trade-off, we predict that as males are less dominant they should exhibit lower within-male variation in sperm morphology resulting from higher re-source investment in sperm production control.
House sparrows Passer domesticus are socially monog-amous birds with levels of extra-pair paternity ranging between 12-15% [37–40], and in this species, social hier-archies covary with male reproductive behaviours and male access to fertile females (e.g., mate-guarding, copu-lation attempts and success [41]). Moreover, a previous study on house sparrows reported a large amount of within-male variation, which, for some sperm traits, exceeded between-male variation [20]. Further, a more recent study found that dominant house sparrow males produce ejaculates of lower quality compared to those produced by males in the middle of the hierarchy, which
results from lower resource investment in the protection of ejaculates against oxidative stress [42]. To test whether male dominance explains levels of within-male variation in sperm design, we maintained 60 wild male and 60 wild female house sparrows in outdoor aviaries, and investigated within-male variation in sperm design according to social rank after a 4-week acclimation period. To further test the causality of the observed pat-terns, we experimentally manipulated the social status of males in a way that optimized the number of males go-ing up or down the hierarchy. In this study, we defined sperm design as the first principal component of a PCA using sperm head, midpiece, and flagellum length. Our measure of sperm design described spermatozoa in terms of the relative length of their midpiece and flagel-lum compared to the length of their head, the former two being negatively related to the latter.
Results
Before manipulating the social status
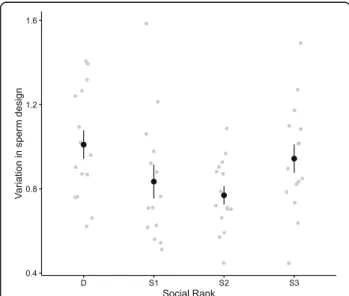
We found that males at different social ranks differed significantly in their within-ejaculate variation in sperm design (Fig. 1, Table 1a), with dominant and subordinate-3 males exhibiting larger within-ejaculate variance in sperm design. Social status did not explain variation in total sperm length (Table 1b). However, we found that variation in total sperm length varied non-additively according to the social status and the body mass (Fig. 2; rank × centred body mass, Table 1b), and this rela-tion remained after removing a potential outlier due to a very light-weight subordinate-2 male with large variation
in total sperm length (F3,43.6= 3.26, p = 0.030). The
Fig. 1 Relationship between variation in sperm design (scattered plot and mean ± SE) according to social rank before manipulating the social status
relation between variation in total sperm length and body mass was significant and positive for dominant males only (slope ± SE; dominant males: β = 0.46 ± 0.11, t10.1= 4.12, P = 0.002; subordinate-1 males: β = 0.47 ± 0.28, t10.2= 1.71, P = 0.12; subordinate-2 males: β = -0.19 ± 0.24, t12= 1.35, P = 0.20; subordinate-3 males: β = 0.06 ± 0.13, t10.1= 0.43, P = 0.68), and this remained true when removing the potential outlier. Additionally, pairwise comparisons re-vealed that the relation between variation in total sperm length and body mass differed significantly between dom-inant vs. subordinate-2 males (F1,22.1= 16.22, P = 0.006), dominant vs. subordinate-3 (F1,22.1= 5.11, P = 0.034) and
subordinate-1 vs. subordinate-2 males (F1,20.1= 5.27,
P = 0.033). However, after removing the potential outlier the difference between 1 vs. subordinate-2 was no longer statistically significant (F1,19.1= 3.19, P = 0.10).
After manipulating the social status
In order to address causal relationships between vari-ation in sperm design and social status, we manipulated social ranks by shuffling males across aviaries. This re-sulted in many males sharing similar social ranks within the new groups, which prompted males to move up or down in the hierarchy. After manipulating the social sta-tus, we found that social status did not explain the level of variation in sperm design nor in total sperm length anymore (Table 2). We also found no correlation be-tween body mass and variation in sperm design or total sperm length (Table 2).
How much individuals moved along the social ladder (difference in ranks after minus before) did not explain the difference in within-ejaculate variation between after and before the manipulation (Table 3), although there was a non-significant tendency for individuals moving up to produce less variable sperm in terms of total
Table 1 LMMs investigating how social status affects within-ejaculate variation in sperm design or total sperm length
a) Sperm design
Random effects Estimates ± SE Z P
Aviary 0 0 1 Sampling date 0.011 ± 0.013 0.87 0.19 Fixed effects F df P Intercept 0.75 ± 0.08 Social statusa 3.38 3, 45 0.027 Dominant 0.053 ± 0.066 Subordinate-1 -0.083 ± 0.067 Subordinate-2 0.139 ± 0.066 Body mass 0.021 ± 0.036 1.21 1, 45.6 0.28 Tarsus length 0.039 ± 0.077 2.29 1, 45.2 0.14
Social status x Body massa 1.27 3, 45.1 0.30
Dominant -0.020 ± 0.060
Subordinate-1 0.075 ± 0.058
Subordinate-2 -0.039 ± 0.057
Social status x Tarsus lengtha 0.91 3, 45.3 0.44
Dominant -0.088 ± 0.122
Subordinate-1 0.131 ± 0.129
Subordinate-2 0.038 ± 0.100
b) Total sperm length
Random effects Estimates ± SE Z P
Aviary 1.03 0.15 Sampling date 0.63 0.26 Fixed effects F df P Intercept 2.12 ± 0.24 Social statusa 0.56 3, 34.4 0.64 Dominant -0.024 ± 0.23 Subordinate-1 -0.009 ± 0.24 Subordinate-2 -0.26 ± 0.23 Body mass 0.001 ± 0.14 3.45 1, 39.5 0.07 Tarsus length 0.16 ± 0.30 6.90 1, 45 0.012
Social status x Body massa 4.34 3, 44.3 0.009
Dominant 0.45 ± 0.24
Subordinate-1 0.51 ± 0.22
Subordinate-2 -0.23 ± 0.22
Social status x Tarsus lengtha 0.70 3, 43 0.56
Dominant 0.11 ± 0.48
Subordinate-1 0.67 ± .50
Subordinate-2 0.29 ± 0.39
a
Relative to subordinate-3 males. Values in bold indicate significance atα = 0.05; tests of random effects are based on Wald-Z; tarsus length and body mass were centred to allow for correct estimations of main“social status” effects
Fig. 2 Relationship between within-ejaculate variation in total sperm length and body mass (centred) for males at different social ranks before manipulating the social status. The lines represent linear regressions. These relationships are maintained after removing a potential outlier (see text for details)
length (Table 3b). Males with longer tarsi produced less variable ejaculates in terms of total sperm length after the manipulation of the social status (β ± SE = -0.427 ± 0.15, Table 3b).
Relation between within-male variance in sperm morphology and sperm performance
Before manipulating the social status, we found that the proportion of motile sperm correlated negatively with
Table 2 LMMs investigating how experimentally changing the social status affects the within-ejaculate variation in sperm design or in total sperm length
a) Sperm design
Random effects Estimates ± SE Z P
Aviary 0 0 1 Sampling date 0 0 1 Fixed effects F df P Intercept -0.16 ± 1.19 Initial statusa 0.19 3, 39 0.90 Dominant 0.15 ± 0.16 Subordinate-1 0.097 ± 0.178 Subordinate-2 0.079 ± 0.144 Final statusa 0.70 3, 39 0.56 Dominant 0.181 ± 0.191 Subordinate-1 0.011 ± 0.139 Subordinate-2 -0.048 ± 0.156 Body mass -0.013 ± 0.026 0.10 1, 39 0.75 Tarsus length 0.056 ± 0.052 1.16 1, 39 0.29
Initial status x Final statusb 0.33 9, 39 0.96
Dominant x dominant -0.274 ± 0.243 Dominant x subordinate-1 -0.150 ± 0.247 Dominant x subordinate-2 -0.006 ± 0.252 Subordinate-1 x dominant -0.104 ± 0.290 Subordinate-1 x subordinate-1 -0.109 ± 0.238 Subordinate-1 x subordinate-2 -0.134 ± 0.241 Subordinate-2 x dominant -0.133 ± 0.247 Subordinate-2 x subordinate-1 -0.075 ± 0.216 Subordinate-2 x subordinate-2 0.018 ± 0.228 b) Total sperm length
Random effects Estimates ± SE Z P
Aviary 0 0 1 Sampling date 0 0 1 Fixed effects F df P Intercept 3.548 ± 2.802 Initial statusa 0.16 3, 39 0.92 Dominant -0.310 ± 0.375 Subordinate-1 -0.517 ± 0.421 Subordinate-2 -0.091 ± 0.339 Final statusa 0.63 3, 39 0.60 Dominant -0.204 ± 0.452 Subordinate-1 -0.253 ± 0.329 Subordinate-2 -0.643 ± 0.369 Body mass -0.020 ± 0.062 0.10 1, 39 0.75 Tarsus length -0.051 ± 0.122 0.17 1, 39 0.68
Table 2 LMMs investigating how experimentally changing the social status affects the within-ejaculate variation in sperm design or in total sperm length (Continued)
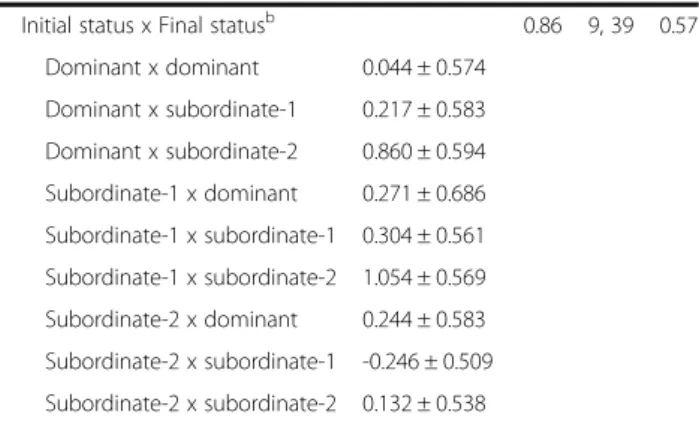
Initial status x Final statusb 0.86 9, 39 0.57
Dominant x dominant 0.044 ± 0.574 Dominant x subordinate-1 0.217 ± 0.583 Dominant x subordinate-2 0.860 ± 0.594 Subordinate-1 x dominant 0.271 ± 0.686 Subordinate-1 x subordinate-1 0.304 ± 0.561 Subordinate-1 x subordinate-2 1.054 ± 0.569 Subordinate-2 x dominant 0.244 ± 0.583 Subordinate-2 x subordinate-1 -0.246 ± 0.509 Subordinate-2 x subordinate-2 0.132 ± 0.538 a
Relative to subordinate-3 males.b
Relative to subordinate-3 x subordinate-3 males. Tests of random effects are based on Wald-Z
Table 3 LMMs investigating whether moving up or down the social ladder resulted in more or less within-ejaculate variation in sperm design or total sperm length
a) Difference (after– before) in the variation in sperm design
Random effects Estimates ± SE Z P
Aviary 0.010 ± 0.010 0.91 0.18
Sampling date 0.007 ± 0.012 0.58 0.28
Fixed effects F df P
Intercept 1.115 ± 1.061
Difference in social rank -0.010 ± 0.025 0.18 1, 50.8 0.68 Body mass (after) -0.027 ± 0.026 1.09 1, 47.3 0.30
Tarsus length -0.026 ± 0.050 0.27 1, 46 0.60
b) Difference (after– before) in the variation in total sperm length
Random effects Estimates ± SE Z P
Aviary 0.107 ± 0.103 1.04 0.15
Sampling date 0.091 ± 0.141 0.64 0.26
Fixed effects F df P
Intercept 10.258 ± 3.224
Difference in social rank -0.131 ± 0.075 3.04 1, 50.6 0.09
Body mass -0.090 ± 0.080 1.26 1, 46.8 0.27
Tarsus length -0.427 ± 0.150 8.08 1, 45.7 0.007
Values in bold indicate significance atα = 0.05; tests of random effects are based on Wald-Z
the amount of within-ejaculate variation in sperm design (β ± SE = -1.74 ± 0.59, F1,49.6= 8.56, P = 0.005; Fig. 3a) and variation in total sperm length (β ± SE = -0.39 ± 0.14, F1,57= 7.61, P = 0.008; Fig. 3b). However, sperm swim-ming ability was correlated neither with within-ejaculate variation in sperm design (β ± SE = -1.0.3 ± 0.68, F1,55.7= 2.33, P = 0.13) nor within-ejaculate variation in total sperm length (β ± SE = -0.02 ± 0.17, F1,56.8= 0.02, P = 0.90).
After manipulating the social status, we found that sperm swimming ability was negatively correlated with the amount of within-ejaculate variation in total sperm length (β ± SE = -0.63 ± 0.23, F1,49.8= 7.34, P = 0.009). However, we found no correlation between percentage of motile sperm and variation in sperm design or total sperm length (β ± SE = -0.89 ± 0.62, F1,56= 2.05, P = 0.16; β ± SE = -0.26 ± 0.26, F1,56= 0.98, P = 0.33; respectively), nor between sperm swimming ability and
within-ejaculate variation in sperm design (β ± SE = -0.17 ± 0.62, F1,54.2= 0.08, P = 0.78).
Discussion
In the present study, we found that the dominant and the most subordinate (subordinate-3) males exhibited greater within-ejaculate variation in sperm morphology and design than males at intermediate positions (subordinate-1 and subordinate-2) (Fig. 1). In addition, we found several negative correlations between sperm performance and within-ejaculate variation in sperm morphology and design (Fig. 3). Lastly, we found that heavier dominant and subordinate-1 males produced ejaculates with greater variation in sperm length com-pared to subordinate-2 and 3 males (Fig. 2). Previous studies have shown that males are able to adjust their ejaculate traits based on changes in their social environ-ment (e.g., [43–45]), and previous studies on house
Fig. 3 Relationship between the proportion of motile sperm in the ejaculate and (a) the within-ejaculate variation in sperm design or (b) the within-ejaculate variation in total sperm length before manipulating the social rank. The lines represent linear regressions
sparrows have found that males can adjust their ejacu-late quality in terms of percentage of motile sperm to changes in social status [42]. However, we did not ob-serve any changes in the levels of variation in sperm de-sign given the changes in social rank. While rapid changes in ejaculate function can be achieved by alloca-tion of resources, which serve as protecalloca-tion for the ejaculate (e.g., antioxidants [42]), or which enhance ejaculate functioning (e.g., ATP [46]), adjustments in the spermatogenetic control might be more difficult to achieve after a single spermatogenetic cycle. The exact duration of a spermatogenesis cycle is unknown for our model species, but it is worth noting that it has been found to be between 11 and 15 days in non-passerine birds [47], and possibly less in passerine birds [48].
Birkhead and colleagues [27] found high levels of within-male variation in sperm morphology in male zebra finches, and they argued that the low levels of sperm competition in zebra finches may have led to re-laxed pressures upon quality control processes in sperm-atogenesis, and thus the production of ejaculates with substantial variation in sperm morphology. While strong evidence for this hypothesis comes from interspecific comparative studies [11, 13, 14, 28], the production and maintenance of substantial intraspecific variation in sperm morphology is still not fully understood. Our re-sults are consistent with the hypothesis that dominant males, which are likely to have a privileged access to fe-males, are under relaxed sperm competition pressures, and consequently may loosen the quality control they exert on spermatogenesis, hence producing ejaculates with greater variance in sperm morphology and design.
We also found that, similarly to dominant individuals, fully subordinate males produced ejaculates with larger amounts of variance in sperm morphology and design. Although dominant and fully subordinate males share a common pattern of ejaculates variance in sperm morph-ology and design we propose that they may be subjected to different constraints or may respond to different se-lective pressures. Dominant males may produce ejacu-lates with larger variance in sperm morphology and design as a result of (i) larger sperm production de-mands to meet higher copulation rates, (ii) energy saving strategies, and/or (iii) strategic allocation of resources between somatic and reproductive tissues. On the other hand, fully subordinate males might be under energetic constraints (see below).
In Soay rams, it has been shown that dominant males have higher copulation rates throughout the reproduct-ive season, and therefore run sperm depleted and lose out in sperm competition at the end of the season [49]. In house sparrows, dominant males have higher copula-tion rates [50, 51], and may thus face higher needs for sperm production. However, sperm production is costly
[52], and increased sperm production may result in a larger number of errors [24, 25]. A larger number of production errors would be reflected in a lower propor-tion of motile sperm [25], and we indeed observed a negative correlation between within-male variation in both sperm design and total sperm length and propor-tion of motile sperm (Fig. 3). However, these correlapropor-tions were not maintained after manipulating male social sta-tus (variation in total sperm length was correlated with sperm swimming ability instead). Thus, the hypothesis that increased variation in sperm design may result from a higher sperm demand in dominant, but not subordin-ate males still, deserves experimental investigations.
Alternatively, theory predicts that males should
differentially invest in pre- vs. post-copulatory traits depending on the risk of sperm competition they face [31, 32, 35, 36]. The predictions of these models have been tested in various taxa, and evidence of such a pre- vs. post-copulatory investment trade-off exists [45, 49, 53, 54]. In house sparrows, a recent study showed that dominant males produce ejaculates of lower quality compared to ejaculates of subordinate males, while this reflects differences in the resources used to protect ejaculates from oxidative damage [42]. Birkhead and Immler [55] suggested that within-male variation in male design might result from individual differences of resource investment in spermatogenesis control, and thus the higher levels of within-male variation in sperm design by dominant males might be the result of differential investment in pre- vs. post-copulatory traits [32, 35, 36]. Strikingly, males at the lower end of the hierarchy also showed high levels of within-male variation in sperm morphology (Fig. 1). Males at the lower end of the hierarchy might face a high risk of sperm competition, and thus may be expected to reduce their ejaculate expenditure at any given copulation [36, 56]. Yet, males facing a high intensity of sperm competition are still expected to increasingly invest resources in post-copulatory traits [36], and thus they should be expected to invest in sperm production control. Alternatively, subordinate-3 males might be unable to predict the fertility status of fe-males, and thus might benefit from producing ejaculates with various sperm types (e.g., mixed strategy ejaculates [20]). Finally, males at the lower end of the hierarchy may rather be under energetic constraints due to the physio-logical costs of subordination (e.g., higher allostatic loads [57]) and/or their lower ability to outcompete other males to access resources, and thus they might by unable to in-vest in spermatogenesis control.
In house sparrows, body mass affects male dominance [58], and smaller dominant males may face higher levels of male-male competition that may translate into higher risk of sperm competition. Further, smaller males seem
to pay higher physiological costs when they are domin-ant [59]. Interestingly, we found that the lighter the males occupying higher social ranks (dominant and subordinate-1 males) were, the lower the variance in sperm morphology in the ejaculates they produced. This supports the idea that among dominant males the less competitive males may increase their investment in ejaculate quality to reduce variation in sperm morph-ology (Fig. 2), and hence increase the competitive ability of their ejaculates. However, whether slight differences in male competitiveness among higher ranking males re-sult in differences in ejaculate quality remains to be ex-perimentally tested.
Conclusion
Different evolutionary processes may explain levels of morphological variation between taxa and within taxa [60], and sperm competition seems to cause stabilizing selection that leads to lower variation in sperm design across taxa (reviewed in the introduction). However, at the intraspecific level, we suggest that in species where males face different risks of sperm competition, they may flexibly adjust their investment in gamete produc-tion resulting in differences in the levels of within-male variation in sperm morphology that better fit their risks of sperm competition. Alternatively, males may in-vest equal amounts of resources in either producing small volumes of high quality ejaculates or large volumes of lower quality ejaculates. These two alternative hypoth-eses remain to be tested to better understand how high levels of intraspecific variation in sperm morphology and design are maintained. Furthermore, repeated sam-ples of the same individuals would allow distinguishing male, between ejaculate variation from within-male, within-ejaculate variation to precisely address the various levels of variation. Lastly, experiments exploring the consequences of different levels of within-male vari-ation in sperm design under sperm competition are needed to better understand male reproductive strategies.
Methods
Individuals and sampling
We trapped a total of 60 male and 60 female house spar-rows using mist-nets in western Switzerland during the first two weeks of April 2014. From each bird, we mea-sured body mass and tarsus length, and birds were assigned to 15 mixed outdoor aviaries at the Hasli Ethological Station (University of Bern, Switzerland) ac-cording to their body weight and an initial score of badge size. Thus, aviaries had on average birds of the same body weight and males with various badge sizes. After four weeks, all the females were transferred into a separate aviary, and we took a sperm sample from each male. We then collected a second sperm sample the day
after, and a third sperm sample after 48 h from the last sample. This procedure ensured that any differences in sperm characteristics would be intrinsic differences in quality rather than differences due to depletion [49] or fresh sperm effects [61–63] (but see [64]), and only data collected after all males were manually depleted was used. Males were divided in three sampling bouts con-sisting of 5 aviaries, and each bout was processed 5 days apart.
To test the causality of the observed patterns, females were reintroduced to the aviaries and males were shuf-fled across aviaries according to their initial social rank. We maximized the number of positions that males could have gained or lost in the hierarchy (Additional file 1). Males were given three weeks to settle down the new hierarchical positions. The exact duration of spermato-genesis is unknown in house sparrows. However, sperm-atogenesis has been estimated to last between 11 and 15 days in non-passerine birds such as domestic fowls, Japanese quails and Barbary drakes [47], and a study by Bat & Maiti [48] on yellow-throated sparrows Petronia xanthocollis suggests that it may be shorter in passerine birds. We thus assumed that three weeks would cover at least one spermatogenesis cycle. At the end of these three weeks, we collected sperm samples following the same procedure as before.
Social dominance
To determine males’ hierarchical positions, we filmed a total of 13 h before the manipulation and 10 h after the manipulation in each aviary. We observed the males interacting at the feeder, which consisted in a seed dis-penser with two feeding stations, mounted on a plastic plate that was covered with a plastic mesh. Such feeder made any spilt seeds inaccessible, and thus birds had to compete for the two feeding sites at the seed dispenser. We removed the feeder 90 min before recording the vid-eos, and then reintroduced the feeder together with a GoPro camera that was located at ca. 60 cm from the feeder. Using the dyads in each aviary (before the ma-nipulation: 82 dyads per aviary on average, range 31-235; post-shuffling: 100 dyads per aviary on average, range 39-233), we estimated each male's David's score as a proxy for their social rank within each aviary [65].
Sperm morphology and sperm performance
We gently massaged the males' cloaca to obtain ejacu-lates [66] that were collected in glass capillaries. 0.25 μL of ejaculate were diluted in 40μL of preheated Dulbecco Modified Eagle Medium at 40 ° C and a video was re-corded using a Toshiba CMOS HD camera (Toshiba co., Japan) mounted on a light microscope with 10× object-ive. We used an computer automatized sperm analyser plug-in [67] for ImageJ [68] to assess the percentage of
motile sperm and mean values for VCL (curvilinear vel-ocity, total distance travelled, μm/s), VAP (average path
velocity, smoothed path using roaming average, μm/s),
VSL (straight line velocity, distance from origin to end point,μm/s), linearity (LIN: VSL ⁄ VAP, path curvature), wobble (WOB: VAP⁄ VCL, side to side movement of the sperm head, also described as the oscillation of the ac-tual trajectory about its average path), BCF (beat cross frequency, the frequency at which VCL crosses VAP, Hz), progression (PROG: average distance from origin on the average path during all frames analysed). Sperm having a VSL < 5μm/s, a VCL < 15 μm/s, or a VAP < 10 μm/s were assumed to be either moved by drift or immotile. These estimates were based on 71 ± 37 sperm tracks (mean ± SD) per ejaculate.
Sperm motility (% of motile sperm) and sperm swim-ming velocity are determinant components of male fer-tility and sperm competitive ability [69, 70]. Therefore, we assessed sperm performance as (1) the percentage of motile sperm and (2) PC1 scores from a principal com-ponent analysis (with varimax rotation) of the other seven variables plus the number of sperm cells detected by the CASA software. This axis captured 61.4% of the variance and was positively correlated with VSL, VCL, VAP, WOB and PROG (0.73 < r <0.98, P < 0.0001), negatively correlated with BCF (r = -0.79, P < 0.0001) and not correlated with LIN and the number of tracks (-0.1 < r < 0.05, P > 0.30). Hence, this first
prin-cipal component axis, hereafter referred to as “sperm
swimming ability”, described sperm swimming fast and efficiently (fewer overall movements to achieve greater progression).
A small droplet from the ejaculate was immediately smeared with 10% formalin on a glass slide. From each slide, we took photos of ten intact sperm cells using the Nikon ACT-1 v2.70 software (Nikon Corporation, Japan) with a Nikon Digital Eclipse DXM1200 camera (Nikon Corporation, Japan) mounted on a Leica DM R micro-scope (Leica Microsystems GmbH, Germany) at 400× magnification and phase contrast 2. From sperm cells, we measured the straight head, midpiece, flagellum, and total length. Several studies have shown that ten sperm are enough to capture both the ejaculate mean and CV in sperm morphology [11, 71]. S.C. did all the measure-ments blind to male identity and social status. Addition-ally, each cell was independently measured twice to assess the measurement error (estimated at 4.89% for total length, 5.16% for head length, 5.03% for flagellum length, and 3.98% for midpiece length using variance component analyses), and the average of these two mea-surements was used for further analyses.
To summarize sperm morphological design, we per-formed a principal component analysis using sperm head, midpiece, and flagellum length, and extracted the
first component. The percentage of variance explained by PC1 was 52.3%. This PC1 was positively correlated with midpiece length (r = 0.84, P < 0.0001) and flagellum length (r = 0.83, P <0.0001) and negatively correlated with head length (r = -0.40, P < 0.0001). Thus, a positive score along PC1, hereafter referred to as“sperm design”, described a spermatozoon with a long midpiece and a long flagellum, but a relatively short head (and vice-versa for negative scores). From each male, we then cal-culated the standard deviation for both sperm design (PC1 scores) and total sperm length. We chose to keep total sperm length apart, because this sperm trait has historically been, and still is, the main focus of research (e.g., [9, 30, 72, 73]).
Statistical analyses
We used linear mixed models (LMMs) to test our hy-potheses. In a first set of statistical models we modelled the standard deviation in sperm design or in total sperm length as a function of the social status, while including body mass and tarsus length (both centred on their social-status means) as covariates.
After we experimentally manipulated the social status of males, we ran a second set of similar models with standard deviation in sperm design or in total sperm length as the dependent variables, and both the initial and final social rank, as well as their interaction as ex-planatory variables. These latter models allowed us to account for potential effects of the initial social status on the plasticity in variation in sperm design and total length. The models also included tarsus length and body mass as covariates.
To maximally exploit the information contained in our dataset, we also ran a third set of models, encoding the amplitude of the difference between the initial and the final social rank as a continuous variable ranging from -3 to +3. It is to be noted that this encoding ignores the initial social status, and a similar amplitude, for instance -2, may be achieved by an initially dominant male be-coming a subordinate-2 or by an initially subordinate-1 becoming a subordinate-3. However, the virtue of this
coding is to account for the “social distance” moved up
or down by each individual. In these models, we used the difference, after minus before the change in status, in the variation in sperm design or in total sperm length as the dependent variables. The models thus explore whether moving upwards or downwards the social lad-der resulted in more or less within-ejaculate variation in sperm morphology. Models included body mass after manipulation and tarsus length as covariates.
Finally, to test the relationship between within-male variance in sperm morphology (design and total length) and sperm performance, we modelled the proportion of motile sperm and sperm swimming ability as a function
of the variation in sperm design on the one hand, and the variation in total sperm length on the other hand both before and after social status was experimentally changed.
The proportion of motile sperm was logit-transformed to match normality. All models included the aviary and the sampling date as random factors, and models were
estimated using a restricted maximum likelihood
method for parameter estimation and a Kenward-Roger approximation of fixed effects degrees of freedom. Tests of fixed effects were based on SAS Type-II tests of hy-pothesis. We did not apply model selection to avoid in-flating the type I error [74]. All the analyses were performed using ®SAS 9.4. The dataset and the scripts of the statistical analyses are provided as Additional files 2 and 3.
Animal ethics
Animal manipulations were performed as quickly as pos-sible to minimise stress. We recorded any injuries or anomalous behaviours that could indicate excessive pain or stress and would require euthanizing the animal ac-cording to our guideline. The veterinary office of the Canton Bern, Switzerland, after supervision and approval by the Cantonal ethical committee, authorized the
ex-perimental setup and detention conditions under
licenses n° BE41/12 and WTH/g-525/14.
Additional files
Additional file 1: David’s scores used as proxies for social rank. (XLSX 39 kb) Additional file 2: Explicit variable names are to be found in comments. (XLSX 48 kb)
Additional file 3: Script of the statistical analyses run with SAS. (TXT 8 kb)
Acknowledgements
We are very grateful to the Laboratory of Behavioural Ecology at the university of Bern for providing us with all the facilities to run the experiment, as well as all the members of the lab who supported us during the field season. We are also grateful to all the farmers that allowed us to catch birds in their properties. Finally, this study was supported by a grant from the Swiss National Science Foundation n° PP00P3_139011 to FH.
Availability of data and materials
The dataset supporting the results is available as supplementary material.
Authors’ contributions
FH & ARM designed the study. ARM, MM & SC conducted the experiment, and collected the data. ARM analysed the sperm videos. SC measured all the sperm cells. FH performed the statistical analyses. ARM & FH wrote the manuscript. All authors read and approved the final manuscript.
Competing interests
The authors declare that they have no competing interests.
Received: 30 September 2016 Accepted: 15 February 2017
References
1. Pitnick S, Hosken DJ, Birkhead TR. Sperm morphological diversity. In: Birkhead TR, Hosken DJ, Pitnick S, editors. Sperm biology: An evolutionary perspective. Oxford: Academic; 2009. p. 71–149.
2. Pitnick S, Spicer GS, Markow TA. How long is a giant sperm? Nature. 1995;375:109.
3. Balshine S, Leach BJ, Neat F, Werner NY, Montgomerie R. Sperm size of African cichlids in relation to sperm competition. Behav Ecol. 2001;12:726–31. 4. Briskie JV, Montgomerie R. Sperm size and sperm competition in birds. Proc
R Soc B. 1992;247:89–95.
5. Morrow EH, Gage MJG. The evolution of sperm length in moths. Proc R Soc Lond B. 2000;267:307–13.
6. LaMunyon CW, Ward SR. Evolution of sperm size in nematodes: sperm competition favours larger sperm. Proc R Soc Lond B. 1999;266:263–67. 7. Byrne PG, Simmons LW, Roberts JD. Sperm competition and the evolution
of gamete morphology in frogs. Proc R Soc B. 2003;270:2079–86. 8. Breed WG, Taylor J. Body mass, testes mass, and sperm size in murine
rodents. J Mammal. 2000;81:758–68.
9. Gomendio M, Roldan ERS. Sperm competition influences sperm size in mammals. Proc R Soc B. 1991;243:181–85.
10. Ward PI. Intraspecific variation in sperm size characters. Heredity. 1998;80:655–9.
11. Kleven O, Laskemoen T, Fossøy F, Robertson RJ, Lifjeld JT. Intraspecific variation in sperm length is negatively related to sperm competition in passerine birds. Evolution. 2008;62:494–99.
12. Schulte-Hostedde AI, Millar JS. Intraspecific variation of testis size and sperm length in the yellow-pine chipmunk (Tamias amoenus): implications for sperm competition and reproductive success. Behav Ecol Sociobiol. 2004;55:272–77.
13. Calhim S, Immler S, Birkhead TR. Postcopulatory sexual selection is associated with reduced variation in sperm morphology. PLoS One. 2007;2:e413.
14. Immler S, Calhim S, Birkhead TR. Increased postcopulatory sexual selection reduces the intramale variation in sperm design. Evolution. 2008;62:1538–43. 15. Malo AF, Gomendio M, Garde J, Lang-Lenton B, Soler AJ, Roldan ERS. Sperm
design and sperm function. Biol Lett. 2006;2:246–49.
16. Bernasconi G, Hellriegel B. Fertilization competence and sperm size variation in sperm-heteromorphic insects. Evol Ecol. 2005;19:45–54.
17. Joly D, Korol A, Nevo E. Sperm size evolution in Drosophila: inter- and intraspecific analysis. In: Capy P, Gibert P, Boussy I, editors. Drosophila melanogaster, Drosophila simulans: so similar, so different. Dordrecht: Springer; 2004. p. 233–44.
18. Harris WE, Moore AJ, Moore PJ. Variation in sperm size within and between ejaculates in a cockroach. Funct Ecol. 2007;21:598–602.
19. Morrow EH, Gage MJG. Consistent significant variation between individual males in spermatozoal morphometry. J Zool. 2001;254:147–53.
20. Helfenstein F, Podevin M, Richner H. Sperm morphology, swimming velocity, and longevity in the house sparrow Passer domesticus. Behav Ecol Sociobiol. 2010;64:557–65.
21. Parker GA, Begon ME. Sperm competition games: sperm size and number under gametic control. Proc R Soc Lond B. 1993;253:255–62.
22. Parker GA. Sperm competition games: sperm size and number under adult control. Proc R Soc B. 1993;253:245–54.
23. Eddy EM. Male germ cell gene expression. Recent Prog Horm Res. 2002;57:103–28.
24. Cohen J. Correlation between sperm "redundancy" and chiasma frequency. Nature. 1967;215:862–63.
25. Cohen J. Cross-overs, sperm redundancy and their close association. Heredity. 1973;31:408–13.
26. Baker RR, Bellis MA. "Kamikaze" sperm in mammals? Anim Behav. 1988;36:936–39.
27. Birkhead TR, Pellatt EJ, Brekke P, Yeates R, Castillo-Juarez H. Genetic effects on sperm design in the zebra finch. Nature. 2005;434:383–87.
28. Lüpold S, Linz GM, Birkhead TR. Sperm design and variation in the New World blackbirds (Icteridae). Behav Ecol Sociobiol. 2009;63:899–909. 29. Lüpold S, Wistuba J, Damm OS, Rivers JW, Birkhead TR. Sperm competition
leads to functional adaptations in avian testes to maximize sperm quantity and quality. Reproduction. 2011;141:595–605.
30. Hogner S, Laskemoen T, Lifjeld JT, Pavel V, Chutný B, García J, Eybert M-C, Matsyna E, Johnsen A. Rapid sperm evolution in the bluethroat (Luscinia svecica) subspecies complex. Behav Ecol Sociobiol. 2013;67:1205–17.
31. Parker GA. Sperm competition and the evolution of ejaculates: towards a theory base. In: Birkhead TR, Møller AP, editors. Sperm competition and sexual selection. San Diego: Academic; 1998. p. 3–54.
32. Parker GA, Pizzari T. Sperm competition and ejaculate economics. Biol Rev. 2010;85:897–934.
33. Fitzpatrick JL, Lüpold S. Sexual selection and the evolution of sperm quality. Mol Hum Reprod. 2014;20:1180–89.
34. Snook RR. Sperm in competition: not playing by the numbers. Trends Ecol Evol. 2005;20:46–53.
35. Tazzyman SJ, Pizzari T, Seymour RM, Pomiankowski A. The evolution of continuous variation in ejaculate expenditure strategy. Am Nat. 2009;174:E71–82.
36. Parker GA, Lessells CM, Simmons LW. Sperm competition games: a general model for precopulatory male-male competition. Evolution. 2013;67:95–109.
37. Møller AP. House sparrow, Passer domesticus, communal displays. Anim Behav. 1987;35:203–10.
38. Møller AP, Birkhead TR. The evolution of plumage brightness in birds is related to extrapair paternity. Evolution. 1994;48:1089–100.
39. Wetton JH, Parkin DT. An association between fertility and cuckoldry in the house sparrow passer domesticus. Proc R Soc B. 1991;245:227–33. 40. Wetton JH, Burke T, Parkin DT, Cairns E. Single-Locus DNA fingerprinting
reveals that male reproductive success increases with age through extra-pair paternity in the house sparrow (Passer domesticus). Proc R Soc Lond B. 1995;260:91–8.
41. Anderson TR. Biology of the ubiquitous House sparrow: from genes to populations. New York: Oxford University Press; 2006.
42. Rojas Mora A. Oxidative stress in sperm competition games: Experimental tests of the soma vs. germline allocation trade-off in wild House sparrows Passer domesticus. Neuchâtel: PhD Thesis; 2016.
43. Cornwallis CK, Birkhead TR. Changes in sperm quality and numbers in response to experimental manipulation of male social status and female attractiveness. Am Nat. 2007;170:758–70.
44. Immler S, Pryke SR, Birkhead TR, Griffith SC. Pronounced within-individual plasticity in sperm morphometry across social environments. Evolution. 2010;64:1634–43.
45. Rudolfsen G, Figenschou L, Folstad I, Tveiten H, Figenschou M. Rapid adjustments of sperm characteristics in relation to social status. Proc R Soc B. 2006;273:325–32.
46. Christen R, Gatti J-L, Billard R. Trout sperm motility. Eur J Biochem. 1987;166:667–71.
47. Jones RC, Lin M. Spermatogenesis in birds. Oxf Rev Reprod Biol. 1993;15:233–64.
48. Bhat G, Maiti BR. Study of spermatogenesis in a wild bird, the yellow-throated sparrow (Petronia xanthocollis Burton). Zool Anz. 1988;221:430–34. 49. Preston BT, Stevenson IR, Pemberton JM, Wilson K. Dominant rams lose out
by sperm depletion. Nature. 2001;409:681–82.
50. Møller AP. Badge size in the house sparrow Passer domesticus: effects of intra- and intersexual selection. Behav Ecol Sociobiol. 1988;22:373–78. 51. Møller AP. Sexual behavior is related to badge size in the house sparrow
Passer domesticus. Behav Ecol Sociobiol. 1990;27:23–9.
52. Van Voorhies WA. Production of sperm reduces nematode lifespan. Nature. 1992;360:456–58.
53. Thomas ML, Simmons LW. Male dominance influences pheromone expression, ejaculate quality, and fertilization success in the Australian field cricket, Teleogryllus oceanicus. Behav Ecol. 2009;20:1118–24.
54. Evans JP. Quantitative genetic evidence that males trade attractiveness for ejaculate quality in guppies. Proc R Soc B. 2010;277:3195–201.
55. Birkhead TR, Immler S. Making sperm: design, quality control and sperm competition. Soc Reprod Fertil Suppl. 2007;65:175–81.
56. Parker GA, Ball MA, Stockley P, Gage MJG. Sperm competition games: individual assessment of sperm competition intensity by group spawners. Proc R Soc B. 1996;263:1291–97.
57. Goymann W, Wingfield JC. Allostatic load, social status and stress hormones: the costs of social status matter. Anim Behav. 2004;67:591–602.
58. Møller AP. Variation in badge size in male house sparrows Passer domesticus: evidence for status signalling. Anim Behav. 1987;35:1637–44.
59. Lindström KM, Hasselquist D, Wikelski M. House sparrows (Passer domesticus) adjust their social status position to their physiological costs. Horm Behav. 2005;48:311–20.
60. Uyeda JC, Hansen TF, Arnold SJ, Pienaar J. The million-year wait for macroevolutionary bursts. Proc Natl Acad Sci. 2011;108:15908–13. 61. Siva-Jothy MT. The young sperm gambit. Ecol Lett. 2000;3:172–74. 62. Pizzari T, Dean R, Pacey A, Moore H, Bonsall MB. The evolutionary ecology
of pre- and post-meiotic sperm senescence. Trends Ecol Evol. 2008;23:131. 63. Wesseling C, Fasel NJ, Richner H, Helfenstein F. Modification of sperm
quality after sexual abstinence in the Seba's short tailed bat (Carollia perspicillata). J Exp Biol. 2016;219:1363–68.
64. Firman RC, Young FJ, Rowe DC, Duong HT, Gasparini C. Sexual rest and post-meiotic sperm ageing in house mice. J Evol Biol. 2015;28:1373–82. 65. Gammell MP, De Vries H, Jennings DJ, Carlin CM, Hayden TJ. David's score: a
more appropriate dominance ranking method than Clutton-Brock et al'.s index. Anim Behav. 2003;66:601–05.
66. Wolfson A. The cloacal protuberance - a means for determining breeding condition in live male passerines. Bird Band. 1952;23:159–65.
67. Wilson-Leedy JG, Ingermann RL. Development of a novel CASA system based on open source software for characterization of zebrafish sperm motility parameters. Theriogenology. 2007;67:661–72.
68. Schneider CA, Rasband WS, Eliceiri KW. NIH Image to ImageJ: 25 years of image analysis. Nat Meth. 2012;9:671–75.
69. Pizzari T, Worley K, Burke T, Froman D. Sperm competition dynamics: ejaculate fertilising efficiency changes differentially with time. BMC Evol Biol. 2008;8:332.
70. Pizzari T, Parker GA. Sperm competition and sperm phenotype. In: Birkhead TR, Hosken DJ, Pitnick S, editors. Sperm biology: An evolutionary perspective. San Diego: Academic; 2009. p. 207–45. 71. Laskemoen T, Kleven O, Fossoy F, Lifjeld JT. Intraspecific variation in sperm
length in two passerine species, the Bluethroat Luscinia svecica and the Willow Warbler Phylloscopus trochilus. Ornis Fennica. 2007;84:131–39. 72. Tourmente M, Gomendio M, Roldan E. Sperm competition and the
evolution of sperm design in mammals. BMC Evol Biol. 2011;11:12. 73. Fitzpatrick JL, Garcia-Gonzalez F, Evans JP. Linking sperm length and
velocity: the importance of intramale variation. Biol Lett. 2010;6:797–99. 74. Whittingham MJ, Stephens PA, Bradbury RB, Freckleton RP. Why do we
still use stepwise modelling in ecology and behaviour? J Anim Ecol. 2006;75:1182–89.
• We accept pre-submission inquiries
• Our selector tool helps you to find the most relevant journal • We provide round the clock customer support
• Convenient online submission • Thorough peer review
• Inclusion in PubMed and all major indexing services • Maximum visibility for your research
Submit your manuscript at www.biomedcentral.com/submit