Economic Thresholds
c.
W. HOY,! C. E. McCULLOCH,2 A.J.
SAWYER,3A. M. SHELTON, ANDC. A. SHOEMAKER'
Department of Entomology, Cornell University, New York State Agricultural Experiment Station,
Geneva, New York14456
Environ.Entomol.19(5): 1578-1596 (1990)
ABSTRACT A simulation model was constructed to examine the effects of intra plant spatial dynamics of the lepidopteran pest complex of cabbage on direct damage to the marketable parts of the plant. Diurnal fluctuations in microclimate for different parts of the crop canopy were simulated with sine functions. Larval development rates for each species were simulated with logisticfunctions of temperature, the development process with time-varying distributed delays, and feeding rates with exponential functions of temperature and larval age. Larval transition probabilities within the crop canopy were modeled with either constants or definite integrals of the Beta probability density function, the shape parameters of which were modeled as functions of temperature. The model provided a good fit to data on changes in intraplant distribution of these larvae and intraplant distribution of feeding damage. Eval-uation of model predictions suggeststhat a threshold population density used for management decisions should not be static, but should be a complex function of species, larval age distribution, and forecast temperatures. A model like the one presented here could serve as that complex function.
KEYWORDS Insecta, simulation, model, pest management
CURRENTLY,many pest management programs rely on economic thresholds to determine when pest populations must be reduced to prevent econom-ically important damage to a crop. The economic threshold is a simple model, which predicts that a certain amount of damage to the marketable parts of the crop will occur within a given period of time. Economic thresholds developed in the past (Stern 1973, Poston et al. 1983, Pedigo et al. 1986, Onstad 1987), however, did not take into account the spatial structure of multiple pests and their injury within the crop canopy . We hypothesize that intraplant movement of insect pests profoundly af-fects the amount of damage they cause on the marketable parts of their host plant. Herein we describe the construction and analysis of a simu-lation model we have used to explore the influence of intraplant spatial dynamics of insect pests on damage to the marketable parts of a crop. New techniques were developed to model intraplant movement as a function of microclimatic condi-tions within the crop canopy. Spatial dynamics of some species are influenced by the host plant (Hoy
ITo whomreprintrequestsshouldbe addressed.Currentad-dress:Departmentof Entomology,Ohio AgriculturalResearch and DevelopmentCenter,The OhioStateUniversity,Wooster, Ohio44691-6900. •BiometricsUnit,CornellUniversity,Ithaca,N.Y.14853. 'USDA-ARS,PlantProtectionResearchUnit,U.S.Plant,Soil &NutritionLaboratory,Ithaca,N.Y.14853. •DepartmentofCivilandEnvironmentalEngineering,Cornell University,Ithaca,N.Y.14853.
&Shelton 1987), and this interaction was also cap-tured in the model's mathematical form.
The system we studied includes fresh market cabbage and its lepidopteran pest complex: dia-mondback moth, Plutella xylostella L.; cabbage looper, Trichoplusia ni (Hubner); and imported cabbageworm, Artogeia rapae L. The larvae of
each pest damage the crop by chewing holes in the leaves. The marketable parts of the cabbage crop, the head and four surrounding wrapper leaves, and the unmarketable parts, the remaining frame leaves, are vulnerable to this feeding damage. Therefore, the leaves that are fed upon, marketable or un-marketable, largely determine the economic im-portance of the damage.
Threshold population densities have been eval-uated and used to manage cabbage lepidopteran pests. The thresholds proposed for fresh market cabbage, and for most crops, have typically been established by treating research plots at different population densities to estimate the maximum pop-ulation density at which 5% (or some other arbi-trary percentage) of cabbage heads will be ren-dered unmarketable. They are often called action thresholds, because the required economic analysis for a true economic threshold is usually impossible to perform. In practice, however, even the damage resulting from using a given action threshold can vary considerably. Leibee et al. (1984) tested sev-eral thresholds as well as weekly insecticide appli-cations and found that all treatment regimes gave satisfactory results in two locations, while only the OO46-225X/90/1578-1596$02.00/0 © 1990EntomologicalSocietyof America
October 1990 HoY ET AL.: INTRAPLANTMOVEMENTANDECONOMICTHRESHOLDS 1579 weekly application provided >95% marketable
heads (rated according to Greene et al. 1969) at two other locations. A threshold of one new feeding hole per plant, based on the results of Chalfant et al. (1979), yielded results as poor as 39.6% mar-ketable heads in a subsequent test (Workman et al. 1980). Other examples in which results of using either calendar schedules or proposed thresholds vary in different locations or at different times have been reported as well (Sears et al. 1983, Shelton et al. 1983, Morisak et al. 1984, Kirby & Slosser 1984, Cartwright et al. 1987). These varying results imply that growers require a more reliable means of pre-dicting damage to their crop.
We have proceeded by first validating our mod-el, comparing predictions with observed data, to determine whether the predictions are accurate enough to be useful for our analysis. Second, we have examined our more complex model's predic-tions of damage resulting from a static threshold population density when factors affecting intra-plant spatial dynamics are varied. Results suggest that a useful model that predicts damage to the marketable parts of cabbage plants must incorpo-rate intra plant spatial dynamics of the lepidopteran pest complex. Finally, to gain insight into the po-tential for use of our model as a management tool, we analyzed the sensitivity of model predictions to changes in the values of parameters and variables input by the user. Before discussing these analyses, we describe the model and how parameters were estimated.
Model Description
Simulation modeling involves forecasting changes in the value of state variables, which represent the state of a system, over time. The system described by this model includes populations of P. xylostella, A. rapae, and T. ni, a cabbage crop, and the in-fluence of weather conditions. The cabbage crop is assumed to consist of mature or nearly mature (growth stage 8 or 9, Andaloro et al. 1983b) plants of uniform size. State variables in the model are.
N'kj(t), the average number N per plant of larvae
of species s and age subclass
k
on stratum j at time t (in days),where
s = 1, 2, 3 representing P. xylostella, A. rapae,
and T.ni, respectively,
k
1, 2, ... , 20 representing subclasses in the development model and approximate age groups,j 1, 2, ... , 5 representing the head, four sur-rounding wrapper leaves, upper frame leaves, mid frame leaves, and lower frame leaves, re-spectively.
Thus, the entire crop is represented by five vertical strata, and the entire population of each species is
represented by an average number and age struc-ture per plant on each of the five strata. Although distribution of larvae and their damage between plants is quite important, it goes beyond the scope of this study. An auxiliary variable,
Ej = average accumulated area of feeding (cm2) on stratum j,
is calculated to estimate damage to the crop. Below we describe how the state variables change as larval development and movement are simulat-ed, and how the auxiliary variable is calculated as the state variables change. We have observed that mortality due to naturally occurring agents over a 7-d period in commercial cabbage fields is either negligible or too rare to be a useful addition to the model. Diurnal temperature fluctuations in each of the different plant strata are incorporated as external variables. A list of variables with defini-tions and parameter estimates is given in Table 1. Inputs, each of the submodels, and output are de-scribed below for the model when run on a Macin-tosh computer (Apple Computer, Cupertino, Cal-if.).
Model Inputs. Initial values for the state vari-ables and the microclimate sub model must be input by the user. These include a weather forecast, high and low temperatures and hours of sunshine for the next 7 d, and the average number per plant of each species on each stratum, obtained by sampling a cabbage field. Initial age distribution is estab-lished for A. rapae and T. ni by providing separate averages for eggs, small (first and second instars), and large (third, fourth, and fifth instars) larvae. The initial age distribution is further defined by identifying the proportion of larvae, over the entire plant, estimated to be in each of the five instars. These initial values of state variables are input in-teractively in the screen depicted in Fig. I (the weather forecast is input similarly).
Microclimate. A cabbage plant offers insects a variety of microhabitats, from exposed and sunny leaves to leaves in almost perpetual shade; there-fore, temperature is modeled separately for each of the plant strata. Temperature (0C) in each stra-tum j at a given time t (days), tempj(t), is modeled with sine functions, to simulate diurnal fluctuation in temperature, according to,
temp/t) =avtemp/t)
+
ampj(t)sine(t271") (1)where
avtempj(t) the day's average ambient air
tem-perature in stratum j
[=(maximum temperature
+
mini-mum temperature)/2],ampj(t) half of the day's temperature range
in stratum j
[=(maximum temperature - mini-mum temperature)/2],
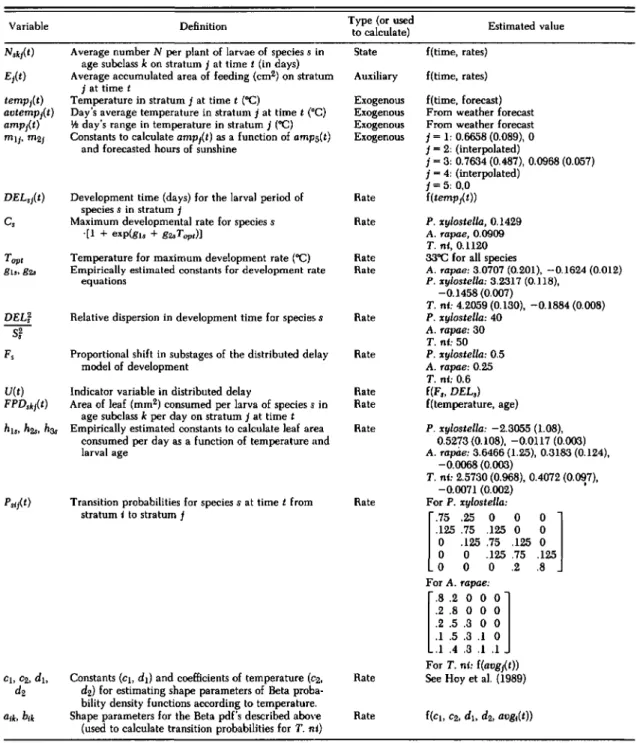
Table 1. List of variables used in a model to predict feeding damage by Lepidoptera on cabbage. For parameter values eSlimaled from our dala, estimates (and standard errors in parentheses) are given
Variable Definition Type (or used Estimated value
to calculate)
N'kit) Average number N per plant of larvae of species s in State f(time, rates) age subclass k on stratum j at time t (in days)
Eit) Average accumulated area of feeding (cm2) on stratum Auxiliary f(time, rates)
j at time t
temPI(t) Temperature in stratum j at time t ("C) Exogenous f(time, forecast)
avtemPI(t) Day's average temperature in stratum j at time t eC) Exogenous From weather forecast
amPit) \-!! day's range in temperature in stratum j ("C) Exogenous From weather forecast
mlj. m2j Constants to calculate ampj(t) as a function of amps(t) Exogenous j =1: 0.6658 (0.089), 0
and forecasted hours of sunshine j =2: (interpolated)
j =3: 0.7634 (0.487),0.0968 (0.057)
j =4: (interpolated)
j= 5: 0.0
DEL,it) Development time (days) for the larval period of Rate f(temPI(t))
species s in stratum j
C, Maximum developmental rate for species s Rate P. xylostella, 0.1429
·[1 +eXP(gls+g2.0T"",)] A. rapae, 0.0909
T. nt, 0.1120 Topt Temperature for maximum development rate ("C) Rate 33"C for all species
gls,82.0 Empirically estimated constants for development rate Rate A. rapae: 3.0707 (0.201), -0.1624 (0.012)
equations P. xylostella: 3.2317 (0.118),
-0.1458 (0.007)
T. nt: 4.2059 (0.130), -0.1884 (0.008)
DEL; Relative dispersion in development time for species s Rate P. xylostella: 40
T
A. rapae: 30T. nt: 50
Fs Proportional shift in substages of the distributed delay Rate P. xylostella: 0.5
model of development A. rapae: 0.25
T. nt: 0.6 U(t) Indicator variable in distributed delay Rate f(F" DEL,)
FPD,kj(t) Area of leaf (mm2) consumed per larva of species s in Rate f(temperature, age) age subclass k per day on stratum j at time t
his, hz" h:J.s Empirically estimated constants to calculate leaf area Rate P. xylostella: -2.3055 (1.08), consumed per day as a function of temperature and 0.5273 (0.108), -0.0117 (0.003)
larval age A. rapite: 3.6466 (1.25), 0.3183 (0.124),
-0.0068 (0.003)
T. nt: 2.5730 (0.968), 0.4072 (0.097),
-0.0071 (0.002) •
P,4t) Transition probabilities for species s at time t from Rate For P. xylostella: stratum t to stratum j
[75~ 00
.125 .75 .125 00]
0o
.125 .75 .125 0o
0 .125 .75 .125o
0 0 .2 .8 For A. rapae:[' 20 00]
.2.8 0 0 0 .2 .5 .3 0 0 .1 .5 .3 .1 0 .1 .4 .3 .1 .1 For T. nt: f(avgj(t))CI,C2,d], Constants (c], dl)and coefficients of temperature (C2, Rate See Hoy et al. (1989)
d2 d2) for estimating shape parameters of Beta
proba-bility density functions according to temperature.
ajk, bjk Shape parameters for the Beta pdf's described above Rate fCc], C2,d], d2, avgj(t))
(used to calculate transition probabilities for T. nt)
Thus, to simulate different microclimates in the different strata, we require a separate temperature average and range for each of the strata. These averages and ranges were simulated by a simple model based on energy balance relationships in a crop canopy.
Average temperature in each stratum is modeled as the forecast average ambient air temperature multiplied by a constant. The constant for the lower frame leaves was estimated as 1.0 (i.e., the tem-perature in the shaded lower frame is close to the
temperature that would be measured in a standard weather recording shelter). The constants for the head and upper frame were modeled as the av-erage ratio of temperature measurements (de-scribed below) in those strata to measurements tak-en in the lower frame (1.03, 1.04, 1.05, 1.025 for the head, wrapper, upper frame, and midframe leaves, respectively). For the wrapper leaves and midframe leaves (j =2 and 4) where temperature measurements were not available, average tem-perature is estimated by linear interpolation
be-October 1990 Hoy ET AL.: INTRAPLANTMOVEMENTAND ECONOMICTHRESHOLDS 1581 r- ••
•.
File
iO
Edit
Inputs
.,
Fill in the bOXl'8with the nqu:irl'd numbl'u:
I~~
li~~Cli~~
II~
~
It;;j
inl'r~
°r~
li~cr~
8Ii~~81
A""PIo'~
J
J) /)'
.
j
j
jj.,~
DB
leW
eL
Hl'edm~
8";11I
[!J C!J
8~11I
[!]
wrepPl'rl 0
II
0
I
0
II
0
II
0
I
0
II
0
I
UppnI
0
II
0
I
=0=11
0
II
0
I
0
II
0
I
l1idI
0
II
0
I
=0
:::::;11
0
II
0.25
I
0
II
1.20
I
Lo~rl
0
II
0
1_0
---,II
0
II
1.00
I
0.02
II
0.30
I
(
RUN
) (
STRRT OUER
tt
'---Fig.1. Computer screen displaying the interactive input table for initializing a model to predict feeding damage by Lepidoptera on cabbage.
tween averages for the other strata (j = 1, 3 and 3,5, respectively).
Like average temperature, the temperature range is assumed to be the same in the lower frame leaves as in the forecast for ambient conditions. Around the cabbage head, the observed temperature range was consistently narrower than it was under the lower frame leaves. The head has considerable mass and moderates the temperature around it. There-fore, the temperature range in stratum 1, the head, is modeled as a proportion of the range in the lower frame. The temperature range in the upper frame is modeled as the range in the lower frame plus an effect of sunshine,
amp3(t) =amp5(t)
+
m'3+
m2:). (forecasted hours of
sunshine on day t) (2)
where, ml and m2 are empirically estimated con-stants. The upper frame leaves absorb radiant heat energy from sunlight, resulting in higher daytime temperatures than on the lower leaves; they radiate heat more easily at night than the lower leaves, because they are exposed to the sky, resulting in lower night temperatures in this part of the canopy.
Measurements were not available for the tem-perature range in the wrapper and midframe leaves. Temperature ranges in these strata were modeled similarly to the upper frame leaves, but the effect
of sunshine was reduced to two-thirds that of the upper frame for the wrapper leaves, and one-third that of the upper frame for the midframe leaves, because these strata receive less sunlight.
To estimate the differences in average temper-ature and amplitude between strata, temperature was monitored on the undersides of the leaves in three of the strata (the head, upper frame leaves, and lower frame leaves) from 13 August to 23 October 1986 in research plots in Geneva, N. Y., as described in Hoy et al. (1989). Hourly temperature averages from 2-min samples were recorded. Daily total solar radiation and ambient air temperatures were measured at the New York State Agricultural Experiment Station, weather station, Geneva, N.Y. Daily total solar radiation (caljcm") was divided by an estimate of average solar radiation per hour for Geneva, N. Y., during the time the measure-ments were taken, to approximate hours of sun-shine. Estimated coefficients for the regression de-scribed above and for each of the constants are given in Table 1 (SAS Institute 1982). Quadratic and higher order polynomial coefficients for solar radiation were not significantly different from zero (P
=
0.1228, n=
43), indicating that the relation-ship could be described as linear. T-statistics on slope coefficients in these regression analyses also indicated that the linear effects of solar radiation on amplitude in the upper frame leaves weresig-(3)
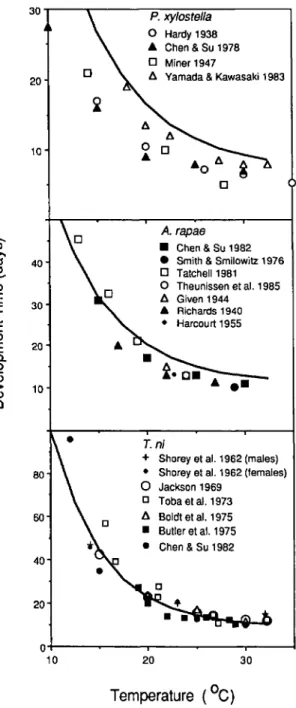
Fig. 2. Calculated development times for P.
xylo-stella, A.rapae, andT. ni larvae on cabbage (solid lines) compared with development times previously reported in the literature at specific temperatures.
30 A. rapae
• Chen&Su 1982 • Smith&Smilowitz1976
o
Tatchell1981o
Theunissenet al.1985 1:1 Given1944 .•. Richards1940 • Harcourt1955 P. xylosteJ/ao
Hardy1938 .•. Chen&Su 1978o
Miner19471:1 Yamada&Kawasaki1983
20
T.ni
+ Shoreyet al.1962(males) • Shoreyet al. 1962(females)
o
Jackson1969 [] Tobaat al.1973 1:1 Boldtat al.1975 • Butleret al. 1975 • Chen&Su 1982o
...
Temperature
(Oe)
oo
10 20 40 80 60 10 20 30 40 10 20 30 Ul >. ctl '0-
Q) E i=E
Q) Ea.
o Q) > Q) Clalgorithm shifts a proportion of the contents of each subclass to the next subclass at certain time steps. The number of time steps before each shift occurs and the proportion of the contents of each subclass shifted are determined by the average develop-ment time or delay, and the estimated dispersion in development times. The controlled dispersion model was used because fewer subclasses were re-quired to represent the observed distribution of development times adequately (with 20 subclasses where
DEL'j(t) average development time (days) for the larval period in species s, on stra-tum j, at time t,
C, (maximum development rate)'(l
+
eBb+R2s Top"
Top. temperature at which maximum de-velopment rate occurs,
Tj(t) temperature on stratum j, at time t,
if tempj(t) :5 Top"
2 Top. - tempj(t), if tempj(t) > Top., gt., g2> empirically estimated constants for
species s.
This model was used because it fits development rate data for T.ni well (Butler et a1. 1976), and it could easily be fit to data for the other species using standard nonlinear regression packages. Because the relationship between temperature and devel-opment time of P. xylostella and A. rapae is qual-itatively similar to that ofT.ni,the function above was expected to provide a good fit to the data for these species as well. The gls and g2>' from equation 3, were estimated by nonlinear regression (SAS Institute 1982) with the Marquardt computation method from data collected by A.M.S. and P. B. Baker (unpublished data) (Table 1). Minimum de-velopment times (days) for each species were es-timated from data in the literature to be 8 d for P. xylostella, 12 d for A. rapae, and 9 d for T. ni, all at 33°C. The inverse of these minimum devel-opment times was used to approximate each of the C, (equation 3) in the estimations.
Development times calculated using the algo-rithm with parameters calculated from A.M.S. and P. B. Baker's data were very similar to those re-ported in the literature for A. rapae and T. ni, whereas development times for P. xylostella were slightly longer than those previously reported (Fig. 2). The parameter estimates obtained from A.M.S. and P. B. Baker's unpublished data were used be-cause the food source in their study, excised cab-bage leaves, was most similar to the food source of the population being modeled. Because food source can affect larval development rate (Shorey et a1. 1962, Jones & Ives 1979, Wolfson 1982), use of these data, rather than data from the literature, should provide more accurate results.
Dispersion in development times was simulated by a time-varying distributed delay (Manetsch 1976) with controlled dispersion (Goudriaan 1973). This nificant (P <0.05, n =43). In addition, the effect of solar radiation on temperatures in the head was not significant (P =0.2733, n =43).
Development Rates. Average larval develop-ment rates are calculated as a function of temper-ature for each species according to the algorithm proposed by Stinner et al. (1974),
1 C,
October 1990 Hoy ET AL.:INTRAPLANTMOVEMENTANDECONOMICTHRESHOLDS 1583
where
N'k/t
+
At) =N'kt(t)+
U(t)F,·[N'lk_Jl/t) - N'k/t)], (4)
feeding area (mm2) per day per larva of species s in subclass k on stratum j at time t,
day's average temperature in stratum j at time t,
average proportion of larval de-velopment completed by sub-class k
(2~- :0)'
empirical constants for species s.
avtemp/t)
where
1 If each subclass is assumed to represent 20 of a larva's development time, average feeding rate for each subclass in the distributed delay is calculated
( k
1) .
at the midpoint of the class, agek = 20 - 40 ill
Equation (6). Thus, accumulated feeding in cm2is summed over all age classes of all species and all instars) and large (third, fourth, and fifth instars) larvae on a given stratum. We typically observe considerable overlap in P. xylostella life stages in the field. Therefore, the initial number of P.
xy-lostella on each stratum is evenly divided among
the 20 delay subclasses that represent this species, and only forecast total numbers of P. xylostella larvae are reported.
Feeding Rates, Accumulated feeding by each species on each stratum is calculated as a function of temperature and larval age. The larvae of each species tend to eat very little until the final instars, when feeding rates increase dramatically (Chen &
Su 1978, 1982). An exponential model is used to ensure that the predicted feeding rate is positive and to provide a qualitatively good fit. Plots of In (feeding area/d) against proportion of develop-ment time completed at three temperatures ap-peared linear, with intercept close to zero and slope dependent on temperature. Tatchell (1981) studied consumption by A. rapae at lower temperatures and found that total consumption (leaf area in cm2) increased between 13 and 19°C, then decreased between 19 and 24°Cj Boldt et a1.(1975) found that
T. ni consumption increased from 20 to 25°C and
then decreased between 25 and 30°C. These studies and the plots described above indicate that the effects of temperature on feeding rates are not lin-ear; rather, they are greater at intermediate tem-peratures and less at low and high temtem-peratures. We describe this effect of temperature on feeding rate by defining the slope in a regression of In (feeding area/d) predicted by larval age as a qua-dratic function of temperature. Feeding rate per larva per day as a function of temperature and age of the larva can then be expressed as an exponential function, (5) F, U(t) M(t) 5;,(t) .
1 - 20 DEV.(t) ,the proportion of each
Sj
subclass shifted,
the standard deviation of development times for species s,
1, forM(t) =1,2,3, ... ,
o
otherwise, , At ~ F DEL;i(r) , , 20 At 0.02 d, r = At, 2At, 3M, ....52
--' - was found to be fairly constant for each
DEV
speci~s over three temperatures (A.M.S. and P. B. Baker, unpublished data), so F, was assumed to be a constant (Table 1). When programmed, U(t) acts as an indicator for the shift of contents from each subclass to the next subclass, and F,gives the pro-portion of each subclass shifted.
The subclasses are used to approximate larval age groups, which are required to calculate age-specific feeding rates and to assign an age to the larvae that move between strata. Larvae on dif-ferent strata develop at difdif-ferent rates because of different temperaturesj therefore, larvae that move between strata must be placed in the appropriate age group at the new location (technically, the subclasses refer to relative maturity rather than
chronological age). .
The average number of a given instar per plant is divided evenly among delay subclasses desig-nated to represent that instar as follows: k =1-3, 4-6, 7-10, 11-15, 16-20 for A. rapae instars one
through five; and
k
=1-3, 4-6, 7-9, 10-14, 15-20
for T. ni instars one through five. The number of subclasses used to represent each instar for a given species was based on estimates of the proportion of total larval development time spent in each in-star (A.M.S. and P. B. Baker, unpublished data). For example, if approximately one-fourth of the larval period is spent in the last instar, the last instar would be represented by one-fourth of the sub-classes, the last five. Summing over the appropriate subclasses gives the number of individuals in a giv-en instar at a givgiv-en time. In practice, instar des-ignations are used only for initialization and re-porting forecast numbers of small (first and second for each species, the output was similar to a delay without controlled dispersion using approximately twice the number of subclasses and twice the amount of computing time).Programming the distributed delay with con-trolled dispersion yields the following difference equation 'for the average number of pests per plant N,
(7) 31 31 T. ni A.rapae P. xyfostefla 000 1.0 a8 a6 Physiological Age
constants estimated by maximum likelihood as described by Hoy et al. (1989).
>:
'" 449535~
~
'" 2:!lli90"i:
,g,
~ 149845 II: OJ c '6aoo
'"
a'f 1.0 0.8Fig. 3. Predicted feeding rates ofP. xylo8tella, A. rapae, and T. ni on cabbage.
Because the shape parameters for the Beta distri-bution, a, and
h"
change with temperature, the shape of the distribution and value of the integrals described in Equation (8) change accordingly. Higher temperatures tend to result in greater prob-ability of movement, and higher probability of movement towards the lower leaves than towards the head; lower temperatures tend to result in lower probability of movement, and higher probability of movement towards the head than towards the lower leaves.The elements of the transition probability ma-trices for P. xylostella and A.rapae are estimated from observations reported in the literature (Har-court 1963, 1966; Chua & Lim 1979; Samson &
~ 15llli6S
~
~
"" 1(57.n
"1:
§. Gl 528.1Il ttl a: OJ c '6'"
a'f
06 Physiological Age~
~ :JI.64~
""ce
:5.76 §. Gl l2 12.88 OJ c '6 Gl Gl U.previous time steps by,
Ej(t) =
± ± ~
[N'k/T)FPD'kj(T)] ~tT""O ,-I k-I 100
where,
Ej(t) area of feeding (cm2) on stratum j accu-mulated at time t,
T ~t, 2~t, 3~t, ... ,
M 0.02 d.
P"'j(t)
=
f ~
1__ U1a,(I)-11(1 - U)lb,(l)-lldu
J~l B[a,(t), b,(t)] (8)
where
the probability of a
T.
ni (species 3) late instar moving from stratumito stratum j during one day,
eel +C2 avtemPi(t), ed, +d2 a.temp,"),
The three empirical constants
(hh' hz.,
andh31
in Equation 6) for estimating feeding rates as a func-tion of temperature and larval age were estimated by multiple linear regression (SAS Institute 1982) of the natural log of feeding/day (mm2) on age, age' temperature, and age·temperature2 (Table 1).The measure of larval age was the proportion of larval stage completed, or days the larva had lived so far, divided by total days spent by that larva from eclosion to pupation. Measurements of area of cabbage leaf consumed each day of the larval period for each of 20 larvae/replicate, and three replicates/temperature at 16.7, 21.1, and 26.7°C for each species were taken by A.M.S. and P. B.. Baker (unpublished data). Inspection of predictions (Fig. 3) compared with data reported in the lit-erature (Harcourt et al. 1955; McEwen & Hervey 1960; Rahman 1970; Harper 1973; Boldt et al. 1975; Chen & Su 1978, 1982; Samson & Geier 1983; Theunissen et al. 1985) indicates that the feeding
rate model fit well. Data on feeding
by
A.
rapaereported by Tatchell (1981) indicate much higher rates than those we estimated, but Tatchell's data disagree with the other literature cited above as well. As in the case of development rates, we used the A.M.S. and P. B. Baker data, because the food source was cabbage leaf, so these data should be most appropriate.
Movement Rates. Larval movement is simulated with discrete time transition probability matrices, because observed larval movements were discrete in time. Movement of late instar
T.
ni is correlatedwith microclimate (Hoy et al. 1989) and must be modeled accordingly. The transition probabilities for late instar T. ni are modeled as definite integrals of the Beta probability density function (pdf) with shape parameters a.(t) and b,(t), which depend on temperature and the stratum larvae are moving from,
October 1990 Hoy ET AL.: INTRAPLANTMOVEMENTAND ECONOMICTHRESHOLDS
File
Edit
1585..,
0.21 3.39 11.31 32.4125.68
Fig.4. Computer screen displaying output from a simulation model of feeding damage by Lepidoptera on cabbage.
Geier 1983; Salinas 1984) and our own observa-tions. Our observations for these species were the frequency of movements by larvae marked with fluorescent powder and visually censused at ~1-h intervals in research cabbage plots near Geneva,
N.Y. The number of these observations was not sufficient to estimate individual transition proba-bilities, so the data were used roughly to estimate frequency of movement and probability of moving up or down on the plant. For P. xylostella, the frequency of movement was low, and approxi-mately equal numbers of upwards and downwards movements were observed. For A. rapae, virtually all late instars were observed to move upwards to the head or wrapper leaves, as noted by Harcourt (1963, 1966) and Hoy & Shelton (1987). Transition probabilities that reflect these observations were chosen for these two species and are given in Ta-ble 1.
The change in state variables due to movement is thus calculated by,
s N'kj(t
+
~t) = ~ N'kj(t)p"j(t)I(t+
~t) (9) wherek
=k
=
I(t
+
~t) ~t 13, 14, , 20 for s =1, 10, 11, , 20 fors
=2 or 3, 1if
(t+
~t) = 1, 2, 3, . . . ,o
otherwise, 0.02d.Movement is simulated only once each day, and because the time step for the model islfsoof a day, the indicator I(t) is used to determine when the movements occur. The values of
k
given above are chosen so that movement is simulated only for older larvae, which are represented by higher values ofk (k ~ 13 for P. xylostella and k ~ 10 for A. rapae or T.ni).
Model Output. The output generated, using the equations described above, is a summary of the values of state variables and the value of the aux-iliary variable each day for the next 7 d. This is presented on the computer screen depicted in Fig. 4. The number of large and small larvae of each species on each stratum also can be obtained for a printout by summing over the appropriate sub-classes in the distributed delay. The picture of a cabbage plant on the screen gives the user an ap-proximate idea of what the predicted damage on the cabbage crop would look like.
Validation
Methods. Validation analysis was performed to demonstrate how well the model predicts data that were not used in model design or parameterization. Data collected by a commercial field monitoring and pest control advising service were used to com-pare model predictions with observed population densities and feeding damage 7 d after the original
A.
rapae P. xylostella18
16
14
1210
8
6
4
2
o
0.0
0.6
1.2
1.8 2.4
5.57
3.71
11.14
9.2}
7.43
13.00
A.
rapae10
P. xylostella 20o
O.0 1. 6 3.2
4.8 6. 4
3010
20
1.
ffi0
O.0
1. 2
2
4
3. 6 4. 8
0.00
-0.5
0.0
0.5
1.0
1.5
13. 00
11. 14
9.29
T. ni T. ni7.43
5.57
10
3. 71
1.86
0. 00
- O.32
- O.16 O.00
0.16
0.32
O.0 O.8
1. 6
2
4 3. 2
Standardized Residuals
Standardized
Residuals
for the Head
for the Wrapper Leaves
-
o
>.
u
c
Q)=:J
0' Q)'-LL
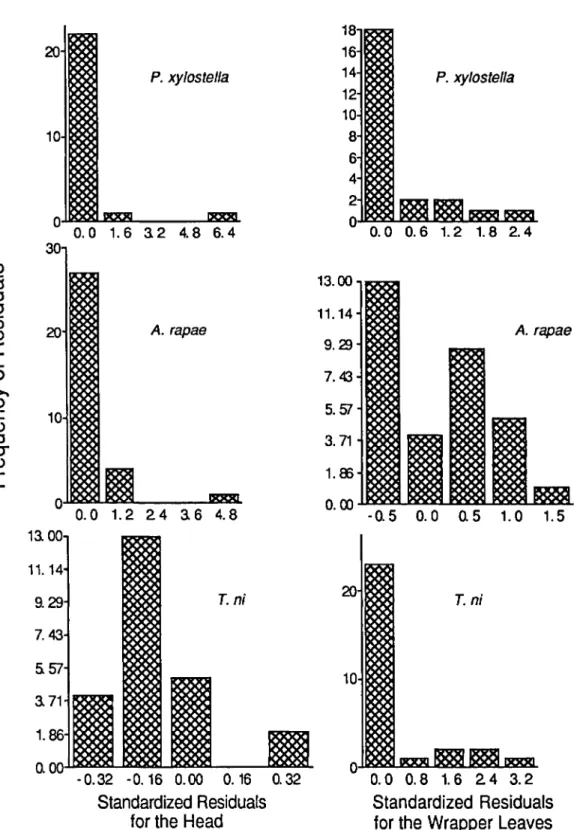
Fig. 5. Histograms of standardized cell residuals for comparing predicted numbers with observed average numbers of larvae on the cabbage head and wrapper leaves in commercial cabbage fields near Geneva, N. Y.
sample. Scouts sampled cabbage fields on a weekly basis, using a variable-intensity sampling scheme (Hoy et al. 1983). Separate counts of
P. xylostella.
larvae (all instars combined), and A.
rapae
andT..
ni eggs, small (first and second instars) and large (third, fourth, and fifth instars) larvae were taken
on the head (stratum 1),wrapper (stratum 2), and frame leaves (strata 3-5 combined), and were used to initialize the model. Predictions of numbers of
P. xylostella,
large A.rapae,
andT. ni,
andac-cumulated feeding on the head and wrapper leaves were compared with the scout's observations taken
October 1990 HoY ET AL.: INTRAPLANTMOVEMENTAND ECONOMICTHRESHOLDS 1587
o
[]
a [] C DQOO n~ Q~ n~ 1.00 1.~ t~ 1.~ 200
Average Damage Rating
Average Damage Rating
Fig. 6. Comparison of predicted feeding damage with average observed damage rating on the heads and wrapper leaves of commercial cabbage crops near Ge-neva, N.Y.
the following week. Initial spatial distribution with-in the frame and with-initial age distribution with A.
rapae and T. ni small and large larval populations were assumed to be uniform, for lack of more pre-cise information. The scout's observations included ratings of feeding damage on a scale of 0 to 4, indicating approximately no damage, less than one feeding hole per leaf, one to three feeding holes per leaf, 10% defoliation, and ::::40% defoliation, respectively. These ratings were compared with predictions of accumulated area of feeding with scatter plots and correlation analysis.
Weather data for model inputs (maximum and minimum temperatures and daily total solar ra-diation) were recorded at the New York State Ag-ricultural Experiment Station in Geneva, N.Y., the c1vsest weather station to the commercial fields being monitored (within 20 km). Data from 34 pairs of field samples-each pair taken one week apart during July, August, and September in 1983 and 1984, under widely varying weather condi-tions-were used for this analysis.
Model predictions for number of larvae on the head and wrapper leaves were compared with ob-servations using standardized cell residuals given by,
observed no. larvae - predicted no. larvae
V
predicted no. larvaeEvaluation of Existing Treatment Guidelines
Because the model predicts numbers of larvae and feeding damage on different parts of the plant well, model predictions cap be used to evaluate treatment guidelines currently in use for cabbage pest management. In particular, the model can be used to explore the relative effects of each pest on the crop and how useful a static threshold for pest population density will be in predicting a given as described by Bishop et al. (1975). These ap-proximate a standard normal distribution, so the criterion for evaluation is whether or not most of the residuals are within 2 SD of the mean (::::- 2 and ~2), because <=:::95%of the standard normal distribution falls within this range. Observations of the feeding damage rating also were plotted against predicted accumulated area of feeding, and asso-ciated correlation coefficients were calculated.
Results and Discussion. Most standardized cell residuals for predicted versus observed counts of larvae on the head and wrapper leaves were well within the range -2 to +2 (Fig. 5). The few large deviations that were calculated were positive, in-dicating that, occasionally, greater average num-bers of larvae than predicted were observed. The interplant spatial distribution of each species is ag-gregated (Harcourt 1966), and sample sizes were often small (as few as11plants) so these occasional large positive deviations are not surprising. These results indicate that the model predicts number and location of larvae well, particularly when the low resolution in the data for initial age and spatial distribution within the frame and potential sam-pling error in both samples are considered. Con-clusions from this analysis must be tempered some-what, however, by the low population densities observed in these fields. Bishop et al. (1975) warn that the approximation of the standardized cell residuals to the standard normal is poorest when predictions in the cells are small. Most of the initial population densities and associated predictions were small, because pest population densities are kept low by farmers. Evaluation of the model under these conditions is most appropriate, however, be-cause these are the conditions under which the model would be used.
Predicted area of feeding was correlated with observed damage rating (Fig. 6). Damage rating included assessment of recent feeding, as well as older damage done before the first sample. This could explain circumstances in which little feeding damage was predicted, but high damage ratings were observed. Cases where large amounts of feed-ing damage were predicted but observed damage rating was low did not occur. Feeding damage is the most important variable to managers, because it determines the market value of the crop. The data indicate that the model can be used to predict the effects on the cabbage crop of a given pest population under specific conditions.
3 (10) D o D D o C C lJ 8 DaD c o lJ 0 D
""
D 0 2 D !1 D D C C D Wrapper Leaves r-0.69 Head r-0.53 o o 0 q, CD g> 20 '6 Q)~
'0 Q) ~ 10 f!! a.'"
E .8. 40 o o'"
E .8. 30 Dl c: '6 Q).t
20 'tJ Q) U'g
1a:
Head
Wrapper Leaves
T.ni 5.65 1.34 3.77 0.89 1.89 0.45 2.0 2.0..-..
Temporatura Avorago .'plon1C\J DC
E
C,,)---
0) c A.rapae:a
Q) a18 1t82 Q) U. 5.46 7.89 "0 Q) 2.73 396:§
"0 3.0 3.0e?
D..Temperature Avorago .!pIont
DC Temperalure Avomg •• /p1ont
DC P. xylostella 0.74 1.78 0.50 1.19 0.2i 0.61 20
rompera1ur. Avorago "plant
DC Tempera1ure Averag •• 'p1on1
DC
Fig. 7. Predicted average accumulated area of feeding on the cabbage head and wrapper leaves after 7 d at different temperatures and population densities of lepidopteran pests.
amount of damage on the marketable parts of the crop.
Methods. Response surfaces of predicted area of feeding on the head and wrapper leaves to tem-perature and population density of each pest were generated with the model. A standard initial in-traplant spatial distribution, typical of distributions observed in cabbage fields, was chosen for each species as follows: P. xylostella, 0.05, 0.1, 0.3, 0.3 and 0.25; A. rapae, 0, 0.15, 0.4, 0.3, and 0.15; T.
ni, 0, 0.1, 0.2, 0.4, and 0.3 of the average number per plant on the head, wrapper leaves, upper frame, midframe, and lower frame, respectively. For P.
xylostella, the larval ages were uniformly
distrib-uted among the 20 subclasses in the distribdistrib-uted delay. For A. rapae and T. ni, the larvae were initialized into the first 10 subclasses, simulating first, second, and third instars. For each of 10 pop-ulation densities, ranging from well below to well
above the action threshold currently used in New York (Shelton et al. 1982), feeding was predicted at six constant temperatures.
Additional response surfaces were generated of feeding area on the head and wrapper leaves pre-dicted at different temperatures and initial age dis-tributions for a given population density of each species. Given the initial spatial distribution de-scribed above and an average temperature be-tween 20 and 25°C, the first set of response surfaces was used to select a population density predicted to cause damage most farmers would consider un-acceptable. This density, twice the currently rec-ommended action threshold, was 1 larva/plant for
T. ni, 1.5 larvae/plant for A. rapae, and 10 larvae/ plant for P. xylostella. Different age distributions were generated by dividing the population densi-ties chosen above evenly among larval maturity subclasses 1 through 6, then 2 through 7, etc., up
October 1990 Hoy ET AL.: INTRAPLANTMOVEMENTANDECONOMICTHRESHOLDS 1589
Head Wrapper Leaves
1.n 5.19 2.60 T.1i Temperature DC 10
Youngest Age ProSQnt
10
10
YOungG81 AGe PrQsan
A.rapa/l
2333
'557 7.8' 10
Youngest Ago PreSGnt
Temperature DC 1.42 P. xylost/llia 0.98 0.53 '0 0.09
Youngesl Ago Present
Temperature
DC
TemperalUIlli
Dc
Fig. 8. Predicted average accumulated area of feeding on the cabbage head and wrapper leaves in 7 d due to different temperatures and age distributions at a given population density of three lepidopteran pests of cabbage. Population densities were l/plant for T. ni, loS/plant for A. rapae, 10/plant for P. xylostella.
to 10 through 15. Model predictions were gener-ated at each of these age distributions, for each of the 6 constant temperatures used above.
Results and Discussion. Response surfaces gen-erated with the model predict that A. rapae con-tributes most to feeding damage on the head and wrapper leaves (Fig. 7). Although total consump-tion by A. rapae larvae is less than that of T. ni (Harcourt et al. 1955), the amount consumed on these economically important strata is greater, be-cause of the difference in intra plant spatial dynam-ics of the two species. In Fig. 7, the model predicts that for a given constant temperature and given initial age and spatial distributions, feeding on the head and wrapper leaves increases linearly with population density for each species. Systems that weight the counts of each species according to ex-pected feeding damage and base the action thresh-old on the weighted counts have been proposed
(Harcourt et al. 1955, Shelton et al. 1982), but these did not consider the spatial dynamics of the pests. Thus, one potential use of our model is to design a new rating scale to weight the population density of each species according to expected feeding dam-age, considering the spatial dynamics of each species. This rating scale, however, would also have to account for temperature effects, which can greatly affect predicted feeding.
At temperatures
<
15DC, very little feeding is predicted on the head and wrapper leaves by each species at any population density (Fig. 7). Increas-ing temperatures have a nonlinear effect on pre-dicted feeding by each species. For P. xylostella and A. rapae, the increase in predicted feeding rate may be primarily due to increased develop-ment and feeding rates. For T. ni, however, in-creased development and feeding rates at higher temperatures may be offset to some extent by higherprobabilities of moving away from the head and wrapper leaves towards the lower leaves (Hoy et al. 1989).
For a given population density, predicted feed-ing on the marketable parts of the plant varied widely with age distribution, again interacting with temperature (Fig. 8). The results indicate that the damage caused by a given population density, a fixed economic threshold for example, will vary considerably with temperature, age structure of the population, and species composition. Again, weighting systems have been described that con-sider larval age (Andaloro et al. 1983a), but not with the resolution that Fig. 8 implies is necessary, and they do not include the interaction with tem-perature.
Considering the profound effects of tempera-ture, age distribution, and species-specific spatial dynamics on the predicted area of feeding on eco-nomically important parts of the plant, a static economic threshold does not seem to be appropri-ate. Rather, feeding should be predicted for specific population densities, age distributions, and spatial distributions of the three species, as well as weather forecasts; and management strategies should be de-signed accordingly. The model described here could be used to make those predictions, either by cal-culating a new species weighting system each day of the growing season to be used with a fixed action threshold, or simply by making the required pre-dictions on a case-by-case basis.
Sensitivity Analysis
Two goals were addressed in the sensitivity anal-ysis. First, individual model parameters were eval· uated as potential causes of inaccurate predictions. By examining the change in model output after a change in the individual parameters, parameters that affect the output most can be identified. Sec-ond, by examining the effects of changes in dif-ferent parameters in combination, insight can be gained into the effects of the different processes being simulated, and their interactions, on the out-put variables of interest.
Methods. Model predictions were evaluated af-ter changing each parameaf-ter and input supplied by the user by +10% and -10% of its value. Changes were made one parameter at a time, with a standard set of initial conditions. Standard initial pest population densities were a mean of 1 larval plant of each species on each stratum, in the second instar for A. rapae and T. ni, and uniformly dis-tributed among the 20 age subclasses for P.
xylo-stella. The analysis was performed at each of three
temperature regimes: typical summer weather for western New York (maximum temperature, 26.7°C; minimum temperature, 15.5°C; 8 h sunshine each day), hot and sunny weather (maximum temper-ature, 32.2°C; minimum tempertemper-ature, 21.1oC; 12
h sunshine each day), and cool and cloudy weather
(maximum temperature, 18.3°C; minimum tem-perature, 10°C; 2 h sunshine).
Constants were changed by adding or subtract-ing 10% of their value. Input weather variables were changed by adding or subtracting 10% of the value of each pay's forecasted maximum and min-imum temperature and hours of sunshine. Age at which larvae begin to move was shifted plus or minus two subclasses to effect a 10% change. Initial age distribution for A. rapae and T. ni was also shifted 10% by shifting the subclasses initialized by plus or minus two. Initial age distribution for P.
xylostella is assumed to be uniform, so this was not
changed. For each species, the initial intraplant distribution was altered by shifting 10% of each age group on each stratum, except the lower frame leaves, down one stratum, or shifting 10% of each age group on each stratum, except the head, up one stratum (e.g., a downward shift of an average of one larva on each stratum would result in an average of 0.9, 1, 1, 1, and 1.1 larvae on the head, wrapper, upper frame, midframe, and lower frame leaves, respectively). Transition probabilities for A.
rapae and P. xylostella were changed by a similar
method, shifting 10% of the probability of moving to each stratum except the lower frame leaves to the next lower stratum, or shifting 10% of the prob-ability of moving to each stratum except the head to the next stratum up (e.g., a downward shift in a transition probability vector of 0.9 0.1000 results in a vector of 0.81 0.18 0.01 0 0). Sensitivity to changes in transition probabilities for T. ni were examined by changing the Beta pdf shape param-eters that govern transition probabilities for this species by + 10% and -10% of their value. The effects of each of these changes were examined by calculating the percentage of change in number of larvae of each species, and the percentage of change in accumulated area of feeding, on the head and wrapper leaves.
To examine interactions between different pro-cesses and their effects on model output, we per-formed two analyses in which variables suspected of interacting were varied in all combinations, the equivalent of a factorial design with three levels of each factor, given by +5%, -5%, and 0%. Be-cause development and feeding rates are temper-ature-dependent and govern the amount of feeding accumulated, interactions between temperature, feeding rates, and development rates might affect accumulated area of feeding. Three levels of tem-perature were generated, starting with the typical summer weather regime described above and add-ing 5%, -5%, or 0% of the daily maximum and minimum. At each temperature level, develop-ment rate for each species was varied by +5%, -5%, and 0% from its value, and at each of these development rates for each species, feeding rate was changed by +5%, -5%, and 0% of its value. The effects of these parameter changes on the pre-dicted area of feeding on the head and wrapper leaves were calculated.
October 1990 Hoy ET AL.: INTRAPLANT MOVEMENT AND ECONOMIC THRESHOLDS 1591 Table 2. Output from a model to predict lepidopteran
feeding damage on cabbage at three temperature regimes with a standard set of inputs and no change in the param-eters. Changes in output during the sensitivity analysis (Fig. 9-12) are compared with these standards
Stratum Population density (avg no./plant) Feeding,
P. xylostella A.rapae T.ni cm2
High temperatures Head 0.252 2.118 0.095 12.764 Wrapper 0.390 2.594 0.662 21.716 Moderate temperatures Head 0.423 1.957 0.299 6.805 Wrapper 0.578 2.524 1.001 9.667 Low temperatures Head 0.635 1.296 0.829 1.945 Wrapper 0.834 1.651 0.886 2.348
A similar analysis of interacting processes was performed for spatial effects. Initial distribution and transition probabilities could be expected to interact in their effects on spatial distribution of larvae and feeding damage. For each species the initial distribution was treated by (a) shifting 10% of each age group on each stratum (except the lower frame leaves) down one stratum, (b) shifting 10% of each age group on each stratum (except the head) up one stratum, and (c) leaving the initial distribution unchanged. At each of these shifts in initial distribution for each species, the transition probabilities for that species were changed as
de-scribed above. Shifting 10% of the probability of moving to each stratum except the lower frame leaves to the next lower stratum resulted in higher probabilities of downward movement; shifting 10% of the probability of moving to each stratum except the head to the next stratum up resulted in higher probability of upward movement.
Results and Discussion. Standard results for high, moderate, and low temperature regimes, without changing any of the parameters or input variables, are given in Table 2, and the effects of changing each parameter and input variable on selected out-put variables are displayed in Fig. 9-12 for the moderate temperature regime. We begin the anal-ysisby examining sensitivity of the model to changes in the parameters at moderate temperatures and follow with the differences in model sensitivity seen under high and low temperature regimes.
At moderate temperatures, numbers of larvae of each species on the head and wrapper leaves were least sensitive to initial spatial distribution of larvae, dispersion in development time, and hours of sun-shine (Fig. 9). Change in the initial intraplant dis-tribution of larvae may be compensated for by movement of larvae within a short time after the beginning of the simulation. Dispersion in devel-opment time for these species was low in the lab-oratory development studies, resulting in a small
S'
value of-D' for each species. A 10% change in
EL~
these small values does not change the dispersion
o
Effect 01 +10% change• Effect 01 -10% change } on #larvae on the head alief 7 days
Inldal dlsbibudon Initial ages Age 01 first movement Transition probabilities Dispersion In developmenl gl DEL {g2 C Hours 01 sunshine Temperalure -20 -10 0 10 P. xylostella 20 30 -20 -10 0 10 20 A. rapae
o
T.nl 100on #larvae on the wrapper leaves alter 7 days
10
-10 Initial distribution
Initial ages Age 01 firsl movement Transition probabilities Dispersion in development gl DEL {g2 C Hours of sunshine Temperature -20
o
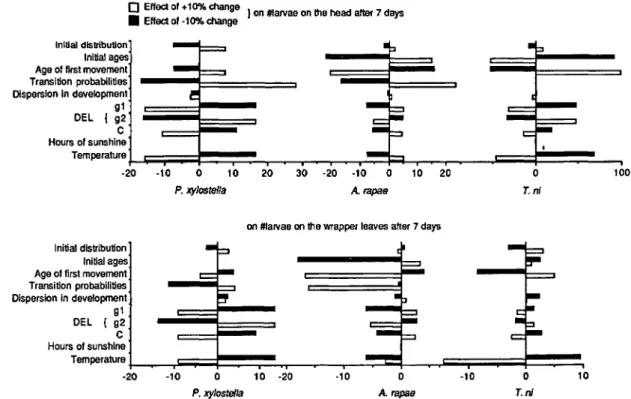
10 -20 -10 0 -10 0 P. xylostella A.rapas T.nIFig. 9. Percentage of change in predicted number ofP. xylostella, A. rapae, andT. nt larvae on the head and wrapper leaves after changing model parameters
+
and -10%.Fig. 10. Percentage of change in number of T. ni
larvae predicted on the head and wrapper leaves after a
+
or -1 0% change in parameters governing their tran-sition probabilities on the cabbage plant.greatly. Hours of sunshine influence temperature in each stratum, but apparently not enough to cause large changes in rate functions.
Changes in temperature, initial age distribution, age at which larvae begin to move between strata, and transition probabilities had the greatest effects on predicted number of larvae on the head or wrap-per leaves (Fig. 9). These are all linked to spatial dynamics, since both temperature and initial age distribution affect the time at which larvae begin to move between strata. Changes in parameters governing T.ni transition probabilities were an exception, causing only moderate or small changes in output (Fig. 10). Changes in development rate parameters had large effects only for P. xylostella on the head and wrapper leaves and for T.ni on the head.
Predictions of accumulated feeding on the head and wrapper leaves were generally less sensitive to changes in parameters than were predictions of numbers of larvae on these strata (Fig. 11 and 12). Because the predictions of accumulated area of feeding are most important to the farmer, the ro-bustness of the model in predicting feeding sug-gests that it could be a useful management tool. The greatest changes in accumulated area of feed-ing were caused by changfeed-ing parameters governfeed-ing
A. rapae development or feeding, particularly
ini-tial age distribution. Fortunately, development rates for all three species considered here have been well studied, and studies done at widely different times and locations with different food sources suggest that average development rate at a given temper-ature is fairly constant (Hardy 1938; Richards 1940; Given 1944; Miner 1947; Harcourt et al. 1955; Shorey et al. 1962; Jackson et al. 1969; Toba et al.
1973; Boldt et al. 1975; Butler et al. 1975; Smith
&Smilowitz 1976; Chen &Su 1978, 1982; Tatchell 1981; Yamada & Kawasaki 1983; Theunissen et al. 1985). Changes in forecast temperatures cause the next largest change in accumulated feeding, prob-ably because of their effects on development and feeding rates. Parameters governing spatial effects had smaller effects on accumulated feeding, par-ticularly when compared with their effects on pre-dicted number of larvae on different parts of the plant.
Under the low-temperature regime, predictions of numbers of larvae on the head and wrapper leaves were more sensitive to parameters affecting development than to parameters affecting spatial dynamics. At low temperatures, larvae take longer to reach the age when movement starts, and prob-ability of movement by T. ni to the head and wrapper leaves is lower. Furthermore, fewer small larvae become large larvae at low temperatures, so total numbers of large larvae on all strata are re-duced. At moderate and high temperatures, pre-dictions of numbers of larvae on the head and wrapper leaves were more sensitive to changes in parameters affecting spatial dynamics.
Effects of changing forecast temperatures on predictions of accumulated feeding were much greater when the forecast temperatures were low, and less when the forecast temperatures were high, than at moderate temperatures. Changing devel-opment rate parameters had a greater effect on accumulated feeding at low temperatures, but changing feeding rate parameters had a greater effect at high temperatures than at moderate tem-peratures. Accumulated feeding was less sensitive to changes in transition probabilities at low tem-peratures, and more sensitive to changes in tran-sition probabilities at high temperatures, than at moderate temperatures.
In general, interactions between temperature, development, and feeding rates, as well as param-eters governing spatial effects, were not evident. Typically, the effect of changes in each of these parameters was similar regardless of the value of the other parameters. One interaction did occur: When temperature was increased, a negative change in T. ni development rate resulted in less predicted feeding on the head than when no change in T. ni development rate was made. In all other cases negative change in development rates re-sulted in higher predicted feeding on the head than when development rates were not changed. Re-gardless, 5% changes in development rates for T.
ni resulted in <3% differences in feeding on the head, so the effects of this interaction are not of great importance. Thus, this analysis reinforced the single parameter analysis. Feeding rates themselves were changed in this analysis, rather than the pa-rameters that govern them, and accumulated feed-ing on the head and wrapper leaves was still more sensitive to changes in development rate and tem-perature. 5 o ·5 0 Feeding on Heed -5
Feeding on Wrapper Leaves
o 10 Larvae on Head ·10 b5 b4 b3 b2 bl 85 84 83 a2 81 ·20 'l(, Change in: -20 ·10 0 10
% Change in: Larvae on Wrapper leaves
II! 2l
~
to a. 0> a. to .t: enOctober 1990 Hoy ET AL.: INTRAPLANTMOVEMENTAND ECONOMICTHRESHOLDS 1593 ~ S/DEL T. nJ g2
9d
~ S/DEl A.rapae g2 g1 C ) S/DEL P. XYlostella" ~~ -30 -20 -10o
o
Effect of a+10% change • Effect of a -10% change 10 20 30 -10o
10 20 30 % Change in:Transition prob.{ A. rapae P. xylostella
Initial larval distribution Initial ages T. ni A. rapae
) T. ni
Age movement starts, A. rapae P. xylostella Hours of sunshine Temperatures -100 % Change In: Feeding on Head
o
Feeding on HeadFeeding on Wrapper Leaves
-40 -20 0 20 40 60
Feeding on Wrapper Leaves
80
Fig. 11. Percentage of change in predicted accumulated area of feeding on the head and wrapper leaves, as a result of changing model parameters by
+
and -10%.The sensitivity analyses suggest some important implications for use of the model. First, because the model was quite sensitive to initial age distri-bution and temperatures, a user should exercise great care in collecting data for inputs. Sampling for pests should be intensive enough to estimate the age distribution of each species accurately.
Fur-thermore, because the insects within an instar are assumed to be uniformly distributed in age within the instar, erroneous predictions could be made if larval ages are more synchronous (e.g., all small larvae are within a few hours of eclosion). Insects in the field are usually not highly synchronous in their development because of different times of
o
Effect of a +10% change • Effect of a -10% change Feeding Rates T. ni ) ~~ '\ hl A. rapae ) ~~ '\ hl P. xylostella ) ~~ '\ hl -30 -20 -10 0 10 20% Change in: Feeding on Head
30 40 -20 -10 0 10 20 30 40
Feeding on Wrapper leaves
Fig. 12. Percentage of change in predicted accumulated area of feeding by Lepidoptera on cabbage heads and wrapper leaves after a
+
or -10% change in feeding rate parameters.oviposition and individual variation in develop-ment rate. Insecticides, however, can create more synchrony in larval ages by killing some life stages and not others. Errors are also likely to occur be-cause of erroneous weather forecasts, and extended forecasts from the National Weather Service could be inaccurate enough to result in such errors. Weather forecasts used should be as recent as pos-sible and as specific as pospos-sible to the local area being simulated in the model.
A second consideration is that predictions of number of larvae of a given species on a given stratum may be less precise than predictions of accumulated feeding, because the predictions of number of larvae on a given stratum are more sensitive to changes, or imprecision, in model pa-rameters. Managers should be more concerned with predicted feeding anyway, because this is the vari-able that determines value of the crop. In making decisions, predictions of feeding should be stressed as the most robust indicator of economic damage, and the output variable for which the model is most robust. The predictions of number of larvae can be used to support decisions based on predic-tions of feeding damage, and perhaps to help target the most damaging species when selecting an in-secticide or other treatment.
Finally, these analyses suggest two areas in which additional work to improve the model would be most useful: transition probabilities for P. xylostella and A. rapae, and the microclimate submodel. Changing transition probabilities for P. xylostella and A.rapae had large effects on predicted number of larvae on the head and wrapper leaves. The values used for these matrices reflect our obser-vations and descriptions in the literature of move-ment by larvae of these species. Qualitatively the matrices fit these observations well, but each tran-sition probability was not estimated quantitatively. Temperature affects not only the direction of movement by T.ni,but also the overall probability of movement (Hoy et al. 1989). Temperature could affect movement of the other two species as well, with the same proportion of larvae that do move going to a given stratum, but different proportions of larvae moving at different temperatures. Tech-niques developed to model movement as a function of environmental conditions forT. nimay be useful for the other two species.
Temperature itself within the canopy has been represented with a simple, descriptive model. This description is based on an understanding of the energy budget within a crop canopy, but that en-ergy balance can itself be modeled more mechanis-tically. Unfortunately, a more mechanistic treat-ment would require consideration of more weather conditions. Specifically, heat loss due to convection would require estimates of wind speed, and evap-orative heat loss would require estimates of am-bient humidity. Because these cannot be predicted nearly as reliably as temperature, they were not included in this first version of the model. However,
given the sensitivity of the model to temperature, making use of whatever predictions are available in a more sophisticated and mechanistic microcli-mate model may improve reliability of predictions of numbers of larvae on given plant strata and predicted area of feeding on those strata.
Conclusions
The simulation model described here has al-lowed us to estimate the importance of intraplant spatial dynamics in determining when and how much damage will occur on the marketable parts of a crop. We have learned from the model that these dynamics have an important effect on the amount of damage incurred on the marketable parts of the plant resulting from a given combination of population densities of pest species and environ-mental conditions. We maintain that these effects are important enough to warrant the use of a more complex model than the static threshold population density in making management decisions for the system we have studied.
A manager using this model would supply a weather forecast and results of a field sample to generate predictions of feeding damage. If mini-mal or no damage is forecast on the head and wrapper leaves for the next 7 d, no treatments would be applied to the crop. If unacceptable levels of feeding were forecast during the 7-d period, the manager would look at the output for each day to determine when unacceptable levels were forecast to appear. Until the manager has gained some ex-perience in using the model, a conservative limit for allowable damage would probably be used. A treatment, usually an insecticide application, would be applied to reduce the pest population before the damage is forecast to appear. Fine tuning of the timing of this application that would consider weather, schedule of other farm operations, and changing age structure of the pest population and resulting effectiveness of the insecticide is possible between the time the forecast is made and the time the unacceptable damage is forecast to appear. If the weather during this period is different from the forecast, the model could be rerun with the updated weather forecast for even more precise information.
We rely on the manager to decide what level of damage is unacceptable and to devise reasonable management strategies accordingly. Our experi-ence has been that individual farmers have their own guidelines for acceptability developed through years of experience in marketing their product. Despite attempts to standardize quality guidelines, considerable variation seems to exist in what in-dividual buyers are willing to accept, with accom-panying variation in what they are willing to pay. No one understands these guidelines better than the buyer and seller, because the understanding is created between these two. The sellers, in this case,