2009/8
Short communication
Post-processing technique for improved assessment of
hard tissues in the submicrometer domain using local
synchrotron radiation-based computed tomography
Nachbearbeitungstechnik fu¨r eine verbesserte Erfassung harten Gewebes
im Submikrometerbereich mittels lokaler synchrotronstrahlungsbasierter
Computertomographie
Philipp Schneider1, Romain Voide1, Marco Stampanoni2and Ralph Mu¨ller1,*
1Institute for Biomedical Engineering, University and ETH Zurich, Zurich, Switzerland
2Swiss Light Source (SLS), Paul Scherrer Institut (PSI), Villigen, Switzerland
Abstract
During the last two decades micro-computed tomo-graphy has become the method of choice for the non-destructive assessment and quantitative morphometry of hard tissues in three dimensions. With the advent of third-generation synchrotron radiation sources, micro-computed tomography in the micrometer range has become feasible and has been employed to analyze local bone tissue properties. However, owing to limitations regarding the tradeoff between object size and spatial resolution, non-destructive conventional global comput-ed tomography of hard tissues, such as bone, remains unachievable in the submicrometer domain so far. Here, we report on a post-processing technique for the assess-ment of hard tissues using local synchrotron radiation-based computed tomography, which overcomes this experimental limitation.
Keywords: bone ultrastructure; canal network; cortical
bone; cupping; morphometry; mouse; osteocyte lacunae. Zusammenfassung
Hinsichtlich einer zersto¨rungsfreien Erfassung und quan-titativen Morphometrie harten Gewebes in drei Dimen-sionen hat sich die Mikro-Computertomographie im Verlaufe der letzten zwei Jahrzehnte zur Methode der Wahl entwickelt. Mit dem Aufkommen von Synchrotron-strahlungsquellen der dritten Generation wurde Mikro-Computertomographie im Mikrometerbereich mo¨glich und angewandt, um lokale Knocheneigenschaften zu untersuchen. Jedoch bleibt – infolge von Beschra¨nkun-*Corresponding author: Prof. Dr. Ralph Mu¨ller, Institute for
Biomechanics, ETH Zurich, Wolfgang-Pauli-Strasse 10, 8093 Zu¨rich, Switzerland
Phone: q41-44-632-4592 Fax: q41-44-632-1214 E-mail: [email protected]
gen hinsichtlich des Kompromisses zwischen Objekt-gro¨ße und Ortsauflo¨sung – zersto¨rungsfreie herko¨mm-liche globale Computertomographie fu¨r hartes Gewebe wie Knochen im Submikrometerbereich bis heute uner-reichbar. An dieser Stelle berichten wir u¨ber eine Nach-bearbeitungstechnik fu¨r die Erfassung harten Gewebes im Submikrometerbereich mittels synchrotronstrahlungs-basierter lokaler Computertomographie, die diese experi-mentelle Beschra¨nkung u¨berwindet.
Schlu¨sselwo¨rter: Cupping; kannula¨res Netzwerk;
Kno-chen-Ultrastruktur; kortikaler Knochen; Maus; Morpho-metrie; Osteozyt-Lakunen.
Bone architecture has traditionally been studied by opti-cal microscopy, based on two-dimensional (2D) histo-morphometry. Classical bone histomorphometry involves embedding and serial sectioning of the sample, which is laborious as well as destructive, and additionally, implies model assumptions for the computation of three-dimen-sional (3D) morphometric indices, as it is inherently a 2D technique. In comparison w21x, micro-computed tomo-graphy (mCT) overcomes these limitations, because it is a non-destructive and truly 3D technique. Moreover, the continuously increasing spatial resolution capabilities of CT systems provide a more detailed insight into bone tissue. For instance, several authors have recently assessed and partly quantified the canal network within human cortical bone w4, 6, 12x.
Currently, synchrotron radiation (SR) facilities offer CT systems running at spatial resolutions down to around 1mm w20x and novel techniques are under development w26x for CT even below 100 nm. A typical experimental station dedicated to SRmCT w29x operates at present in its standard mode as a transmission microscope for a low-divergence X-ray beam, where the magnified micro-radiographic projections of the specimen are captured by a charge coupled device (CCD), after being converted by a transparent luminescent screen (scintillator) into visible light. According to this experimental setup, the spatial resolution of such a system is consequently limited by wave-front aberrations arising from the depth of focus (or defect of focus) as well as by diffraction and spherical aberrations owing to the thickness of the scintillator and its substrate w15x. As a result, the combination of
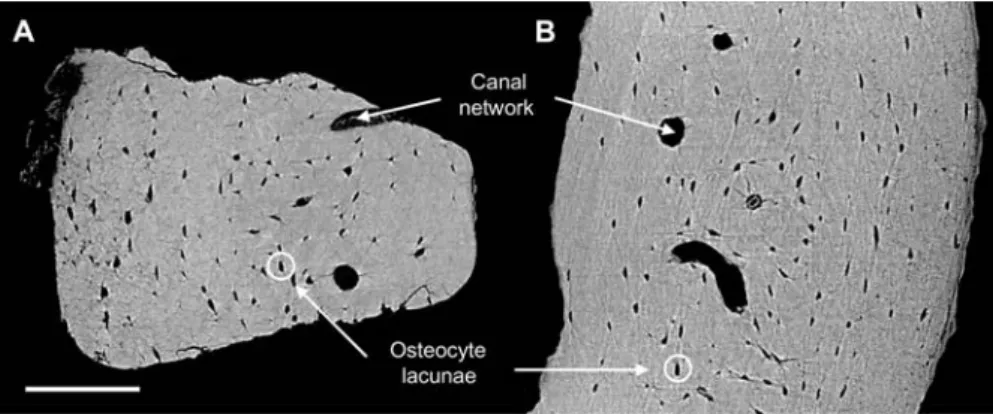
scintil-Figure 1 Artifacts arising from mechanical cutting of bone tissue.
(A, B) Reconstructed slices of a cortical sector from two murine femoral mid-diaphyses. Scale bar is 100mm. (A) Microfractures, fractures, and separate bone fragments owing to mechanical cutting of the bone tissue are clearly visible. (B) The specimen remained intact due to the presented post-processing technique for local synchrotron radiation (SR)-based CT, which allowed for non-destruc-tive assessment, quantification, and subsequent morphometric analysis of bone ultrastructure down to a cellular level. (Methods) The local SR CT measurements were performed in air at the X-ray Tomographic Microscopy (XTM) station w29x of the Materials Science (MS) beamline at the Swiss Light Source (SLS). A total of 1001 projections were acquired over a range of 180 degrees at a photon energy of 17.5 keV and at a theoretical pixel size of 350 nm. The projections were reconstructed using filtered backprojection for parallel-beam geometry. A sinogram-based algorithm was devised to eliminate ring artifacts, which arose from defects on the scin-tillator of the optical system at the XTM station and which were clearly visible in the reconstructed slices. To partially suppress noise within the reconstructed tomographic data sets, a constrained Gaussian filter was applied.
lators with optical magnification allows SR CT down to resolutions of a few hundred nanometers.
However, SR CT systems are only rarely used close to their full resolution capacity for the examination of bio-logical specimens w7, 23, 31x. This is primarily due to the fact that for a given CCD with a fixed pixel array, every increase in magnification of the optical system is accom-panied by an equal reduction in the fraction of the record-ed sample projection, i.e., by a decrease in the field of view (FOV). In other words, the maximal sample size that can be assessed by current SR CT setups in their stan-dard mode is limited by the magnification of the optical system. Namely, the most popular category of CCD cam-eras presently in use for SR CT applications w20x are equipped with an image area of up to 2048=2048 pixels and thus restrict the sample diameter to less than 1 mm in cross-section for observations at a theoretical pixel size below 0.5 mm or for a corresponding spatial reso-lution on the order of 1 mm, respectively. Since intact (biological) specimens are typically larger than 1 mm, this constraint prevents non-destructive investigations in the micrometer and submicrometer regime.
A straightforward approach to tackle this limitation is to focus exclusively on a fraction of the specimen by cut-ting it physically to a size smaller than the maximal FOV. To evaluate this first approach for bone tissue, we excised a cortical sector from the femoral mid-diaphysis of a mouse using a scalpel. The bone section was then measured at the X-ray Tomographic Microscopy (XTM) station w29x of the Materials Science (MS) beamline at the Swiss Light Source (SLS) at a theoretical pixel size of 350 nm. A reconstructed slice of the cortical bone is shown in Figure 1A and B, where the canal network and the osteocyte lacunar system are clearly visible. At the same time, Figure 1A illustrates that cutting the bone tis-sue causes initiation and progression of fractures, which eventually lead to the separation of bone fragments and which are in diametrical opposition to the advantage of
CT as a non-destructive imaging technique. Moreover, the selection and mechanical dissection of a predefined bone site becomes a challenging task for sample dimen-sions of a few hundred micrometers only. Finally, the integrity of bone specimens cut for CT measurement is destroyed and any subsequent histomorphometric examination is precluded at the outset. For all these rea-sons, mechanical reduction of the sample size as pre-sented beforehand is undesirable for submicrometer SR CT.
Here, we present an alternative strategy, where we developed a post-processing technique for non-destruc-tive local SR CT operating at a theoretical pixel size in the submicrometer regime, which can be implemented for tomographic data sets of already existing experimen-tal stations dedicated to SR CT. In our experimenexperimen-tal local CT setup, the specimen was bigger than the FOV per-pendicular to the rotation axis and therefore only a por-tion of the whole sample was assessed. This allowed for high-resolution CT without destruction of the specimen. However, the major problem with local CT measurements is the loss of information required by theory for a proper reconstruction of the specimen’s density function, which is a direct consequence of the partial recording of the sample projections. In contrast, the sample projections are captured entirely in the case of a standard (i.e., glob-al) CT setup, and correct reconstruction of the specimen is feasible w14x. In this regard, several mathematical local tomographic methods have been derived to localize the reconstruction w10x, which entail only integrals over lines close to the point to be reconstructed. However, these local tomographic methods never reconstruct the original density function of the specimen, but only related func-tions which behave similarly. Especially for hard tissues, i.e., for highly absorbing X-ray materials, such as bone, residual contrast errors (contrast anomalies) within the reconstructed images can hamper their interpretation w5x. Furthermore, mathematical local tomographic methods
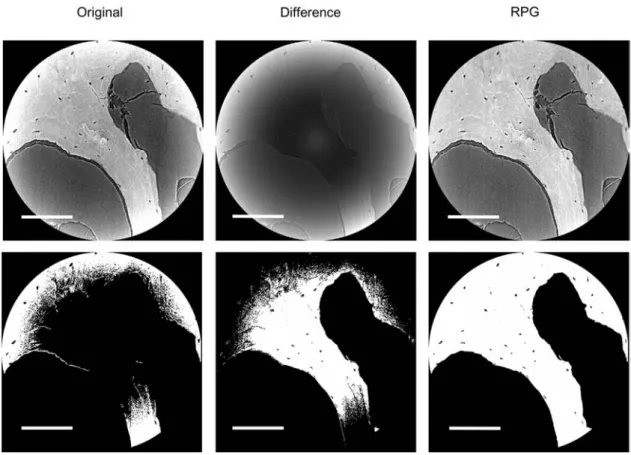
Figure 2 Radial gray value profile correction for local synchrotron radiation-based CT.
(Upper and lower row) All scale bars are 200mm. (Upper row) Gray-valued reconstructions and (lower row) binarized reconstructions after global thresholding. (Original) Reconstructed slice of the trabecular compartment of a canine lumbar vertebra. The effect of increased gray values for larger radial distances from the reconstruction center (midpoint) is called ‘‘cupping’’ and is due to the local tomographic measurement setup. Segmentation by global thresholding was not successful due to cupping. (RPG) Reconstructed slice after radial polynomial gradient (RPG) correction. The radial gray value profile became flat compared to the original reconstruc-tion. Bone segmentation using global thresholding was now feasible due to the implemented RPG correcreconstruc-tion. (Difference) The dif-ference between the original and the corrected reconstructions shows the effect of cupping. (Animals and methods) The beagle dog was raised at Indiana University School of Medicine’s Assessment of Laboratory Animal Care-accredited facility (Indianapolis, IN, USA) and was sacrificed at the age of 1 year. The cranial portion of the third lumbar vertebra (L3) of the dog was dissected and stored for analysis. All procedures were approved by the Indiana University School of Medicine Animal Care and Use Committee. The measurement protocol is given in the caption of Figure 1, where the data were additionally binned twice to increase the signal-to-noise ratio, resulting in a theoretical pixel size of 700 nm.
have not been established as a standard method up to now, such as the conventional filtered backprojection (FBP) for global CT as introduced by Shepp and Logan w25x. For these reasons, they have been used only infre-quently for medical imaging w2, 16, 28x and will not be investigated further in this study.
In this study, we introduced a pragmatic method cor-recting for cupping w9x. Cupping is the most prominent contrast anomaly in local tomographic data sets recon-structed using FBP, as in this study. More precisely, this refers to the effect that for local CT measurements, frac-tions of the sample outside of the FOV are not recon-structed, but add image energy during FBP, which finally lead to a radial increase of the gray values towards the edge of the reconstruction circle. This effect is shown in Figure 2, where we measured the trabecular compart-ment of a canine lumbar vertebra with our local SR CT setup at a theoretical pixel size of 350 nm, including sub-sequent two-fold binning. For 3D analysis and visual-ization, segmentation of the gray scale image data is necessary. Nevertheless, typical segmentation schemes, such as global thresholding, fail when cupping is present
(Figure 2). As a consequence, morphometric quantifica-tion of the binarized bone ultrastructure is no longer feasible. There is no theoretical basis for determining analytically the necessary cupping correction w8x when using local tomography reconstruction theory w8–10x. For this reason, we heuristically quantified the cupping effect using cylindrical aluminum phantoms, which were meas-ured in a similar manner. The diameter of phantom 1 (0.5 mm) was chosen to be smaller than the lateral exten-sion of the FOV (0.76 mm), whereas phantom 2 (diameters1.5 mm) was designed to exceed the FOV. Accordingly, phantom 1 was measured using a conven-tional, i.e., global tomographic setup, while phantom 2 was measured locally. Cupping was quantified by cal-culating the gray value of phantom 2 depending on the distance from the reconstruction center (midpoint) and by averaging the obtained values for 1006 consecutive reconstructed slices. The resulting gray value profile was flat for phantom 1 as expected (Figure 3A). For phantom 2, cupping was described by a radial second degree poly-nomial gradient (RPG) with R2s0.99. For actual cupping correction, the coefficients of the RPG were determined
Figure 3 Radial gray value profiles of the phantoms including one reconstructed slice.
(A) Phantom 1, which was measured using a standard, i.e., glob-al tomographic setup since the radiglob-al extension (0.5 mm) was smaller than the lateral extension of the acquired projections (0.76 mm). (B) Phantom 2, which was measured using a local tomographic setup because the radial extension (1.5 mm) was bigger than the lateral extension of the acquired projections (0.76 mm). The radial gray value profile together with one recon-structed slice is shown for the original reconrecon-structed data set before (‘‘Original’’) and after (‘‘RPG’’) radial polynomial gradient (RPG) correction. The parabolic cupping of the uncorrected data set is visible, which is due to the local tomographic experimental setup.
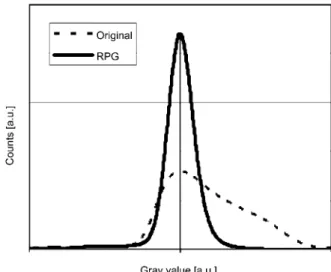
Figure 4 Histograms of the reconstructed phantom 2. Compared to the original reconstruction (‘‘Original’’) the distri-bution of the gray values after RPG correction (‘‘RPG’’) was bal-anced and narrowed, which demonstrates that the radial gradient caused by the local tomographic experimental setup was removed successfully, as previously indicated in Figure 3B.
Figure 5 Radial gray value profile within reconstructed bone tissue assessed by local synchrotron radiation-based CT. Radial gray value profile for the original reconstructed data set of the trabecular compartment of a canine lumbar vertebra is shown in Figure 2 (‘‘Original’’), and for the same data set after radial poly-nomial gradient (RPG) correction depicted in Figure 2 (‘‘RPG’’). The radial gray value profile of the original tomographic data set (‘‘Original’’) described by a second degree polynomial became flat after RPG correction (‘‘RPG’’).
by an implementation of the Levenberg-Marquardt non-linear least squares algorithm w18x. Subsequently, the cal-culated polynomial was used to remove the RPG within the original reconstructions from local CT measurements. Figure 3B illustrates the parabolic and the flat gray value profile of phantom 2 before and after RPG correction, respectively. In addition, the histograms of phantom 2 before and after RPG correction are given in Figure 4. Based on these histograms, Pearson’s first coefficient of skewness wskewPearson,1s(mean-mode)/standard devia-tionx as a measure of asymmetry and the kurtosis (kurt) as a measure of peakedness were calculated. The lop-sided histogram (skewPearson,1s0.52) of the uncorrected phantom 2 (Figure 4, ‘‘Original’’) caused by the radial gradient was successfully balanced (skewPearson,1s-0.06) after RPG correction (Figure 4, ‘‘RPG’’). Furthermore, the
kurtosis of the originally reconstructed phantom 2 (kurts6.98) was increased by a multiple after correction (kurts40.77), reflecting the homogenization of the gray value distribution shown in Figure 3B. A similar cupping behavior (R2s0.99) was found for the trabecular com-partment of a canine lumbar vertebra (Figure 2), where 256 consecutive reconstructed slices were averaged. To verify this result, we scanned the mid-diaphyseal cortical bone of seven C3.B6-Ghrhrlit/J (C3.B6-lit/lit) mouse spec-imens at four different anatomical sites (anterior, pos-terior, lateral, and medial) with the same setup and we evaluated the gray value profile of all 28 measurements in a similar manner. For all these data sets, the radial gray
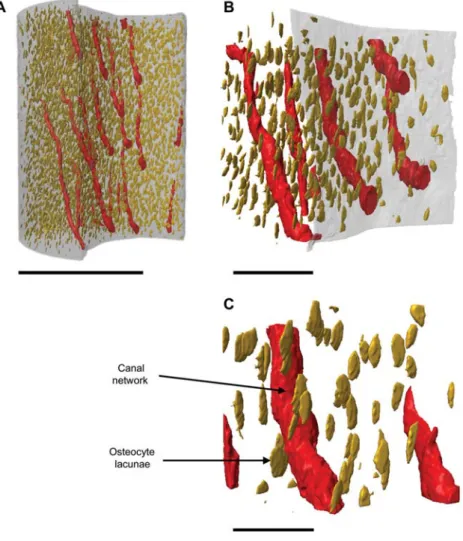
Figure 6 Ultrastructural phenotypes within murine cortical bone.
(A–C) The image shows the canal network (tubes in red) and osteocyte lacunae (prolate ellipsoids in yellow) within the femoral mid-diaphysis of a C3.B6-Ghrhrlit/J (C3.B6-lit/lit) mouse at different length scales. Scale bars are 500mm, 50mm, and 25mm for panels
A, B, and C, respectively. (Animals and methods) Seven C3.B6-lit/lit mice were provided by The Jackson Laboratory (Bar Harbor, ME, USA), respectively. Upon necropsy at 16 weeks one femur of each specimen was dissected and stored for analysis. All animal procedures were approved by the Jackson Laboratory’s Animal Care and Use Committee. The measurement protocol is given in the caption of Figure 1, where the data were additionally binned twice to increase the signal-to-noise ratio, resulting in a theoretical pixel size of 700 nm. Additionally, iterative global thresholding w17x provided binarized data sets separating bone matrix from soft tissue and air. Negative imaging was previously described w24x and was applied here to assess the porosity within murine cortical bone. In this context, negative imaging denotes the technique to first measure the matrix of a porous structure using CT, and subsequently to extract the enclosed porosity as a negative imprint of the surrounding matrix. In this study, the extraction of the cortical void spaces comprised a combination of different image processing procedures using IPL software (Scanco Medical AG, Bru¨ttisellen, Switzerland), including morphological operators. They were optimized to extract the canal network and the osteocyte lacunar system within cortical bone as two separate phases.
value profile could be characterized by a second degree polynomial (0.98FR2F0.99) similar to that previously found for the phantom and the canine vertebral bone. In a next step, we performed the RPG correction for the reconstructed canine trabecular bone compartment. In comparison with the original reconstruction (Figure 2, ‘‘Original’’), the radial gray value profile became flat, which is illustrated in Figure 5. Finally, global thresholding yielded accurate segmentation (Figure 2, ‘‘RPG’’) and allowed for potential quantitative morphometric analysis of the bone ultrastructure. To summarize these results, a post-processing technique for local SR CT was devised, which provides for the first time a method for the non-destructive assessment and quantitative evaluation of hard tissues in the submicrometer domain for reasonably sized specimens.
As a first application of the novel technique for local SR CT, we addressed our original problem, where the ultrastructural examination of murine bone failed because of deterioration of the bone tissue owing to mechanical cutting, which was a requirement for conventional, i.e., global CT in the submicrometer regime. We measured locally the femoral mid-diaphysis of one C3.B6-lit/lit mouse and disentangled the intracortical porosity into the canal network and the osteocyte lacunar system as previously described w24x. Figure 6A–C reveals the close entanglement of the canal network (tubes in red) and the osteocyte lacunae (prolate ellipsoids in yellow) within cor-tical bone (semitransparent envelope). Prepared in this manner, the canal network and the osteocyte lacunar system are ready for quantitative morphometry and with that they constitute ultrastructural phenotypes, which are
inaccessible to date in 3D and without image artifacts using traditional imaging methods, such as histology and confocal laser scanning microscopy. Consequently, the delineated strategy for local submicrometer SR CT push-es the frontiers of 3D quantitative morphometry to the cellular level in biological samples of relevant object size. In addition, our approach is applicable to new develop-ments towards nano-computed tomography w3, 30x and therefore provides the prerequisite for non-destructive and quantitative 3D investigations of hard tissues with unprecedented resolutions of 100 nm and below.
The technical problem of cupping is quite prominent in the CT literature. Laterally clipped CT data pose a prob-lem in clinical CT or positron emission tomography, where large patients tend to exceed the 50 cm diameter of today’s scanners FOV. The state-of-the-art solution to this clipping problem is to extend the projection data lat-erally and to extrapolate the data smoothly down to zero w11, 19, 22, 27x. All these methods were based on raw data (projections) and they were developed for polychro-matic clinical cone beam CT, where the absorption and geometry of the patient’s truncated adipose tissue out-side of the FOV is estimated. Another raw data-based method w13x to correct for cupping induced by scattering and beam hardening strives to linearize the X-ray atten-uation using a pre-correction function, which is deter-mined using a calibration scan of a homogeneous phantom. In contrast to these methods, our correction has been developed for data sets of monochromatic SR-based parallel CT applied to hard tissues, such as bone in the submicrometer regime, where scattering and beam hardening is not an issue and where no prior phantom data are required. Furthermore, our correction for cup-ping caused by a local tomographic setup is applied on reconstructed and not on raw data, which is why it is a straightforward method to implement. The only compar-able post-reconstruction method found in the literature was specifically designed for cone beam breast CT w1x, where the focus was to design a correction for the back-ground uniformities due to scattering.
As a limitation of our approach, it should be noted that the presented correction method for cupping artifacts induced by a local tomographic setup is by a design well suited for objects with a rather uniform X-ray attenuation distribution, such as cortical bone. Consequently, SR CT measurements of highly heterogeneous phantoms should be performed in the future to quantify to what extent the application of the proposed method can be expanded to objects with a more complicated X-ray attenuation distribution.
In conclusion, a correction algorithm for local SR CT has been devised which tackles for the first time the existing object size limitation encountered in convention-al CT setups for submicrometer imaging of hard tissues. Our technique offers a strategy for SR CT assessment and quantitative analysis of intact specimens larger in size than the reconstruction circle in a truly 3D fashion and at unprecedented resolutions in the submicrometer regime.
Acknowledgements
We are indebted to Dr. Leah Rae Donahue for contributing the mice and we thank Dr. Matthew R. Allen and Dr. David B. Burr
for providing the canine bone specimen. Furthermore, we would like to thank Peter Schwilch for the manufacturing of the phan-toms. This study was supported by the Swiss National Science Foundation (SNF) through the SNF Professorship in Bioengineer-ing (FP 620-58097.99 and PP-104317/1).
References
w1x Altunbas MC, Shaw CC, Chen L, et al. A post-reconstruc-tion method to correct cupping artifacts in cone beam breast computed tomography. Med Phys 2007; 34: 3109–3118.
w2x Anastasio MA, Shi DX, Pan XC, Pelizzari C, Munro P. A preliminary investigation of local tomography for mega-voltage CT imaging. Med Phys 2003; 30: 2969–2980. w3x Baruchel J, Buffiere JY, Cloetens P, et al. Advances in
syn-chrotron radiation microtomography. Scr Mater 2006; 55: 41–46.
w4x Bousson V, Peyrin F, Bergot C, Hausard M, Sautet A, Lare-do JD. Cortical bone in the human femoral neck: three-dimensional appearance and porosity using synchrotron radiation. J Bone Miner Res 2004; 19: 794–801.
w5x Chun IK, Cho MH, Lee SC, Cho MH, Lee SY. X-ray micro-tomography system for small-animal imaging with zoom-in imagzoom-ing capability. Phys Med Biol 2004; 49: 3889–3902. w6x Cooper DM, Turinsky AL, Sensen CW, Hallgrimsson B. Quantitative 3D analysis of the canal network in cortical bone by micro-computed tomography. Anat Rec B New Anat 2003; 274: 169–179.
w7x Donoghue PCJ, Bengtson S, Dong XP, et al. Synchrotron X-ray tomographic microscopy of fossil embryos. Nature 2006; 442: 680–683.
w8x Faridani A, Ritman EL, Smith KT. Examples of local tomo-graphy. SIAM J Appl Math 1992; 52: 1193–1198. w9x Faridani A, Finch DV, Ritman EL, Smith KT. Local
tomo-graphy II. SIAM J Appl Math 1997; 57: 1095–1127. w10x Faridani A, Buglione KA, Huabsomboon P, Iancu OD,
McGrath J. Introduction to local tomography. In: Quinto ET, Ehrenpreis L, Faridani A, Gonzalez F, Grinberg E, editors. Radon transforms and tomography. Contemporary math-ematics, vol. 278. Providence, RI: American Mathematical Society 2001: 29–47.
w11x Hsieh J, Chao E, Thibault J, et al. A novel reconstruction algorithm to extend the CT scan field-of-view. Med Phys 2004; 31: 2385–2391.
w12x Jones AC, Sheppard AP, Sok RM, et al. Three-dimensional analysis of cortical bone structure using X-ray micro-com-puted tomography. Physica A 2004; 339: 125–130. w13x Kachelriess M, Sourbelle K, Kalender WA. Empirical
cupp-ing correction: a first-order raw data precorrection for cone-beam computed tomography. Med Phys 2006; 33: 1269–1274.
w14x Kak AC, Slaney M. Principles of Computerized Tomogra-phic Imaging. New York: IEEE Press 1988.
w15x Koch A, Raven C, Spanne P, Snigirev A. X-ray imaging with submicrometer resolution employing transparent lumines-cent screens. J Opt Soc Am A Opt Image Sci Vis 1998; 15: 1940–1951.
w16x Laib A, Ru¨egsegger P. Local X-ray tomography for in vivo bone structure examinations. Med Phys 1999; 26: 447– 452.
w17x Leung CK, Lam FK. Performance analysis for a class of iterative image thresholding algorithms. Pattern Recognit 1996; 29: 1523–1530.
w18x Lourakis MIA. levmar: Levenberg-Marquardt nonlinear least squares algorithms in C/Cqq. http://www.ics. forth.gr/;lourakis/levmar/; version 2.1.3.
w19x Maltz JS, Bose S, Shukla HP, Bani-Hashemi AR. CT trun-cation artifact removal using water-equivalent thicknesses derived from truncated projection data. Conf Proc IEEE Eng Med Biol Soc 2007; 2007: 2907–2911.
w20x Martin T, Koch A. Recent developments in X-ray imaging with micrometer spatial resolution. J Synchrotron Radiat 2006; 13: 180–194.
w21x Mu¨ller R, Van Campenhout H, Van Damme B, et al. Mor-phometric analysis of human bone biopsies: a quantitative structural comparison of histological sections and micro-computed tomography. Bone 1998; 23: 59–66.
w22x Ohnesorge B, Flohr T, Schwarz K, Heiken JP, Bae KT. Effi-cient correction for CT image artifacts caused by objects extending outside the scan field of view. Med Phys 2000; 27: 39–46.
w23x Prymak O, Tiemann H, Sotje I, et al. Application of syn-chrotron-radiation-based computer microtomography (SRmicroCT) to selected biominerals: embryonic snails, statoliths of medusae, and human teeth. J Biol Inorg Chem 2005; 10: 688–695.
w24x Schneider P, Stauber M, Voide R, Stampanoni M, Donahue LR, Mu¨ller R. Ultrastructural properties in cortical bone vary greatly in two inbred strains of mice as assessed by synchrotron light based micro- and nano-CT. J Bone Miner Res 2007; 22: 1557–1570.
w25x Shepp LA, Logan BF. The Fourier reconstruction of a head section. IEEE Trans Nucl Sci 1974; 21: 21–43.
w26x Snigireva I, Snigirev A. X-ray microanalytical techniques based on synchrotron radiation. J Environ Monit 2006; 8: 33–42.
w27x Sourbelle K, Kachelriess M, Kalender WA. Reconstruction from truncated projections in CT using adaptive detrun-cation. Eur Radiol 2005; 15: 1008–1014.
w28x Spyra WJT, Faridani A, Smith KT, Ritman EL. Computed tomographic imaging of the coronary arterial tree – use of local tomography. IEEE Trans Med Imaging 1990; 9: 1–4. w29x Stampanoni M, Borchert G, Wyss P, et al. High resolution
X-ray detector for synchrotron-based microtomography. Nucl Instrum Methods Phys Res A 2002; 491: 291–301. w30x Stampanoni M, Borchert G, Abela R, Ru¨egsegger P.
Nano-tomography based on double asymmetrical Bragg diffrac-tion. Appl Phys Lett 2003; 82: 2922–2924.
w31x Thurner P, Mu¨ller R, Raeber G, Sennhauser U, Hubbell J. 3D morphology of cell cultures: a quantitative approach using micrometer synchrotron light tomography. Microsc Res Tech 2005; 66: 289–298.