Assessment of Different Electron Microscopy Techniques for Particle Size
Quantification of Potential Nanomaterials
Philipp Müller1, Johannes Mielke2, Vasile-Dan Hodoroaba2, Ralf Kägi3 and Martin Ryner4
1.
BASF SE, Department of Material Physics and Analytics, Ludwigshafen, Germany.
2.
BAM Federal Institute for Materials Research and Testing, Division 6.8 Surface Analysis and Interfacial Chemistry, Berlin, Germany.
3.
EAWAG aquatic research, Dübendorf, Switzerland.
4.
Vironova AB, Stockholm, Sweden.
While nano-scaled intermediate and consumer products are omnipresent in many industries, one challenge consists in the development of methods that reliably identify, characterize and quantify nanomaterials both as a substance and in various matrices. For product registration purposes, the European Commission proposed a definition for nanomaterial [1] which requires a quantitative size determination of the primary particles in a sample down to sizes of 1 nm. According to [1] a material is defined as nano if 50% of the primary particles are observed to comprise a smallest dimension <100 nm. The NanoDefine project [7] was set up to develop and validate a robust, readily implementable and cost-effective measurement approach to obtain a quantitative particle size distribution and to distinguish between nano and non-nano materials according to the definition [1]. Among the available particle sizing techniques, electron microscopy was found to be one option meeting most of the requirements of the regulation [2-4]. However, the use of electron microscopy for particle sizing is often limited by cost per sample, availability in industry, particle agglomeration/aggregation, extremely broad size distributions, 2D materials and operator bias in case of manual evaluation.
In the present study a matrix of substances carefully chosen to cover a maximum of industrial applications, shapes, material systems and size ranges were analyzed by electron microscopy in an inter-laboratory round robin exercise. Different electron microscopic techniques like conventional high-voltage Transmission Electron Microscopy (TEM), (Transmission) Scanning Electron Microscopy (SEM and TSEM) as well as tabletop SEM and a low-voltage tabletop TEM instrument (MiniTEM) [5] were evaluated. Sample preparation for electron microscopy was standardized according to dispersion protocols which were developed and tested separately for any sample within the labs of NanoDefine [7] by light scattering techniques and TEM images of undispersed material.
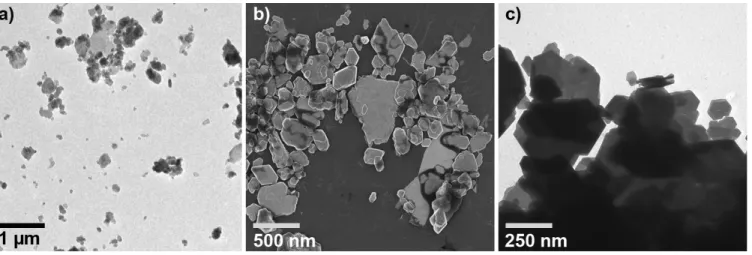
Figure 1 shows a comparison of electron microscopy images of a kaolin clay sample acquired by a) TEM, b) SEM and c) MiniTEM. In the present study ‘real’ world materials were included. Full dispersion was not always possible. Objective automated evaluation of the particle size distribution is therefore very difficult. For some of the samples a good dispersion of the primary particles was achieved. The size distribution of those samples was determined by image evaluation (e.g. iTEM software applying watershed algorithm [6] or custom code of Vironova [5] included in the MiniTEM operation system) and the results were compared between the authors labs and between the different electron microscopy image modalities. Figure 2 a) shows a MiniTEM image of an iron pigment consisting of agglomerated primary particles which challenges the possibility to unambiguously identify individual particles for size and shape quantification. Figure 2 b) gives an example of well dispersed polystyrene spheres which were evaluated by automated quantitative image analysis [6], classifying the particles into different size categories (different colors in Figure 2 b)).
The present study gives a comprehensive overview on recent development in the field of particle sizing by electron microscopy. Industry can benefit from advances in automated imaging and image evaluation
Paper No. 1200 2403
doi:10.1017/S1431927615012799 © Microscopy Society of America 2015
Microsc. Microanal. 21 (Suppl 3), 2015
https://doi.org/10.1017/S1431927615012799
as well as from new types of tabletop SEM and TEM solutions reducing some of the limitations of electron microscopy like cost, availability and operator bias. [7]
References:
[1] European Commission, Commission Recommendation of 18 October 2011 on the definition of nanomaterial, Official Journal of the European Union. 2011/696/EU (2011) p.38.
[2] TPJ Linsinger et al, JRC Reference Reports, 2012, DOI: 10.2787/63490 [3] PJ De Temmerman et al, J. Nanopart. Res. 16 (2014), p.2177.
[4] PJ De Temmerman et al, Powder Technology 261 (2014), p.191. [5] http://www.vironova.com/minitem
[6] iTEM 5.2 (Build 3554),Olympus (Tokyo, Japan)
[7] The research leading to these results has received funding from the European Union’s Seventh Framework Programme (FP7/2007-2013) under grant agreement n° 604347 – NanoDefine
(www.nanodefine.eu).
Figure 1. Electron microscopy images of kaolin clay. a) conventional TEM; b) conventional SEM;
c) miniTEM
Figure 2. Examples for automated image evaluation. a) MiniTEM image of iron pigment; primary
particles were not resolved and b) TEM image of polystyrene spheres separated by watershed algorithm
2404 Microsc. Microanal. 21 (Suppl 3), 2015
https://doi.org/10.1017/S1431927615012799