Electrostatic effects in proteins: comparison of dielectric and
charge models
E.L.Mehler1 and T.Solmajer2
Department of Structural Biology. Biocenter. University of Basel. CH-4056 Basel. Switzerland
'To whom correspondence should be addressed
2Permanent address- Boris Kidnc Institute of Chemistry. POB 30. 61115 Ljubljana, Slovenia. Yugoslavia
Two approaches for calculating electrostatic effects in proteins are compared and an analysis is presented of the dependence of calculated properties on the model used to define the charge distribution. Changes in electrostatic free energy have been calculated using a screened Coulomb potential (SCP) with a distance-dependent effective dielectric permittivity to model bulk solvent effects and a finite difference approach to solve the Poisson-Boltzmann (FDPB) equation. The properties calculated include shifts in dissociation constants of ionizable groups, the effect of annihilating surface charges on the binding of metals, and shifts in redox potentials due to changes in the charge of ionizable groups. In the proteins considered the charged sites are separated by 3 . 5 - 1 2 A. It is shown that for the systems studied in this distance range the SCP yields calculated values which are at least as accurate as those obtained from solution of the FDPB equation. In addition, in the distance range 3 - 5 A the SCP gives substantially better results than the FDPB equation. Possible sources of this difference between the two methods are discussed. Shifts in binding constants and redox potentials were calculated with several standard charge sets, and the resulting values show a variation of 20-40% between the 'best' and 'worst' cases. From this study it is concluded that in most applications, changes in electrostatic free energies can be calculated economically and reliably using an SCP approach with a single functional form of the screening function.
Key words: dissociation constants/electrostatic effects in
proteins/metal binding/redox potentials/solvent screening
Introduction
Results which have become available over the last few years have provided ample evidence for Perutz's (1978) observation concerning the importance of electrostatic interactions in controlling the structure and function of proteins. To describe electrostatic effects in proteins two different conceptual approaches, i.e. the microscopic or macroscopic, can be used. In the former the electrostatic interactions between molecular fragments are determined directly and the macroscopic properties are obtained by statistical averaging, while in the latter the equations of macroscopic electrostatics are used to calculate macroscopic properties. For proteins the microscopic approach has been most fully developed by Warshel and collaborators (e.g. Warshel and Russel, 1984). It has the advantage that, at least in principle, no arbitrary parameters are required and that
observed effects can be traced to their microscopic origins, thus providing the possibility of a detailed analysis of the relation-ship between structure and function.
In view of its obvious theoretical advantages there is general agreement that ultimately electrostatic phenomena in proteins will have to be described using the microscopic formulation. However, the computational complexity of this approach has motivated a continued development of methods based on the macroscopic formulation of electrostatics (for recent reviews see Matthew, 1985; Harvey, 1989; Sharp and Honig, 1990). Originally these methods were introduced and expanded in the early formulations of Adams (1916), Bjerrum (1923), Kirkwood (1934), Kirkwood and Westheimer (1938) and Tanford and Kirkwood (1957), and are based on the standard formulation (Nayfeh and Brussel, 1985) where matter is viewed as a continuous distribution of charge with discontinuous interfaces between different components.
To calculate the influence of electrostatic interactions on protein structure and function it is assumed that the electrostatic contribution to the free energy (Kirkwood and Westheimer, 1938) can be obtained from the formula
w = i E q,4>(r,) (1)
where qt is the net charge and <£ (r,) is the electrostatic potential
at the point r,. To evaluate w it is necessary to determine the potential, $ , and two approaches are currently being used to do this. In the first the Poisson-Boltzmann (PB) equations (McQuarrie, 1976),
V-[e(r) = -47re(r) (2)
is solved using numerical methods. All these methods map the relevant parameters, i.e. charge distribution, dielectric permit-tivity and ionic strength onto a three-dimensional grid. A finite difference algorithm using such a grid was described by Warwicker and Watson (1982), and subsequently was further developed and applied by Gilson and Honig (1987), Bashford
et al. (1988) and Schaefer and Froemmel (1990). In equation
(2) e(r) is the dielectric permittivity and x the Debye - Hueckel ionic screening constant.
An alternative to the above approach to macroscopic electro-statics is Debye's classical theory for static permittivity (Debye and Pauling, 1925; Debye, 1929) using the Lorentz expression for the local field (Lorentz, 1880; Nayfeh and Brussel, 1985). For excellent discussions of this approach see Bucher and Porter (1986) and Ehrenson (1989). The main objection to this theory is the lack of explicit boundaries between the components, and internal fields are calculated for locally homogeneously polarized matter (Ehrenson, 1989). However, Bucher and Porter (1986) and Ehrenson (1989) argue that this and other criticisms of this approach are not justified or at least are compensated by its simplicity. For this paper, the most important result of Debye's theory is that it yields radially dependent sigmoidal permittivity
profiles which approach the value of the solvent's dielectric permittivity asymptotically with increasing r (Bucher and Porter,
1986).
Using empirical arguments Mehler and Eichele (1984) derived a sigmoidal form of the radial permittivity function, e(r), and used a screened Coulombic potential (SCP), of the form
(3)
to calculate pK shifts of ionizable groups in nine different proteins. To account for ionic strength effects a simple Debye screening factor, exp(xr), was used (Hill, 1956). In spite of the promising success of the method (the errors in the calculated shifts were less than one pK unit in all cases) most authors have continued to solve the computationally more demanding PB equation for estimating electrostatic effects in proteins. Subsequently a somewhat different sigmoidal form of e(r) was also suggested by Lavery et al. (1986) and Hingerty et al. (1985) based on Debye's theory and other arguments.
In a recent analysis (Mehler, 1990) it was shown that for charges separated by 12 A or more, equation (3) using the form of e(r) proposed by Mehler and Eichele (1984) was at least as reliable in predicting pK shifts of ionizable groups as solving equation (2). It was argued, however, that for these large separations, e(r) was already approaching its asymptotic value, i.e. the bulk value, so that any large value of e would give reasonable results. No conclusions could be made from the results discussed in Mehler (1990) concerning the relative reliability of the two methods for charges closer than ~ 12 A.
In this paper we turn to an analysis of electrostatic interactions in the biologically more interesting region where charge separations lie between 3 and 12 A. The effects of charged groups on the pKs of ionizable groups, on the binding constants of metal containing proteins and on redox potentials were considered. The results are compared with experiment, and in some cases calculated values obtained from the SCP and finite difference Poisson -Boltzmann (FDPB) approaches are compared.
The approach used here is the same as in Mehler and Eichele (1984) and Mehler (1990). Thus crystallographic coordinates were used in all cases, and it is assumed that for purposes of the computations the molecules are rigid and the X-ray structure adequately represents the time-averaged solution structure. This assumption implies that there are no major conformational changes in solution, which appears to be the case for most (but not all) proteins. A recent analysis by Northrup et al. (1990) seems to support this assumption, although the authors also con-cluded that details of the electrostatic effects require a considera-tion of protein flexibility. Due to its simplicity, the SCP could be implemented in calculating the electrostatic component of the potential functions used in molecular mechanics and molecular dynamics simulations.
A drawback of applying macroscopic electrostatics to microscopic systems is that a number of more or less arbitrary parameters have to be determined before the calculation can be carried out. Required for both of the above methods is the availability of a set of atomic or fragment charges. The simplest set assigns integer charges to ionized groups localized at a single point and zero charge to all other groups, but most currently available simulation and electrostatics programs use partial charges for all the atoms of the system which, however, are different in each program. Since it has already been observed that electrostatic properties are sensitive to changes in the charges
(Van Belle et al., 1987), a number of different charge sets were compared and the results also are included in the analysis.
Materials and methods
In Mehler and Eichele (1984) it was argued that the pK shifts observed in enzymes resemble the shifts between the first and second dissociation constants of bifunctional organic acids and bases. Therefore one has
RT\n(KIK') = NAw = 2.3O3RTApK (4)
where Aw is the electrostatic contribution to the change in free energy between the original and final systems, i.e. Aw = w' —
w (or Af> = <!>'-<£) (Kirkwood and Westheimer, 1938). For
bifunctional organic acids and bases a large amount of experi-mental information is available, and using Bjerrum's (1923) formula, e = qq'IAwr, the radial dependence of e can be calculated. A compilation of this dependence was reported by Conway et al. (1951), who used data obtained by Debye (1925), Webb (1926) and Schwarzenbach (1936). A plot of this data (see Mehler and Eichele, 1984, Fig. 1) clearly exhibited the sigmoidal dependence of e on charge separation. Therefore the behavior of e was described by the differential equation
de/dr = X(e - A)(e0 - e)
with solution (Batschelet, 1971)
e(r) = A + Bl{\ + texp(-Xfir)]
(5)
(6) where B = e0 — A, e0 is the dielectric constant of water at
25°C, and A, X and k are parameters.
Two parameter sets for use in equation (6) were considered. The first was obtained from the compilation given by Conway
et al. (1951). This parametrization is denoted by ewds. A second
parameter set was proposed by Mehler and Eichele (1984) to partially account for the fact that in solution a protein encloses a microscopic region of low permittivity, where the effective shielding may be damped relative to the shielding in the solvent accessible regions. This latter parametrization was denoted by
8 0
6 0
20
-1 5 20
R(A)
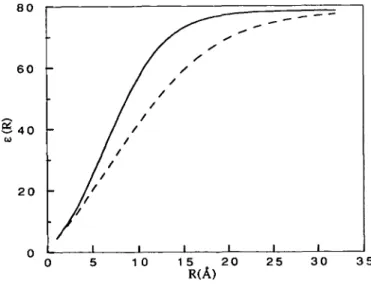
Fig. 1. Dielectric permittivity profile from equation (6). — (nrls: A = -8.5525. *: = 7.7839. X = 0.003627; — es: c0 = 78.4. A = -20.929. k = 3.4781, X = 0.001787.
es. The two permittivity profiles are given in Figure 1, and it
is seen that es increases more slowly than eK<h, but both curves
approach the same asymptotic value, i.e. e0.
The Poisson—Boltzmann equation is solved (Gilson and Honig, 1987) using the DelPhi (Biosym Technologies 10065 Barnes Canyon Rd, San Diego. CA 92121. USA) set of programs (Biosym version 2.1), with the standard INSIGHT/DISCOVERY (Biosym Technologies) charge set (Dauber-Osguthorpe et al.. 1988) and default parameters, except where stated otherwise. In particular, dielectric constants of 2 and 80 in the protein and solvent respectively, and an ion exclusion zone of 2 A (Stern layer) were used (Gilson et al., 1988).
Three commonly used atomic partial charge sets were used in the SCP calculations including the set from CHARMM (parameter set Par 19) (Brooks et al., 1983), GROMOS (van Gunsteren and Berendsen, 1987) and DISCOVER (Dauber-Osguthorpe et al., 1988). In addition integral charges on the ionized groups were used with the carboxylate charge located at the midpoint between the two oxygens, or at the central carbon.
Results
Dissociation constants
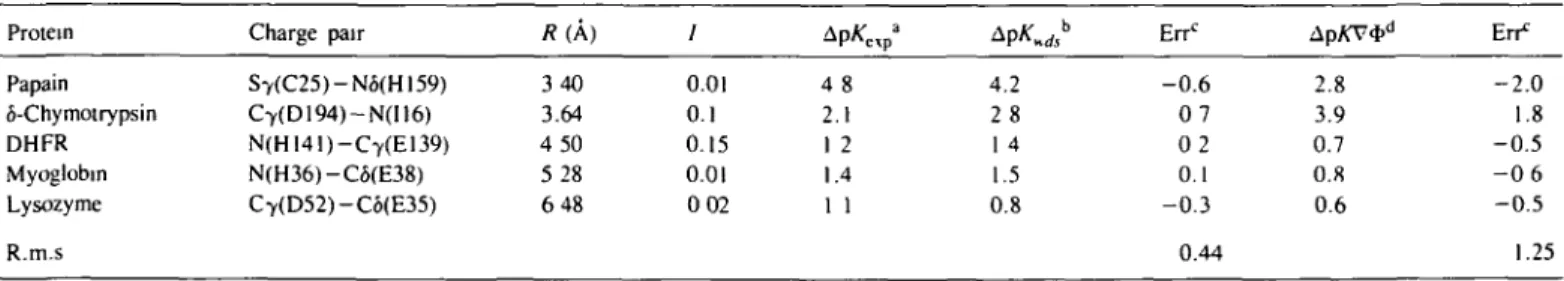
In Mehler and Eichele (1984) the shift in the dissociation constant of titratable groups due to a nearby charge was calculated for a number of proteins. These pK shifts have been recalculated using the FDPB approach and the results are given in Table I. The separation of the charges ranges from 3.4 to 6.5 A and it is clear that for the two smallest distances the FDPB values are substantially in error. The inability of the FDPB to yield reliable results at such close distances may be inherent to the numerical procedure, and using finer grids could yield improvements. It is of interest to note that Pickersgill (1988) obtained a pK shift of 2.3 for papain using the Warwicker and Watson (1982) algorithm with slightly different conditions. His value is in reasonable agreement with the shift obtained here using DelPhi (Gilson and Honig, 1987). Similarly, Sun etal. (1989) calculated the change in pKa of Glu35 upon neutralization of Asp52 for the lysozyme active site and obtained the value 0.8 using a slightly modified version of the Klapper et al. (1986) algorithm which is in satisfactory agreement with the value of 0.6 computed using DelPhi.
In dihydrofolate reductase the distance has increased to 4.5 A and the result obtained from the FDPB is considerably improved, and as the distances increase further the errors between calculated and experimental ApK obtained from the two methods are much closer. Nevertheless, the r.m.s. deviation of the calculated shifts is - 0 . 5 and 1.2 pK units from the SCP and FDPB, respectively.
Binding of calcium in calbindin Dgk
Calbindin D ^ is a small calcium-binding protein belonging to the calmodulin family (Kretsinger, 1987) with two Ca2+-binding
sites exhibiting the typical a-helix-binding loop-a-helix EF-hand structural motif (Kretsinger and Nockolds, 1973). The crystal structure of calbindin with both Ca bound has been determined to a resolution of 2.3 A (Szebenyi and Moffat, 1986). The EF-hands of this protein are characterized by a highly asymmetric arrangement of the negatively charged residues coordinated to the Ca2+ and several additional negatively charged amino acid
residues which lie within 12 A of the Ca sites.
To study the effects of electrostatic interactions on the binding of Ca2+ in calbindin, Linse et al. (1991) have measured the
binding constants of both Ca ions in the wild-type protein and eight mutants at several ionic strengths. The mutations replace surface carboxylates within a range of 5 - 1 2 A from the Ca2 +
ions with the amides, and the effect of the mutations on the bind-ing of the two calciums shifts the product KtK2 by UP t 0 f>ve
orders of magnitude. Here Kx and K2 are the binding constants
of the first and second Ca2+ regardless of which site is
occupied. The mutations studied by Linse et al. (1991) were E17Q, D19N, E26Q and E60Q. For the first three, all single, double and triple mutants were synthesized. The large changes in the binding constants of the mutants makes these measurements an excellent basis for evaluating electrostatic theories, and an initial comparison recently was reported by Svensson et al. (1990). These authors developed a very simple electrostatic model and used Monte Carlo (MC) simulations to calculate the pK shifts. Their calculated results were in excellent agreement with the observed values, with the exception of E60Q which showed a considerably larger error. The authors suggested that this may be due to uncertainty in the coordinates of the mutated group (see Table I and Fig. 2 in Svensson et al., 1990; and Ahlstroem
et al., 1989). In agreement with their results, all our
calcula-tions gave a pA" shift for E60Q which deviated substantially from the measured value, and this mutant was not included in the analysis.
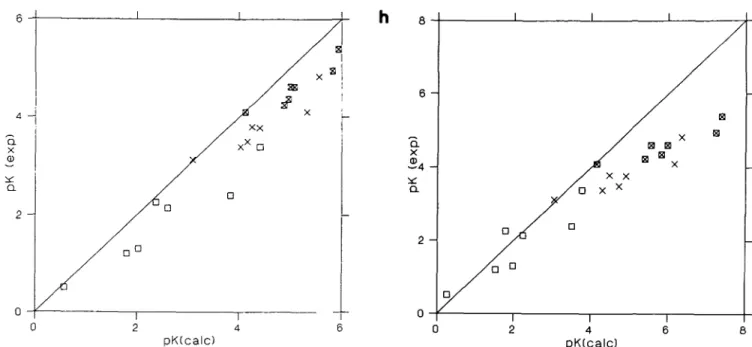
The SCP approach has been used to calculate the shifts in the binding constants resulting from the above mutations using several different charge sets, and in addition, one set was used to calculate the shifts using the FDPB equation. The results of the calculations are presented in Figure 2, and a complete error analysis at each ionic strength and for the combined values from each charge model is given in Table II. Since the SCP approach cannot provide absolute values of binding constants, the shifts in pK were calculated for each mutation relative to the wild type (WT) at the given ionic strength. To obtain a common point of reference the experimental shift of the WT at the given ionic strength (Linse
Table I. Shift in Protein Papain S-Chymotrypsin DHFR Myoglobm Lysozyme R.m.s
dissociation constant of ionizable Charge pair S7(C25)-N6(H159) C7(D194)-N(I16) N(HI41)-C7(E139) N(H36)-C6(E38) Cy(D52)-C6(E35) groups R(A) 340 3.64 4 50 5 28 6 48 / 0.01 0.1 0.15 0.01 0 02 4 8 2.1 1 2 1.4 1 1 4.2 2 8 1 4 1.5 0.8 Errc - 0 . 6 0 7 0 2 0.1 - 0 . 3 0.44 ApKV*" 2.8 3.9 0.7 0.8 0.6 En* - 2 . 0 1.8 - 0 . 5 - 0 6 - 0 . 5 1.25
aSee Mehler and Eichele (1984) for references. bApK calculated using eKds.
cErr = Ap/«calc) -ApAf(exp) dDelphi, Gilson and Honig (1987)
a
6e
pK(calc)
4 pK(calc)
Fig. 2. Comparison of calculated versus experimental values for ApK^2 in calbindin. D , / = 0.0. x , / = 0.05; K, / = 0.15. (a) SCP with CHARMM* charge set. (b) SCP with GROMOS charge set; (c) SCP with Q:O-O; integer charges located midway between carboxyl O; (d) SCP with CHARMM charge set; (e) SCP with DISCOVER* charge set; (f) SCP with Q:C, as (c) but charge located on carboxyl C; (g) SCP with DISCOVER charge set; (h) DelPhi with DISCOVER charge set. Asterisk denotes charge on Ca of 1.626 (see text)
Table II. Error
Source of charges CHARMM*b GROMOSC MCd QO-Oe CHARMMf DISCOVR« Q:Ch DISCOVER1 DelPhi) analysis between
/ - o
r m.s.a 0.28 0 26 0.28 0 32 041 0.34 0.61 0 77 0 56 calculated Mean -0.13 0.06 -0.22 0.18 0.28 0.25 0 48 0 63 0.27and measured ApKjK2
a 0.27 0.27 0 19 0.29 0.32 0.25 0.40 0 49 0 54 / = 0.05 r m.s.a 0.19 0.24 0 20 0.30 0 37 0.41 0.53 0.71 1.24 in calbindin Mean 0.08 0 15 0.14 0.24 031 0.33 0.46 0.62 1 07 D9k a 0.19 0.20 0.16 0.20 0 22 0.25 0.29 0.34 0 67 / = 0 15 r.m.s.a 0.16 0.17 0.24 0.22 0.28 0.34 0.38 0.55 1.49 Mean 0.07 0.11 0.19 0.17 0 23 0 30 0.34 0.49 1.32 a 0.16 0.15 0 15 0.15 0.16 0.19 0.20 0.26 0.73 Total r.m.s.a 0.22 0.23 0 24 0.28 0 36 0.37 0.52 0.68 1.16 Mean 0.01 0 11 0.04 0.19 0.27 0.29 0.43 0.58 0.89 a 0.23 021 0.25 0.21 0.23 0.22 0 30 0.37 0 77 "Deviation between experimental (Linse ei al., 1991) and calculated shift, a is the standard deviation
bCHARMM (par!9) charge set with Ca charge = 1 626. CGROMOS charge set.
dMonte Carlo calculation (Svensson a al , 1990). cInteger charge located midway between carboxyl O. f As1", Ca charge = 2.
^DISCOVER charge set. charge on Ca is 1.626 (Hori el al., 1988). h As c, but charges on carboxyl C.
1 As g, Ca charge = 2. ' Gilson and Honig, 1987.
et al., 1991) was added to the calculated shifts to yield the final
ApK]K2. The same procedure was used for the FDPB
calcula-tions. Thus the values reported in Figure 2 are relative to the WT at zero ionic strength. For most of the calculations the formal charge of 2 was used for each Ca, but for the CHARMM and DISCOVER charge sets a reduced charge of 1.626 was also tried (Figure 2a and e, and the two sets of results denoted with an asterisk in Table II). This reduced value was determined by Hori
et al. (1988) from fitting the results of abinitio quantum chemical
calculations to the CHARMM force field. This reduction in the formal charge is due to the effect of charge transfer in the in-teraction between Ca2+ and its coordinated ligands. In addition
to the partial charges, integer charges (0, — 1) were also used,
either located at the midpoint between the two oxygens of the carboxylate moiety or on the carboxyl carbon atom.
Figure 2(a) shows that the CHARMM charge set with the reduced charge on the Ca ions gives almost perfect agreement between experimental and calculated ApA",A"2 values. The r.m.s.
errors (Table II) from CHARMM* and GROMOS (Figure 2b) as well as the MC simulation (Svensson et al., 1990), are all small and the differences are marginal. For the remaining charge sets the calculated ApK^K2 values exhibit some sensitivity to the
model used for defining the charges, but nevertheless the r.m.s. errors remain substantially < 1 pK unit for all cases. Figure 2(a-g) and the standard deviations and means given in Table II also show that with increasing r.m.s. error there is a tendency
to overestimate the pK shifts. However, it is also clear that the points in each plot can be fitted reasonably well to a straight line, and in most cases the fitted line will only shift the diagonal slightly to the right without a substantial change in slope (see mean values and standard deviations, Table II).
Although all the charge sets give reasonably accurate results (error < 1 pK unit), the sensitivity of the calculated ApKtK2 to
the charges which is exhibited in Table II, leads to several observations. First, it appears that the charge on the metal ion should be fitted to the protein charge set to effectively account for charge transfer effects. The improvement using the DISCOVER charges and the reduced Ca charge is substantial, in spite of the fact that the value used for Ca was not fitted to these charges (Hori et al., 1988). Another point is that increasing the delocalization of the electronic charge in the charged groups does not necessarily improve the results. Thus, the DISCOVER charges, which are most delocalized of the sets used here, gives the poorest results. This is most likely due to the fact that the net atomic charges are not observable properties of a molecular system, and therefore there is no a priori 'best' algorithm for their calculation. Because of the arbitrariness in defining net partial atomic charges, the fact that a given set of charges 'resembles' the quantum chemical charge distribution of an isolated molecular fragment better than another charge set does not guarantee that it will give better results in an application to a particular macromolecular system.
The calculated values of ApK\K2 obtained from solution of the
FDPB equation are somewhat more difficult to understand. From Table II and Figure 2(h) it is seen that for / = 0, the calculated shifts are quite reasonable, but for both / = 0.05 and 0.15 the r.m.s. errors are larger than 1 pK unit. Figure 2(h) shows that the problem is not just a shift of the values calculated for the nonzero ionic strengths since each group of seven points would fit a straight line with a completely different slope. Svensson et al. (1990) attempted to account for the ionic strength effects using the linearized PB equation with the assumption that ionic screening penetrates throughout the protein. For / = 0.05 they obtained a shift which was too large and they attributed this to the improper accounting of the protein excluded volume. Examination of the calculated shifts due to the mutations shows, however, that the ionic strength has very little effect, and the values obtained with / > 0 are practically the same as for / = 0. Thus for the mutation E17Q at / = 0 the calculated (experimental) shift is 1.53 (1.21) and for/ = 0.15 it is 1.40 (0.24). It appears that with a Stern layer of 2 A which is the suggested value (Gilson
et al., 1988) the ionic screening is considerably underestimated. Redox potential of cytochrome c551
Cytochrome c551 is a small (82 amino acid residues) haem-binding protein for which the crystal structure has been determined to 1.6 A resolution (Matsuura et al., 1982). The two propionic groups attached to the haem are buried at least 5 A beneath the protein's surface, and in the pH range 5 - 9 one of them is ionized, causing a shift in the redox potential of 65 mV (Moore, 1983) which appears to be independent of ionic strength [measurements were carried out at / =0.007 and 0.1 M and both ionic strengths yielded similar results (Moore et al., 1980)]. The
pK3 of the titrated propionate changes from a value of 7.3 in the
reduced form to 6.2 in the oxidized state (Moore et al, 1980; Moore, 1983). In addition, the conformation of the protein seems to be fairly stable to the ionization and to changes in electrostatic interactions generally, as can be seen from the similarity of the oxidized and reduced X-ray structures (Moore et al., 1980; Matsuura et al., 1982).
Rogers et al. (1985) applied several electrostatic models to calculate the shift in redox potential including the Warwicker and Watson (1982) algorithm for the FDPB equation. Here we use the SCP approach to calculate the shift in dissociation constant of the buried propionate group with change in oxidation state, and the effect of ionization of the carboxyl group on the redox potential. The calculations were carried out with several of the charge models used for the calbindin calculations, and the results are presented in Table III.
In the examples we discussed above, the charged sites were located on either the protein surface or other water-accessible regions, and the full effect of solvent screening (at the given charge separation) was operative as well as the ionic screening effects. Thus only the screening function ewds was used in the
calculation and the presence of ions was fully accounted for. In cytochrome c55J the situation is different since the charges are in the protein interior. The observed insensitivity of the shift in the redox potential to changes in ionic strength (Moore et al., 1980) shows that in the present case ionic screening does not affect the electrostatic interactions in the interior of the protein and for the SCP calculations we have taken 1=0. The pA" and redox shifts were calculated with both ewds and e,, since the latter
may prove to be more appropriate in the present case (Mehler and Eichele, 1984).
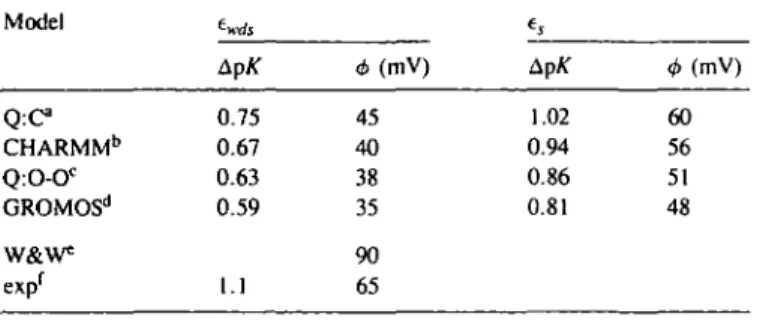
The results given in Table III show some sensitivity to the particular charge model with a difference of ~ 10 mV between the 'best' and 'worst' charge set. It is also clear that the scaled screening, es, gives substantially better results than ewds which
indicates that in the protein interior the full screening effect of the solvent is reduced. However, the value of e^ is certainly not as small as often assumed for protein interiors, but its value for an 8 A separation between charged sites is ~ 33 as compared to 45 for ewds. The mean value of A<j> from the four charge
models is 40 and 54 mV, using ewds and es respectively. Thus
the error using the full screening is about the same as that found from the solution of the FDPB equation. Using the scaled screening improves the calculated redox shift considerably, reducing the error from 25 to 11 mV. The same pattern is observed for the shift in the pK of the propionate group. The error in the calculated shift varies between 0.5 and 0.1 p^units. A recent study on the effect of charged groups on the redox potential of cytochrome c investigated the effects of mutating an arginine located ~ 10.5 A from the redox centre (Cutler et al., 1989). This system appears to be more complicated than cytochrome c551 since several mutations (including Arg to Lys)
Table ID. Cytochrome c55i pK shift and changes in redox potential Model t^j, t. Q : C CHARMMb Q:O-OC GROMOSd W&W* exp' ApK 0.75 0.67 0.63 0.59 1.1 <b (mV) 45 40 38 35 90 65 Ap/T 1.02 0.94 0.86 0.81 <MmV) 60 56 51 48
integer charges located on carboxyl C. bCHARMM (par 19) charge set.
clnteger charges located midway between carboxyl O. dGROMOS charge set.
eRogers et al. (1985) using Warwicker and Watson (1982) algorithm. fExperimental pAf shift (Moore et al.. 1980: Moore, 1983).
gave different values for the shift in the redox potential. For the mutation Arg to Leu a shift of 41 mV was observed and a value of 48 mV was calculated (Cutler et al., 1989) using the free energy perturbation approach including polarization which has been developed by Warshel et al. (Warshel and Russel. 1984; Warshel and Sussman, 1986; Warshel et al., 1986; Hwang and Warshel, 1987). In a preliminary calculation using only integral point charges with scaled screening, es, and assuming that there
is no ionic strength effect, the SCP model yields ~ 30 mV for the shift resulting from annihilation of the positive charge.
Discussion and conclusions
It has been shown empirically that a variety of properties in proteins which are determined by electrostatic interactions can be reasonably well calculated using a screened coulombic potential. In contradiction to previous assumptions (Harvey, 1989), a single functional form seems to be effective in accounting for these interactions in a sufficiently reliable way in different systems and for different interactions in the same system. From the spherical symmetry of e(r) it also appears that electrostatic interactions in proteins are not nearly as sensitive to shape as commonly thought. Moreover, the results obtained here are clearly in agreement with Northrup et al. (1990), that the rigid molecule assumption seems to be reliable in most cases. The calculations presented here and previously, also show that in nearly all cases the SCP model yields results at least as reliable as those obtained from a numerical solution of the PB equation. One of the interesting aspects of the SCP model is that it appears to yield useful results in a range of separations where the FDPB is in error, i.e. in the approximate interval 3 A <
r < 5 A. Although the errors in the calculated $K shifts
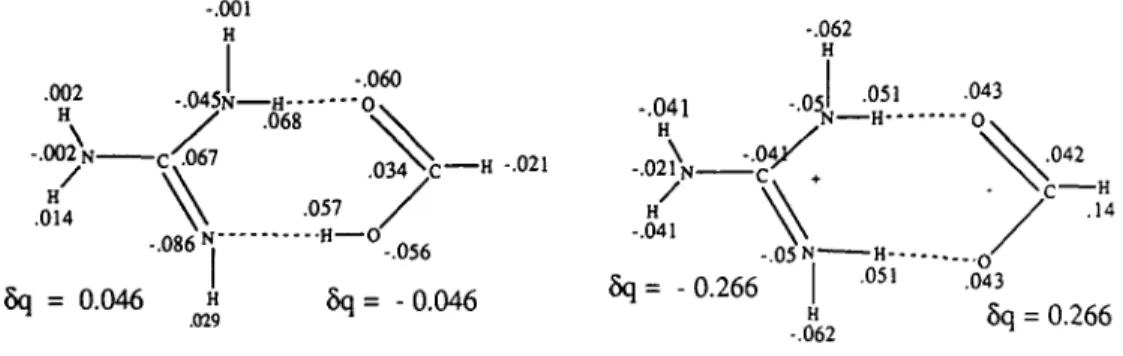
obtain-ed with the FDPB may be numerical in origin, it seems that a more fundamental problem is also involved. For ion pairs where the fragments are separated between 3 and 4 A, nonelectrostatic interactions make a considerable contribution. In particular charge transfer effects can become important. This can be seen from Figure 3 which depicts the interaction of guanidine with formic acid for both the uncharged state and when the fragments are charged. Quantum chemical calculations have been carried out on these and similar systems and the change in net charge on each atom due to pair formation has been calculated from the wave functions (for details see Fuelscher and Mehler, 1988, 1991; Solmajer and Hodoscek, 1990). The changes in the net atomic charges are also given in Figure 3. It is seen that for the uncharged pair there is a small shift in charge from the base to the acid, but for the ion pair there is a much larger shift in the opposite direction, partially compensating the formal charges on each frag-ment. Thus the net charge on each fragment is not ± 1 but — 0.73. Assuming an inherently low dielectric constant in a
pro-tein of — 5 such charge transfer increases the apparent dielectric permittivity value to 10, which is acceptably close to the value of 13 obtained from ewds at r = 3 A.
For small separations the parametrization of both ewds and es
is based on experimentally measured pK shifts in bifunctional organic acids and bases (Conway et al., 1951) and thus the non-electrostatic effects are effectively included in the parameters. This is not the case for the FDPB model where the protein is assigned an arbitrary low value of 2 for e and the solvent is given a high value. Effects like charge transfer rapidly vanish as the proton donor —proton acceptor distance increases beyond 4 A which may be the reason why for larger distances the errors from the SCP and FDPB become similar (see Table I).
The SCP approach as used here is based on Debye's theory of static permittivity (Debye and Pauling, 1925; Debye, 1929) and does not introduce discontinuities between the different components of the system. In a certain sense it resembles a microscopic approach more closely than a macroscopic one. Thus one could justifiably designate the SCP as an 'empirical semi-microscopic' approach as a reminder that the method essentially juxtaposes a macroscopic quantity with a microscopic one (Mehler and Eichele, 1984) using an empirically determined parametrization.
The shifts in the redox potentials also indicate that the effective screening inside the protein is somewhat smaller than in water but still substantially greater than the commonly assumed values of 2 - 5 . The effective value of e corresponding to the observed shift in cytochrome c55J is 27.4 (Moore et al., 1980). Moreover, the interactions involve charged sites which are well buried in the protein interior; thus surface effects which might be operative for interacting charges located near the protein surface are not present here. The reduction of the effective screening used in
es which seems to be appropriate for the protein interior was
achieved by reparametrizing twds (Mehler and Eichele, 1984) so
that at present two sets of parameters seem to be needed for a proper description of electrostatic interactions in proteins using the SCP. It is undeniable that this is a disadvantage and brings a certain degree of arbitrariness into the method, which unfortunately seems to be unavoidable. For the FDPB this is also the case, and it may well be that the erroneous response to ionic screening in calbindin could be improved with another, non-standard set of values for the input parameters. For the SCP approach, however, the results presented here provide some initial clues as to the conditions when e,^ or ts should be used, i.e. the
former is more appropriate for all water-accessible regions, whereas es is the better choice for interactions occurring in the
protein interior. A more quantitative set of rules will require additional data.
The accuracy achieved by the SCP for changes in electrostatic
.002 H . 0 0 2 N -H .014 -.001 H -.045N H---/ .068 -.060 •o -.086 N" 5q = 0.046 H .029 .034N: H -.021 .057 - - H — -.056 6q= -0.046 -.041 H . 0 2 1 N -H -.041 -.062 H -°5 N-H--.04X -.05 N-5q= -0.266 — H--.051 H -.062 .043 "0 - O .043 H .14 5q = 0.266
free energy on the order of 1—5 kcal/mol seems to be ~ 1 kcal/mol or less. In view of its extreme conceptual and computational simplicity it seems to be well suited for modelling solvent effects in molecular dynamics simulations. Its use to screen the electrostatic contribution to the empirical potential may at least be rationalized on the basis of its effectiveness in calculating the types of properties which have been discussed in this paper. One potential difficulty in using equation (6) is that with two parameter sets (e,,.^ and es) one would either have to
select one of them for the entire system or devise a switching function to go smoothly from one to the other. This might be done by defining a function of the form
6 = a{r,rur2)ewds + [1 - a(r,rur2)]es (7)
and a would vary from 0 to 1 in the range r, < r < r2 and
take on the appropriate value (0 or 1) outside this range. By choosing a to be a quadratic form both the electrostatic energy term and its gradient would be continuous functions of r. Whether or not the electrostatic term with the screening introduced here can fully account for the effect of the solvent is explored in the following paper.
Acknowledgements
The authors thank Drs S.Forsen and B.Svensson for making their data available prior to publication. We also would like to acknowledge the partial support of the Swiss National Science Foundation (grant no. 31.26261.89) and NIH grant GM-41373 (ELM) to carry out this research A generous grant of computing time from the Supercomputing Center. ETH, Zuerich, and the support of the Computing Center of the University of Basel is also gratefully acknowledged.
References
Adams,E.Q. ( 1 9 1 6 ) / Am. Chem. Soc, 38, 1503.
Ahlstroem.P., Teleman,0.. Koerdel.J.. Forsen.S. and Joensson,B. (1989) Biochemistry, 28, 3205-3211.
Bashford.D., Karplus.M. and Canters,G.W. (1988)/ Mol. Bio/., 203, 507-510. Batchelet.E. (1971) Introduction to Mathematics for Life Scientists. Springer
Verlag. Berlin, pp 298-305.
Bjerrum.N. (1923) Z Physik. Chem., 104, 147
Brooks.B.R.. Bruccolen.R.E., Olafson.B.D., States.D.J., Swaminathan.S. and Karplus.M. (1983) J. Comp. Chem., 4, 187-217.
Bucher,M. and Porter,T.L. (1986) / Phys. Chem., 90, 3406-3411. Conway,B.E., Bockris.J.O'M. and Ammar.I.A. (1951) Trans. Faraday Soc,
47, 756-766.
Cutler.R.L.. Davies.A.M.. Creighton.S.. Warshel,A., Moore.G.R., Smith,M. and Mauk,A.G. (1989) Biochemistry. 28. 3188-3197.
Dauber-Osguthorpe.P., Roberts,V.A., Osguthorpe.D.J., Wolff.J., Genest.M. and Hagler.A.T. (1988) Proteins. 4, 3 1 - 4 7 .
Debye.P. (1925) Marx Handb. Radiol, 6, 618-680.
Debye.P. (1929) Polar Molecules. Chemical Catalog Co., New York. Debye,P. and Pauling.L. (1925) / Am. Chem. Soc. 47. 2129. Ehrenson,S. (1989) / Comp. Chem.. 10, 7 7 - 9 3 .
Fiilscher.M.P. and Mehler.E.L. (1988) J. Mol. Struc. (Theochem.), 165. 319-327.
Fulscher.M.P. and Mehler.E.L. ( 1 9 9 1 ) / Comp. Chem.. 12. 811-828. Gilson.M.K. and Honis.B (1987) Nature. 330. 8 4 - 8 6 .
Gilson.M.K., Sharp.K~and Honig.B. (1988)/ Comp. Chem., 9. 327-335. Harvey.S. (1989) Proteins. 5. 7 8 - 9 2 .
Hill.T.L. ( 1 9 5 6 ) / Chem. Phys.. 60, 252-255.
Hingerty.B.E.. Ritchie.R.H . Ferrell.T.L. and Turner.J.E. (1985) Biopolymers.
24. 427-439.
Hori.K.. Kushick.N J. and Weinstein.H. (1988) Biopolymers. 27, 1865-1886. Hwang.J.K. and Warshel.A. (1987) / Am. Chem. Soc. 109. 715-720. Kirkwood.J.G ( 1 9 3 4 ) / Chem. Phys.. 2. 351-361.
Kirkwood.J.G. and Westheimer.F.H. ( 1 9 3 8 ) / Chem. Phys.. 6. 506-512 Klapper.I.. Hagstrom.R.. Fine.R.. Sharp.K. and Honig.B. (1986) Proteins. 1.
4 7 - 5 9 .
Kretsinger.R.H. (1987) Cold Spring Harbor Symp. Quant. Bioi. 52. 499-510. Kretsinger.R.H. and NockoIds.C.E.J. (1973)/ Biol. Chem.. 248. 3313-3326.
Lavery.R., Sklenar.H., Zakrezewska.K and Pullman.B (1986)/ Biomol. Struct Dyn , 3, 989-1014.
Linse.S., Johansson.C, Brodm.P.. Grundstroem.T., Drakenberg.T and Forsen.S. (1991) Biochemistry, 30. 154-162.
Lorentz,H.A. (1880) Ann. Physik.. 9, 641
Matthew.J.B. (1985) Annu. Rev. Biophys. Chem.. 14. 387-417
Matsuura.Y , Takano.T. and Dickerson.R.E. (1982)/ Mol. Biol.. 156. 389-409 McQuarrie.D.A. (1976) Statistical Mechanics. Harper & Row. New York Mehler.E.L. (1990) Protein Engng, 3, 415-417
Mehler.E.L. and Eichele,G. (1984) Biochemistry. 23. 3887-3891. Moore.G.R. (1983) FEBSUtt., 161, 171-175.
Moore,G.R., Pettigrew,G.W., Pitt.R.C. and Wilhams.R.J.P. (1980) BBA. 590. 261-271.
Nayfeh.M.H. and Brussel.M.K. (1985) Electricity and Magnetism. John Wiley & Sons, New York.
Northrup,S.H., Wensel.T.G., Meares.C.F., Wendoloski.J J. and Matthew.J.B. (1990) Proc. Nail Acad. Sci. USA, 87, 9503-9507.
Perutz.M. (1978) Science, 201, 1187-1191. Pickersgill.R.W. (1988) Protein Engng, 2, 247-248.
Rogers.N.K., Moore.G.R and Sternberg.M.J.E. (1985) / Mol. Biol.. 182, 613-616.
Schaefer.M.K. and Froemmel.C. (1990) / Mol. Biol., 216. 1045-1066. Schwarzenbach.G. (1936) Z Phys. Chem., A176. 133-153.
Sharp.K.A. and Honig.B. (1990) Annu. Rev. Biophys. Chem., 19, 301-32 Solmajer.T. and Hodoscek.M. (1990) In Rivail.J.L. (ed.). Modeling of Molecular
Structure and Properties, Studies on Physical Chemistry 71. Elsevier. Amsterdam, pp. 567—574.
Sun,D.-P., Liao,D.-I. and Remington.S.J. (1989) Proc. Natl Acad. Sci. USA,
86, 5361 -5365.
Svensson.B., Joensson.B. and Woodward,C. (1990) Bioph\s. Chem., 38. 179-183.
Szebenyi.D.M.E. and Moffat.K. (1986)7 Biol. Chem., 261. 8761-8777 Tanford,C. and Kirkwood.J.G. (1957) / Am. Chem. Soc . 79, 5333-5339. Van Belle.D., Couplet.L. Prevost.M. and Wodak.S.J. (1987)7 Mol Biol.. 198,
721-735.
van Gunsteren.W.F. and Berendsen.H.J.C. (1987) Groningen Molecular Simulation (GROMOS) Library Manual. Nijenborgh 16. Groningen. The Netherlands.
Warshel.A. and Russel.S.T.Q. (1984) Q. Rev Biophys , 17, 283-422 Warshel.A. and Sussman.F. (1986) Proc. Natl Acad. Sci. USA, 83, 3806-3810. Warshel.A., Sussman,F. and King.G. (1986) Biochemistry, 25, 8368-8372 Warwicker,J. and Watson.H.C. (1982) / Mol. Biol., 157, 671-679 Webb.T.J. (1926)/ Am Chem. Soc. 48, 2589-2603.