Developing a Quality Score Methodology for
Financial Reporting
By
Srinivasan Nallasivan
SUBMITTED TO THE SYSTEM DESIGN AND MANAGEMENT
PROGRAM IN PARTIAL FULFILLMENT OF THE
REQUIREMENTS FOR THE DEGREE OF
MASTER OF SCIENCE IN ENGINEERING AND MANAGEMENT
AT THE
MASSACHUSETTS INSTITUTE OF TECHNOLOGY
JANUARY 2006
C 2006 Massachusetts Institute of Technology All rights reserved
MASSACHUSETS IN OF TECHNOLOGY
JUN
15
2006
LIBRARIES
signature of A uthor ... .: .. . .. . . .. ... S oSnivasan Nallasivan System Design and Management ProgramJanuary 2006
Certified by... ... ....
Asst Professor of Mechanical Eng & Engineering Systems The *Ss
Certified by...
-atikHale Director Systems Design and Management Program
Developing a Quality Score Methodology for
Financial Reporting
By
Srinivasan Nallasivan
SUBMITTED TO THE SYSTEM DESIGN AND MANAGEMENT
PROGRAM IN PARTIAL FULFILLMENT OF THE
REQUIREMENTS FOR THE DEGREE OF
MASTER OF SCIENCE IN ENGINEERING AND MANAGEMENT
AT THE
MASSACHUSETTS INSTITUTE OF TECHNOLOGY
JANUARY 2006
Abstract
Money laundering is a huge problem that is faced by financial institutions and banks are mandated by the government to have strict policies and procedures towards anti-money laundering reporting. The outcome of a complex investigation process is a Suspicious Activity Report (SAR) which is used by Financial Crimes Enforcement Network (FINCEN) to trace back criminals and to curb the money laundering activities. This thesis work involves developing a quality rating methodology for SAR reporting at the bank and rates the critical elements in determining the quality of a SAR. The results of the quality scoring mechanism have been validated by using Multivariate tools and techniques. Mahalanobis- Taguchi Strategy (MTS) and Principal Component Analysis
(PCA) were used to come up with the measurement scale to distinguish the good and bad
SARs and PCA was used to list the critical elements that were listed by the MTS approach. The results of the analysis were presented towards the end of the thesis and this methodology can be used to determine the quality rating of SARs.
Thesis Supervisor: Daniel Frey
Acknowledgements
It's a pleasure to thank all those people who made this thesis a reality.
First and foremost, I would like to thank Dr. Daniel Frey, my thesis adviser and Dr. Rajesh Jugulum for providing invaluable help and support throughout my thesis. I gratefully acknowledge your help and I am indebted to you anytime.
I am grateful to my supervisor at work, Misty Richtie and her team for the constant support and encouragement and for sparing her time in between her meetings towards my thesis work. You were my true "Cheerleader" -Your dedication towards this project was amazing.
I would like to acknowledge the staff and faculty of the Systems Design and Management
Program for my pleasant stay here at school.
Finally I would like to thank my family and friends for supporting me when I was discouraged, for teaching me and providing unconditional support and encouragement through out my life. Thank you!
TABLE OF CONTENTS
1.0 OVERVIEW OF ANTI-MONEY LAUNDERING...9
1.1 DIRECT BENEFICIARIES ... 10
1.2. INDIRECT BENEFICIARIES... 11
1.3 SYSTEM DESCRIPTION - A SYSTEM ARCHITECT'S VIEW ... 12
1.3.1 INTENT OF THE SYSTEM... 45
1.3.2 OPERATING INTENT OF THE SYSTEM... 45
2.0 SUSPICIOUS ACTIVITY REPORT ... 44
2.1 WHY IS SAR QUALITY IMPORTANT... 16
2.2 RESEARCH OBJECTIVES... 18 2.2.1 PROBLEM STATEMENT ... 19 2.2.20BJECTIVE ... 19 2.3 APPROACH ... 19 2.4 ORGANIZATION OF THESIS ... 20 3.0 LITERATURE REVIEW... 22
2.1 USE OF ROBUST METHODS IN MEASUREMENT... 22
3.2 TAGUCHI METHODS... 23
3.2.1 MEASUREMENT OF FUNCTION USING ENERGY TRANSFORMA TION ... 24
3.2.2 UNDERSTANDING THE INTERACTION BETWEEN CONTROL AND NOISE FACTORS IN THE SYSTEM .... 24
3.2.3 ORTHOGONAL ARRAYS AND SIN RATIOs... 24
3.2.4 Two STEP OPTIMIZA TION ... 24
3.2.5 TOLERANCE DESIGN USING QUALITY LoSS FUNCTION ... 24
3.3 MULTIVARIATE TOOLS AND TECHNIQUES... 25
3.3.1 PRINCIPAL COMPONENTANALYSIS... 25
3.3.2 STEP WISE RE GRESSION ... 26
3.3.3 TEST OF ADDITIONAL INFORMA TION (RAo'S TEST) ... 26
3.3.4 M UL TIPLE REGRESSION ... 26
3.4 MAHALANOBIS -TAGUCHI STRATEGY (MTS)... 27
3.3.1 OBJECTIVES OF USING MTS SCALING ... 27
3.3.2 GRAM-SCHMIDT ORTHOGONALIZATION PROCESS ... 29
3.3.3 DIRECTION OFABNORMALITYINMTS ... 29
3.3.4 STAGES IN CONSTRUCTING MTS... 30
3.5 USE OF ORTHOGONAL ARRAYS IN MTS... 31
3.5.1 SIGNAL To N oISE RA TIo ... 31
3.6 PRINCIPAL COMPONENT ANALYSIS ... 33
3.6.1 CoVARIANCE M ATR x ... 33
4.0 ASSESSING QUALITY OF DOCUMENT... 38
4.1 A SSESSM ENT TECH NIQ UES... 41
4.1.1 SUBJECTIVE CRiTERIA ... 41
4.1.2 OBJECTIVE CRITERIA... 45
4.2 DATA Q UALITY ELEM ENTS ... 45
4.3 CRITICAL ELEMENTS FOR SAR EVALUATION... 48
4.4 SAR FACTO R SCO RING ANALY SIS... 52
4.5 DATA CO LLECTIO N ... 57
4.6 PRINCIPLE COMPONENT ANALYSIS...70
LIST OF FIGURES
FIGURE 1.3.0 SYSTEMS ARCHITECT VIEW ... 13
FIGURE 1.3.1 SYSTEMS OPERATING INTENT DIAGRAM ... 14
FIGURE 4.5.1 NORMAL AND ABNORMAL MD DISTANCE ... 69
FIGURE 4.5.2 CASE NUMBER VS. ABNORMALITY... 69
FIGURE 4.6.1 LOADING PLOT OF X1...X6... 74
LIST OF TABLES TABLE 4.1 ELEMENTS FOR RATING QUALITY OF A DOCUMENT... 45
TABLE 4.4 SAR ELEMENT SCORING SHEET... 55
TABLE 4.5.1 VARIABLE DESCRIPTION... 59
TABLE 4.5.2 GOOD SARS SAMPLE DATA ... 62
TABLE 4.5.3 GOOD SAR SAMPLE DATA CLASSIFICATION... 63
TABLE 4.5.4 BAD SAR SAMPLE DATA ... 64
TABLE 4.5.5 BAD SAR SAMPLE DATA CLASSIFICATION... 65
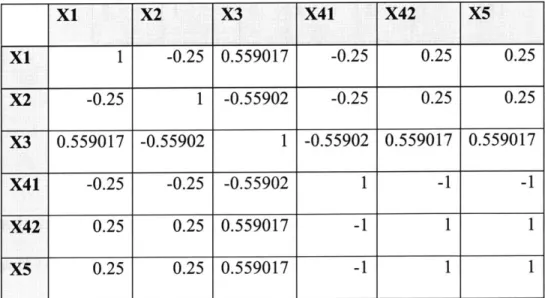
TABLE 4.5.6 CORRELATION MATRIX ... 67
TABLE 4.5.7 MD DISTANCE CALCULATION ... 68
TA B LE 4.5 .8 S/N RA TIO ... 69
TABLE 4.5.9 GA IN CHA RT... 70
TABLE 4.5.10 VALIDATION OF SCALE... 70
TABLE 4.6.1 SAMPLE INPUT DATA FOR PCA... 71
1.0 Overview of Anti-Money Laundering
"Money launderers subvert legitimate financial mechanisms and banking relationships
by using them as protective covering for the movement of criminal proceeds and the
financing of crime and terrorism, and, by so doing, can ... undermine the integrity of United States financial institutions and of global financing and trading systems upon which growth and prosperity depend..."
- USA PATRIOT ACT, Section 302(3)
Recent estimates suggest that around US$500 to 1 trillion is laundered worldwide annually by drug dealers, arm traffickers, and other criminals. Bank acts as gatekeepers for legitimate financial system and they serve to protect the system through their
thorough vigilance on preventing organized crimes and terrorist financing. Banks play a major role in prevention, detection and reporting of money laundering activities.
Patriot Act requires each financial institution - including broker-dealers, investment companies and insurance companies - to develop and institute and anti-money laundering compliance solutions that must, at a minimum:
" Include internal policies, procedures, and controls
" Designate a compliance officer to administrator and oversee the program " Provide for on-going employee training; and
* Include an independent audit function to test the program
The law mandates all the commercial banks to file a Suspicious Activity Report (SAR) if any of the transactions supported by them is found to be suspicious. SAR will include the detailed information, such as contact information of the bank, the subject contact
information and a narration of why the investigator feels that the transaction is suspicious from the anti-money laundering policies and procedures.
The act also identified five types of special measures available to the Secretary of Treasure in dealing with a Primary Money Laundering Concern (PMLC).
" Recordkeeping and Reporting
* Information Relating to Beneficial Ownership * Information Relating to Payable-Through Accounts
" Information Concerning Certain Correspondent Accounts
" Prohibitions or Conditions on Opening or Maintaining Certain correspondent or
Payable-Through Accounts
1.1 Direct Beneficiaries
'For financial institutions, the business environment has never been tougher.
Globalization, convergence, consolidation and e-commerce have created a marketplace that is increasing in complexity with the speed of Moore's law. And now that anti-terrorism legislation with provisions to combat money laundering has been signed into
law by President Bush, the landscape promises to become even more challenging for financial institutions to navigate.
With regulatory requirements stepped up and extended throughout the industry as a result of the USA Patriot Act, N2 in the UK, and other national anti-money laundering
regulations, financial institutions are facing a spate of new risks and responsibilities in the global fight against money laundering and fraud. Adding to their burdens in the
compliance battle is the increasing sophistication of the schemes used to perpetrate fraud, the fresh opportunities provided by e-commerce and other emerging business models and the exponential growth in recent years of transactions, accounts and remote customers. The stakes are as high as the challenges tough. Failure to stem incidents of money laundering-or even to simply investigate and report potentially suspicious activity-could result in civil or criminal action, reputation-killing negative publicity and stiff penalties that can stretch to multi-million dollar figures. In recent years, a number of financial institutions have incurred fines of $5, $10 and even $20 million dollars.
While banks, broker-dealers and exchanges are confronting some regulations specific to their individual industries, all will be required to develop anti-money laundering
prevention policies, designate a compliance officer, establish a training program and set up a testing/audit function. In addition, financial institutions will be required to engage more actively in "know your customer" directives.
As a result, most financial institutions are realizing that their current monitoring and compliance systems are not capable of meeting the new demands. Financial institutions will be the direct beneficiary of the quality scoring mechanism for SARs that we try to implement This thesis will research into quality scoring techniques to make financial institution be in compliance with government regulation to avoid any possible violation and will also drive down the cost of managing an AML organization.
1.2 Indirect Beneficiaries
In response to terrorists' attacks in order to strike at the source of terrorist funding, the Patriot Act sets broad parameters and ambitious goals for financial institutions to identify and prevent any possible money laundering activities.
So we see the indirect beneficiaries of our anti-money laundering solution will be
government and people under the protection. Using the information provided by financial institutions, government agency can identify and prevent possible terrorists' activity and improve homeland security.
1.3 System Description - A System Architect's view
The picture described shows the cost- intent diagram of the system using OPM methodology. The holistic picture shows the various interfaces of the system and the cost and profit involved in constructing the entire system by identifying the beneficiaries, operand, intent, cost, profit, technologies, design and implementation aspects of the
system.
Gver nmeni Transaction
histor
__To identi ymoney FINCEN Bn
launt eringI
Value Delivery Operating
Unintended Hmn 8
Environmen
Incorprtin
Co pein porate securi ,SAS license,
Vendo Procts ank centers, F U se Management, Tera Da a
FigureCompeting
& Syste A tobust desi Inserting
Sovenme Transferring Sri Lv S ble archite re Technol
. $endor technologi s Wereho :s A tat' tical, ase nagement
E Venlrs AML Soutio Sa+9 c- GIdne tentT
Emloin Co n t
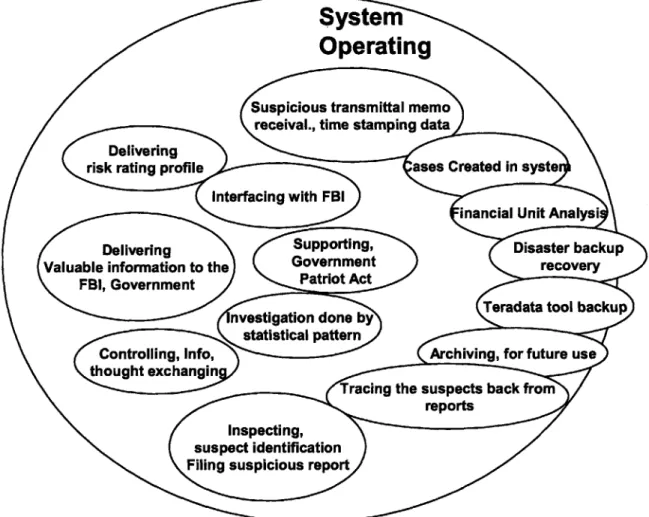
1.3.1 Intent of the system
The intent of the system is to provide valuable information to the government in order to trace the money laundering suspects in the bank. The needs of the system is to capture the suspects who launder money illegally to different countries or different banks
domestically and to trace the suspects back with the help of government
System
Operating
Suspicious transmittal memo receival., time stamping data Delivering
risk rating profile ases Created in syste
Interfacing with FBI
inancial Unit Analysi
Delivering Supporting, Disaster backup
Valuable information to the Government recovery
FBI, Government Patriot Act
nvestigation done by Teradata tool backup
statistical pattern
Controlling, Info, Archiving, for future use
thought exchangin
Tracing the suspects back from reports
Inspecting, suspect identification Filing suspicious report
Figure 1.3.1 Systems operating intent diagram
1.3.2 Operating Intent of the system
The operating intent of the system is as shown in the above figure. The operating intent gives the various steps in the operations of the system to achieve its goals.
* Backups are simultaneously created and contingency planning is also done for future uses.
* Investigation is done by the financial unit by use of advanced tools and techniques * Interfacing with FBI to find any known suspects by name checking and suspect
checking list with OFAC procedures
* Information exchanged with the FBI about the suspects who are laundering money
* Information submitted in the form of suspicious activity report to the government * Suspect being traced back by financial crimes enforcement network.
2.0 Suspicious Activity Report
The final outcome of the investigative process is compiling the information generated in the form of a Suspicious Activity Report (SAR) which is filed to the Financial Crimes Enforcement Network. (FINCEN). The information generated from the SAR filings play an important role in identifying the potential illegal activities thereby preventing the flow of illicit funds through our financial system. This information should be accurate and time critical and should include all the readily available information due to due diligence efforts. The SAR narrative contains information about 5WlH analysis which composes the elements of Who? What? When? Where? Why and How? These SARs are important for the law enforcement officials to track the criminals with the help of information provided in the report. The SAR has critical information regarding the money launderer and has a narrative portion which describes in detail about the activity that the person is engaged in and the mode of doing money laundering.
2.1 Why is SAR
Quality
Important?Most of the financial Institutions are doing an excellent job of reporting suspicious activity, but still there is room for lot of improvements in the quality of the reporting procedure. The SAR's that are being reported have no suspect identification or activity
characterization and no sufficient narrative to explain why the activity was being
reported. Investigators who do the money laundering investigation fill all the portions of SAR, but do not provide sufficient narrative for the "OTHER" portion of the SAR document which is critical for law enforcement officials to follow up. Inexperienced investigators add spread sheets and computer printouts for documentation and when this
key punched and all the additional information are not punched/ included with narrative.
SAR which doesn't provide a clear narration of the suspicious activity will tend to be of minimum use to law enforcement and this narrative portion is critical to law enforcement officials and care should be taken to fill this narrative portion of each SAR completely. Google search of SAR quality statistics reveals the following information
2During the year from July 1, 2002 to June 30, 2003, financial institutions (as defined by
31 CFR 103) filed approximately 300,000 SARs. The following issues were identified:
* Four percent were filed without a suspect name.
" Eight percent did not list an address for the suspect.
" Twenty-three percent did not provide the suspect's social security number. " Four percent did not provide any indication of what suspicious activity occurred. " Six percent did not complete the narrative.
These are some critical quality elements for SAR reporting and SARs submitted without this information will not be useful for Law Enforcement in tracking the money
laundering criminals. Financial Crimes Enforcement Network (FINCEN) stresses the importance of data elements in a SAR and mandates high quality SAR elements from all the financial institutions. If any of the information such as name, address of SSN is not available, then "unknown" or "not available" should be listed in the boxes provided on the SAR form. The SAR form is considered complete when all the information in the boxes are filled and there are no blank critical fields. Certain items are marked with an asterisk sign (*) which denotes that those elements are critical for the law enforcement
2 This statistics was taken from the "SAR Activity Review Trends, Tips and Issues
-November 2003 edition"
officials to track the criminals. These fields might include Subject's name, Identification and address, type of suspicious activity and the narrative.
By following these set of guidelines, the law enforcement can do its investigation in an
efficient manner and this also helps in the following reasons
* It provides an indication that investigators at the bank considered all the elements and the "unknown" or "not available" data field indicates that the investigators at the bank were aware of the missing field. It helps to clear the ambiguity among law enforcement officials.
* Law enforcement understands that some data fields were missing during the time of reporting and it eliminates the need for FINCEN to call the bank for more details about the person.
2. 2 Research Objectives
2.2.1 Problem Statement
There is currently no quality assessment of the input to the AML investigation process Suspicious Transmittal Memo (STM) or one of the outcomes of the AML investigation process (SAR). The quality of the SAR impacts the law enforcement investigation's completion time, the accuracy of the assessment for case opening, and the prioritization of the referral. The quality of the SAR is an input into the assessment performed by the Office of Comptroller of Currency (OCC) and impacts the AML audit rating. To be able to assess current baselines and the impact of process improvements, a quality assessment process must be established for SARs.
2.2.2 Objective
The following were set as the objectives of this thesis and a quality scoring mechanism was to be developed for suspicious activity reports as a result of my thesis work. The objectives were
1. Assess characterizes of STMs and SARs using Subject Matter Experts (SMEs) to
define and weight quality assessment criteria and categories for STMs and SARs. 2. Assess OCC guidelines and/or recommendations regarding SAR requirements.
3. Develop an assessment tool that provides a scoring mechanism that can be applied to
SARs to assess the quality of the product.
4. Validate the tool for reproducibility and repeatability of results.
5. Outline a procedure for the implementation of an ongoing measurement process.
2.3 Approach
I approached the problem challenge from two different perspectives. Since the problem
of measuring quality of a SAR is an objective approach and it depends on the individual making the decision of whether the SAR is of good quality or not, I wanted to introduce a numerical rating system which can guide the audit department or be helpful in measuring the quality of the document. First part was a literature research on white papers to find the critical elements in measuring the quality of the document. I sought the help of subject matter experts and investigators who have been doing money laundering research for a long period of time to have some input for the critical variables in the SAR
document. After several brainstorming meetings, we proposed a cause and effect matrix, which listed out 7 most important variables in measuring the quality of the document.
I wanted to verify the critical elements that were short listed by the subject matter experts and by using Robust Engineering methodologies, we were able to verify the critical elements for measuring the quality of a SAR. Mahalanobis Taguchi System (MTS) was used to measure the abnormal distances from the normal reference group, orthogonal arrays and Signal to Noise Ratio (S/N ratio) was developed to validate the scale
developed by using Larger the Better S/N ratio. An alternative research approach known as the Principal Component Analysis (PCA) was used to compare the MTS methodology that was proposed. The research methodologies will be described in detail in the later portion of this thesis.
2.4 Organization of the Thesis
This thesis is based on the application of Mahalanobis Taguchi System for building a robust measurement scale. The first chapter gives a good overview of the Anti-money Laundering system and the role of bank in preventing money laundering. This chapter also explains about the intent and cost of an anti-money laundering system and shows the operating intent of the system. The second chapter provides a description of the
suspicious activity report and the approach towards the problem statement. Third and fourth chapter will provide a literature overview of robust engineering methodologies and research approach of MTS and principal component research in detail. The fifth chapter provides conclusions and recommendations for future work.
3.0 Literature Review
3.1 Use of Robust methods in Measurement Scale
Genichi Taguchi introduced the concepts of Robust Engineering after several years of research and these techniques have been effectively used by many industries in providing a cost effective methodology and to optimize their operations processes. These concepts are called Taguchi methods.
According to Taguchi methods, the quality has been classified into * Customer- driven quality
" Engineered Quality
While the customer quality deals with the quality from the customer's perspective such as size and color, engineered quality deals with the engineering attributes of achieving the quality. Engineered Quality involves addressing the quality attributes that deviate from the ideal function. This thesis report uses Mahalanobis distance (MD) to analyze the quality of suspicious activity reports (SAR) and MD is similar to the engineered quality analysis, where in the abnormality or deviation is measured from a known reference group known as the Mahalanobis space.
This analysis makes use of Robust Engineering Methods to design Information Systems, which really involves the use of different patterns and to analyze the interactions between different variables. Development of such systems in a real world is a difficult and
daunting task which needs to have predictions done accurately based on the information available in different systems. Such predictions need to be accurate and time sensitive and it is based on the multiple variables defining the systems (multidimensional systems). When the multidimensional measurement capabilities are not measured properly, they
can lead to inaccurate predictions causing the systems to fail. We have developed a multivariate measurement scale which measures the various conditions of multivariate systems so as to take appropriate actions. Mahalanobis distance is the measurement of distance by measuring the correlation between the variables. This distance is used for the construction of the scale and we use robust methods to measure the accuracy of such a scale. This strategy wherein the scale is constructed and accuracy is measured using robust methods is called MTS (Mahalanobis Taguchi Strategy)
3.2 Taguchi Methods
Taguchi methods are based on five principles which are as follows3 " Measurement of Function using energy transformation
* Understanding the interaction between the control and noise factors in the system * Use of Orthogonal arrays and Signal to Noise ratio for better efficiency and
accuracy
* Two Step Optimization
* Tolerance design using quality loss function
3 Taguchi principles have been used here from book on " The Mahalanobis- Taguchi Strategy - A Pattern
3.2.1 Measurement of Function using Energy Transformation
This principle states that it is necessary to find the ideal function that governs the system. Taguchi states that it is necessary to understand the system functionality in order to improve the product quality.
3.2.2 Understanding the interaction between control and noise factors in the system This principle states that it is not necessary to understand the interactions between the control factors, but to understand the interactions between the control and noise factors to understand the system, and to build a robust design.
3.2.3 Use of orthogonal arrays and S/N ratios
Orthogonal Arrays are used to minimize the number of combination trials needed for the experiment. S/N ratios are needed to validate and improve the accuracy of the MTS system as it captures the magnitude of the real effects after including the effects of noise. Thus orthogonal arrays help to test all possible combinations efficiently and S/N ratios help to validate the measurement system.
3.2.4 Two Step Optimization
This involves two steps for the optimal design where in the first step is to maximize the
S/N ratios and the second step is to adjust the sensitivity of the system to the desired
level. This is usually done by adjusting the mean after the variability in the system is minimized.
3.2.5 Tolerance Design using Quality Loss function
This principle is based on the tolerance design and it involves quality loss function and quality engineering (QE) The first four principles use the concept of parameter design
and this principle states that the loss associated with the performance deviation is proportional to the square of the deviation.
3.3 Multivariate Diagnosis - Techniques and Tools review
There are several tools used to analyze multidimensional systems and the following section will discuss the benefits and limitations of such tools
3.3.1 Principal Component Analysis
Principal component analysis is helpful in data reduction and data interpretation. The objectives of PCA is of two folds and it is given below
" To reduce the dimensionality of the data set
* To identify new underlying variables and interpret data
For example, if we have n components representing a system variability, we use k to explain the variability, so that k <n. The k principal components are linear combination of n random variables. These linear combinations represent the selection of a new coordinate system obtained by rotating the original system to explain the variance-covariance structure through few linear combinations. The mathematical technique used in PCA is called the Eigen analysis which is used to solve the Eigen values and vectors of a square symmetric matrix with sum of squares and cross products.4 The limitation of Principal Component Analysis is that it is not helpful in reducing the dimensionality of original variables.
3.3.2 Stepwise Regression
In multivariate applications, Stepwise Regression is used for selection of a useful subset of variables by adding or excluding variables so that their contribution to the overall response variable might be determined. It is a iterative process and the variables that are added or removed by the user is most crucial in this process of iterations. This has limitations as it does not always guarantee the best subset regression model. 3.3.3 Test of Additional Information (Rao's Test)
This test is to identify a set of useful variables by using Fisher's linear discrimination function; subsets are tested for importance by the F- ratio. If the F- ratio is high, it denotes that the selected variables provide useful information and if the F-ratio is low, it indicates that the variables can be discarded. Subject matter experts select the subset of variables and try to apply the F-ratio test in order to determine the significant variables. There is a serious limitation in this method and F- ratio test cannot be adequate to decide the important variables.
3.3.4 Multiple Regression
In multiple Regression the dependent variable Y is estimated from a set of P independent variables X1, X2... X. Multiple regression is used to relate the several independent
variables to a dependent or criterion variable and is based on least squares estimate method. It might be complex if the number of variables involved is high.
3.4 Mahalanobis Taguchi System (MTS)
The Mahalanobis distance (MD) is a single measure of degree of divergence in the mean values of different characteristics of a population by doing a correlation analysis between the variables in multidimensional systems. MD is very sensitive to the intervariable changes in the reference data, and it classifies the observation into different groups. In other words, MTS measures the nearness of unknown points from the mean point in a group. Mahalanobis measurement scale was developed by an Indian Statistician P.C Mahalanobis and it is used to measure distances between variables in multidimensional space. It is much accurate than other scales such as Euclidean scale, because correlation between the variables is considered in this scale and this scale represents the distance between the variables in quantitative terms. Euclidean distance is also used in measurement of unknown point from group mean point, but there are two significant disadvantages.
* Euclidean distance does not provide a statistical measurement of the fit between the unknown and reference set.
" Euclidean distance doesn't account for the distribution of points
3.4.1 Objectives of using a MTS scaling mechanism
The objectives of MTS are to measure the abnormality by introducing a scale which is based on all the input characteristics. The scale is constructed by dividing the original distance by k number of variables and by creating a reference group called as the Mahalanobis space (MS)
A reference scale is needed for measurements to be made. For a single system, a
measurement scale or a reference point can be easily created, where in for a multiple variable system, the reference point is created with help of group of observations. Zero point is used as the reference point of scale and the distances are measured from this scale. These set of observations are called Mahalanobis distance and these observations are similar and not same. The next step in MTS is validating the accuracy of the scale. For the observations outside the Mahalanobis space, the distances are measured from the center of the group depending on the mean, standard deviation and correlations
depending on the group. The observations other than the normal group have a larger distance and hence to measure the accuracy of the scale, we use a Signal-to-Noise ratio.
S/N is used to measure the accuracy of the predicted variables and it is used to measure
the correlation between the input variables to the output variables in the presence of noise factors in the system. For an accurate system, there should be good correlation between the predicted variables to the input variables. Mahalanobis distance is used to accurately measure the important input signals/variables that might affect the prediction variables and S/N ration measures the accuracy of the prediction variables. In a multidimensional system, there will be a lot of combination to be tested and hence it will be difficult to test all the possible combinations. Orthogonal Arrays (OA) can be used to predict the
important variables by minimizing the number of variables to be tested. MTS assigns the variables to the column of Orthogonal Array and based on this OA, important variables are identified in the system.
Mahalanobis distance calculation
MTS is calculated by following equation
MD = (1/k) Zi Zi T c-1
Where Zi is the standardized vector for values of Xi = 1..K
C is the correlation matrix
K is the number of variables T is the transpose of the vector
3.4.2 Gram-Schmidt's Orthogonalization process
In MTS, we measure the degree of abnormality and usually, higher the distance, higher
the abnormality or severity in measurement scale. The higher distance can be an indicator of good or bad abnormality and it depends on the situation. So it is extremely important to determine the direction to distinguish between a good and a bad abnormality.
3.4.3 Direction of Abnormality in MTS
MTS can be very helpful to identify the abnormal conditions from a reference group, but the direction of abnormality is important to determine before determining it as a good or a bad abnormality. For example, in a student admission system, a group of students can stand as a abnormal condition and it should be analyzed whether the abnormality is in a good or bad way. If the abnormality is in a good way, then scholarships can be given. But the direction of the abnormality cannot be determined by using the inverse of correlation matrix which is MTS. MTGS (Gram-Schmidt) method is helpful to determine the direction of abnormalities.
3.4.4 Stages in constructing a MTS
There are four stages involved in constructing MTS. They are Constructing a MTS scale
On a higher level, this stage involves selecting the variables so that they are uniform and using the Mahalanobis space as a reference point for the scale. The variables are defined and the corresponding data for all the variables are selected. The standardized values of the variables are computed. The Mahalanobis Distance (MD) for all observations is calculated by the inverse of the correlation matrix and the base for the measurement scale is determined.
Validation of MTS approach
On a higher level, this stage involves identifying the conditions outside the space and measuring the Mahalanobis distance to see if they validate the subject matter expert's opinion. We also validate the accuracy of the scale using S/N ratio. The abnormal conditions are determined and the MD's corresponding to the abnormal conditions are calculated. This is calculated by using the correlation matrix of the normal variables by normalizing the abnormal conditions using the mean and Standard Deviation. The MD of an abnormal scale would have higher values and this validates the MTS approach.
Identify the critical variables
On a higher level, this stage involves finding out the useful set of variables using orthogonal arrays and S/N ratios. S/N provides an important contribution in finding out the critical variables in the MTS approach. The gain in the S/N ratio is helpful in determining the useful set of variables.
Monitoring the useful variables
This stage is used for monitoring the scale to check if any appropriate action needs to be taken. Threshold conditions are set and corrective action is taken based on the values of MD.
3.5 Use of Orthogonal Arrays in MTS
OA is used in design of experiments to minimize the number of experiments and to
determine the effect of several factors and required interactions. Orthogonal Arrays are efficient tools to test multifactor experimentation. The variables can be identified using OA's and can the variables are assigned to different columns of an array. For all the possible combinations, MD is calculated and accuracy of the scale is determined by using
S/N ratio.
3.5.1 Signal to Noise ratio
S/N ratio will be highly useful to measure the accuracy of predicted variables. S/N ratios
are calculated with all possible combinations in orthogonal Array based on the Mahalanobis distance outside the group. The S/N ratios are calculated at level 1 (presence) and level 2 (absence). Signal to Noise ratio is useful in understanding the magnitude of real effects after making adjustments to noise. The S/N ratio should be higher to have very high accuracy levels and these three types of S/N ratios are used. They are
" Larger-the-better " Nominal-the-best " Dynamic type.
The larger the better S/N ratio is used if the level of abnormality is not known. Nominal the best type of S/N ratios are used if the reference has a mixture of normal and abnormal variables. When the levels of abnormal are known, dynamic type is used.
3.6 Principal Component Analysis
Principal Component Analysis (PCA)5 is a multivariate analysis where in the data is rotated so that there is maximum variability projected on the axes. PCA6 aims at reducing a large number of variables into a smaller set which contains as much information as the large set. This is done by transforming the correlated variables into a set of uncorrelated variables which are linear combinations of the original variables. There are combinations of variables and the first principal component is the combination of variables which has the maximum amount of variation. There can lot of different combinations and PCA is used to reduce the dimensionality of the data set by retaining as much information as possible. PCA is the projection of observations along the orthogonal axes which is defined by the original variables. The first axis accounts for the maximum variation, the second axis contains the second most maximum variation and is perpendicular to the first axis, the third axis contains the third most maximum variation perpendicular to first and second axis. However if there is no correlation between the variables, then PCA has limitations in converting them into uncorrelated variables and hence the dimensionality can't be reduced.
PCA can be used to
* Reduce the number of variables
5 http://www.eng.man.ac.uk/mech/merg/Research/datafusion.org.uk/pca.html
* Identify the set of inter dependent variables.
3.6.1 Covariance Matrix
Standard deviation and Variance can analyze the data in a one dimensional way which tells that you can do a statistical analysis independent of the other dimensions. However if the analysis needs to be done with respect to each other's dimension, Covariance should be used. Covariance is a measure between 2 dimensions and if there are 3 dimensions, we measure covariance between (x, y), (x, z), (y, z) dimensions. If
covariance is positive, it denotes that both dimensions increase together. If covariance is negative, when one dimension increases, then other dimension decreases. If covariance is zero, then the two dimensions are independent of each other. The covariance values are created and are put into a matrix form which is known as the covariance matrix. The important point to notice here is that covariance of(x, y) is equal to covariance of(y, x)
3.6.2 Steps in Principal Component Analysis7
The following steps are done to find the principal component and to reduce the dimensions in the data set.
Collecting data
Step 1 involves collection of all data elements required for the analysis. The data can be of any dimensions and we define the original variables in the data set.
Subtracting the mean
Step 2 involves subtracting the mean across the dimensions. For example, if we have x and y dimensions, we subtract x elements mean from each of x values and y elements mean from each of y values. This produces a data set in which mean is zero.
Covariance matrix calculation
The covariance matrix is calculated to know the relations between the dimensions and the this helps to determine the type of inter-relation between the x and y elements (positive, negative or zero)
Calculating the Eigen values and Eigen vectors
It is important that then Eigen vectors are unit vectors for PCA analysis and provides useful information about data patterns. The eigen vectors are plotted on a graph and they
are perpendicular to each other. The eigen vector with highest eigen value is the principle component of the set and is the most important element between the data dimensions. Choosing Components and Feature vector
After the eigen vectors are found, they are arranged with their eigen values ranked from highest to lowest and this helps to reduce the components that have lesser significance.
This involves forming the feature vector which is a collection of p eigen vectors from n eigen vectors such that p <n and thus the dimensionality of the data set is reduced picking the most significant elements.
This page is intentionally left blank
The context of use of information in any document is the key to accurately defining its quality. It is therefore not enough to just identify the dimensions used for accessing quality. Quality needs to be accessed within the context of the generation and use of the information. It also greatly depends on the usefulness of data from the user's point of view. "Quality data cannot be assessed independent of the people who use data" When assessing such a suspicious transmittal memo for quality, there are certain very important keywords, facts, data or information that an investigator is looking for. In doing so, he is looking to gather vital information to proceed with the case. So, a quality rating should in effect mimic the estimate of a document by an experienced investigator. What information an investigator looks for when going through a document will therefore be the keywords or patterns that a rating system should search for when estimating
quality.
In general for any document, it is important to identify the factors we are going to measure, and to consider how much each of these factors is important, that is, what will be the weight for each factor. Multiplying the quality rating of each of these factors by its weight will give the actual value. And a sum of these values will ultimately be the quality rating we assign for a document. Although factors like storage methods, retrieval,
security, accessibility, availability, navigation and others are important, we will be
considering the information or content in the document only, for estimating its value from an investigators point of view.
Element Weight:
Simple Ratio
Simple Ratio is the ratio of desired outcomes to the total outcomes. Since the exceptions are measured in a quality testing, simple ratio is the ratio of undesired outcomes to the total outcomes in a scenario. Some of the traditional form of data quality metrics such as free-of-error, complete and consistency take this dimension of simple ratio.
Free-of-error
Metric
Free-of-error represents the accurate data representation and is calculated as a ratio of the no of data units in error to the total number of data units subtracted from 1. To establish the free- of-error ratio, we need to establish or clearly define as what constitutes a data unit and what constitutes an error.
Completeness
Completeness can be viewed from three different dimensions namely Schema Completeness
This is an abstract level and it is defined as the degree in which the entities and attributes are not missing from schema
Data level completeness defines the column completeness as a function of missing values in the column of a table.
Population completeness
Population completeness includes the range of data elements that should be present in a column to ensure population completeness. If certain data elements are missing from a column, it can lead to population completeness.
Metric
This can be calculated by measuring the number of incomplete items to total number of items and subtracting from 1
Consistency
Consistency can be measured by assuring that data is consistent of same values across different tables.
Min or Max operation
To handle dimension that require aggregation of multiple data indicators, minimum or maximum operators can be applied. Two variables that make use of minimum operations are believability and appropriate amount of data
Believability
Believability is the extent to which data is regarded as true and credible. Among other factors, it may reflect an individual's assessment of the credibility of the data source, comparison to a commonly accepted standard and previous experience.
Metric
assigned as the minimum value of the three. Assume the believability of the data source is rated as 0.6; believability against a common standard is 0.8; and believability based on experience is 0.7. The overall believability rating is then 0.6 (the lowest number) As indicated earlier, this is a conservative assessment.
Appropriate amount of data
A working definition of the appropriate amount of data should reflect the data
quantity being neither too little nor too much.
Metric
A general metric that embeds this tradeoff is the minimum of two simple ratios: the ratio
of the number of data units provided to the number of data units needed, and the ratio of the number of data units needed to the number of data units provided.
Timeliness
Timeliness reflects how up-to-date the data is with respect to the task it is being used for.
Metric
Timeliness can be measured by the metric of one minus the ratio of currency to volatility Currency is defined as the age plus the delivery time minus the input time. Volatility refers to the length of time data remains valid; delivery time refers to when data is delivered to the user; input time refers to when data is received by the system; and age refers to the age of the data when first received by the system.
Accessibility
Metric
The metric emphasizes the time aspect of accessibility and is defined as the maximum value of two terms: 0 or one minus the time interval from request by user to delivery to user divided by the time interval from request by user to the point at which data is no longer useful
Weighted Average
For the multivariate case, an alternative to the min operator is a weighted average of variables. If a company has a good understanding of the importance of each variable to the overall evaluation of a dimension, for example, then a weighted average of the variables is appropriate. To insure the rating is normalized, each weighting factor should be between zero and one, and the weighting factors should add to one. Regarding the believability example mentioned earlier, if the company can specify the degree of importance of each of the variables to the overall believability measure, the weighted average may be an appropriate form to use.
4. 1 Assessment Techniques
requires three steps
" Performing subjective and objective data quality assessments;
- Comparing the results of the assessments, identifying discrepancies, and determining root causes of discrepancies;
e Determining and taking necessary actions for improvement.
Information Quality (IQ) is one of the important aspects of any investigative process. The input to the investigative process (STMs) and the output of the investigative process (SARs) is heavily dependent on the information quality of the STMs that is submitted by various banking centers and business units all around the country. If the information quality is low, there might be a substantial delay in the process of investigation trying to identify the required information for the investigation. So the problem of low IQ is one of the pressing problems for Anti-money laundering process and we will discuss about the various methods of assessing quality scores and the key elements of information quality for SARs.
IQ scoring is considered difficult because the scoring is of subjective nature. User is an important source of Information Quality metadata. It is the user's expertise that decides that whether the information is good or not. In case of an extremely subjective content like STMs, the main element for scoring IQ is the understandability of the document and its usefulness to the investigative process.
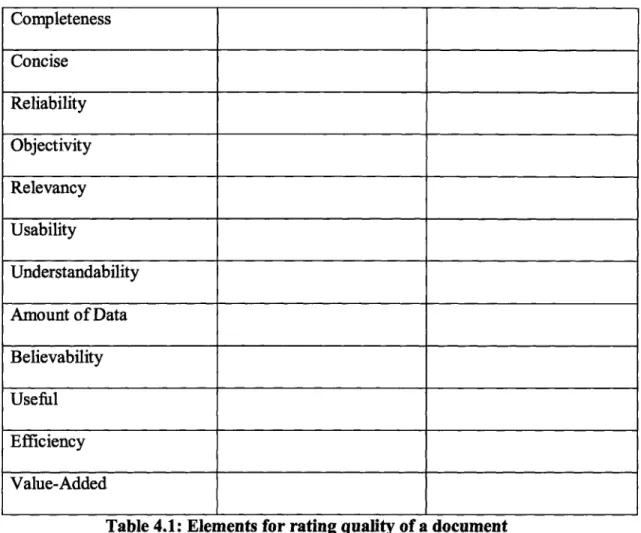
Element Weight Assessment method
Accuracy Consistency Timeliness
Completeness Concise Reliability Objectivity Relevancy Usability Understandability Amount of Data Believability Useful Efficiency Value-Added
Table 4.1: Elements for rating quality of a document
We will discuss about the key IQ criterions for the scoring process.
4.1.1 Subjective Criteria
" Concise Representation of the event " Interpretability of the event
" Relevancy to the investigation
" Understandability of the comments
4.1.2 Objective Criteria
The scores of the objective IQ can be determined by analysis of the information. So at this stage, we analyze the SARs for the following parameters. These methods should not be much time consuming and it should be updated with new scores on a regular basis.
" Completeness of the SAR received " Responsiveness of the submitter " Usefulness of the documentation
" Reliability of the information in the SAR " Timeliness of the SAR received
* Accuracy of the information
Process methodology for subjective criteria
Understandability doesn't have an obvious unit and so care should be taken to define the rule when defining it as well as assigning it. This rule should be well described; intuitive and it should be easy for the subject matter experts (SME) to assign appropriate scores. These scores have a range of 1- 10 and should be clearly mentioned to the SME's. Examples of good and bad write-ups should be defined as a part of the training process
Objective Criteria
To assess the precise score, sampling techniques can be used to reduce the time consuming process of evaluating all the SAR's. This score should be continuously
monitored for improvement of IQ. Assessment can be done with respect to the user of the information as well as with respect to the information source itself.
4.2 Data quality elements
Data unit Definition
Data unit is a predefined unit of data whose quality is being assessed (Ballou et at
1998) Data unit may consist of one or more components and data unit can be a
number or a record or a file or a spreadsheet or a report.
Data unit can be a predefined data definition that specifies the items in the data unit and their format. For example, a SAR can have data elements such as Account number, SSN and Address. Account numbers should be numerical, SSN should be a nine digit numerical number and Address can be twenty alphanumerical characters.
Completeness
Definition
Data unit is complete, if each of the data items constituting the data unit has been assigned a value conforming to the data definition for data item. If they are not, data unit is incomplete.
Examples of Incompleteness
" If SSN in the above example contains a 8 digit number instead of 9, the data
unit is said to be incomplete.
" Data unit is said to be incomplete if it contains only Account number, SSN but
Structural and Content Completeness
Ballou and Pazer (2003) present a definition of completeness that has two components. The metrics for each of these two components are
" Structural * Content
Structural Completeness = Values that are recorded / Values that could have been recorded
Content Completeness = Content that is conveyed / Content that could have been conveyed.
Accuracy
Accuracy is based on the data quality dimension of garbling (Wand and Wang, 1996)
Definition
Given that the data unit is complete, the data unit is incorrect if either of the two following conditions holds
" The data unit maps back to meaningless real world state
* The data unit maps back to wrong real world state. Example
From our previous example, account number that maps to the correct data definition, but a non-existing account in the bank. The data is complete, but not accurate.
The account number can be satisfying the completeness criteria of data definition, but it might be garbled making it useless. Even if the account number exists in the bank, it is not the correct account number for the record/data unit. Hence the data is
Time Related Quality
This section can be treated in terms on currency and volatility. Currency
Currency is the time duration from the time, the real world state changes to the time when the information system is updated. It is defined as the "age of the output information" (Kriebel, 1979)
Volatility
Volatility is the rate of change of real world system or the time for which data is valid (Ballou and Pazer, 1985)
The other time related dimensions would be Timeliness, Currency and age of the data. Ballou and Pazer defined timeliness as when "recorded data value is not out of date" and Kriebel defined timeliness as "the availability of the information suitable to use" For our example, timeliness would be the minimum 30 day period that the SAR must be investigated from the day suspicious activity is detected.
Timeliness is a data quality dimension and it should be user dependent. Any function that measures the timelines factor should capture the user's view of timeliness.
4.3 Critical element to be evaluated for assessing quality of SAR
According to Financial Crimes Enforcement Network, SAR document should have the following characteristics. They are as follows.
" Clear and accurate " Concise
" Thorough
" Whether crime committed or continues to be committed information
There is a 5W - lH analysis that is described as a part of best practices for SAR reporting. The individual elements of the 5W-IH analysis were decomposed based on system architecting principles and they are as shown below.
Who
" Suspects
o Relation with other suspects o Address (primary)
o Other addresses (p.o.box, apt numbers, etc.)
" SSN " Passport # * Drivers license # * Occupation * Position/Title * Nature of Business
Instruments involved " Wire transfers " Letters of Credit * Travelers Checks * Bank Drafts " Casinos Flow of Funds " Origination " Beneficiary
" All account numbers involved within Bank " Account numbers at other institution
o Name o Location
o Are any MSB's involved
o Foreign and International accounts
When
" Date of activity - individual date and amount * Period of activity
" (No tables/objects/ preformatted)
" Industry/business (casinos, mortgage, etc...)
* Nature of activities of business of similar customers.
" How is our customer different?
How
" Picture of suspicious activity
o Structuring o Wires
o Large cash transactions o Unusual / Different business
" Beneficiary
" Date and Destination
" Amount transferred " Accounts involved
" Frequency
Office of Foreign Assets Control verification
o Is suspect a citizen of OFAC list of countries?
Necessity
A SAR submitted should have the following characteristics. It should be " Clear and accurate in description
" Concise enough without any irrelevancy " Thorough
- Whether the crime is committed
E Whether crime continues to be committed.
Information in a SAR S 0 S S S S Who is reported? What is reported?
When was the crime committed? Where was the crime committed? Why is the crime being reported? How was the crime committed?
WHO
Occupation Position/Title Nature of Business
Relation with suspect(s) Address (Primary)
*Other address (P.O Box, Apt Numbers) *Identification (Passport, Driv.Lic, SSN, DOB)
WHAT
-* City
State
-b Zip
CASH INSTRUMENTS
Wire Transfer Traveler checks/ Drafts Deposit box M.O Casinos
Flow o funds
Suspect (s)
I I I I
Accounts Amount Frequency
I I
Name Location MSB involved Any Foreign Institutions
I
I
I
I
Name Location Account #s countries
Date of activity (s) Amount
WHEN
Branch name Location Gross amount
WHERE
I d
Multiple addresses institutions involved account numbers
4.4 SAR Factor Scoring Analysis
The above information quality scoring elements were analyzed using subject matter experts and our team came with 7 important elements to analyze the quality of SAR narrative. The following seven elements and their appropriate scoring are shown below.
The definition of different elements is given below.
" Completeness- All the necessary fields should be filled and must agree with the
Bank's database.
- Accuracy- The data must exist in the Bank's database and correspond to the subject in question.
Origination Beneficiary Date
" Timeliness- Timeliness is the time that it takes from the point that the activity or
transaction is found to be suspicious by the investigator.
- Objectivity- Results should be based on "who, what, why, when, where and how" and not on speculation.
- Relevancy- Results should only contain facts that correspond to the decision of the case.
- Understandability- SAR should be easy to read and follow. - Concise- SAR should be clear and succinct.
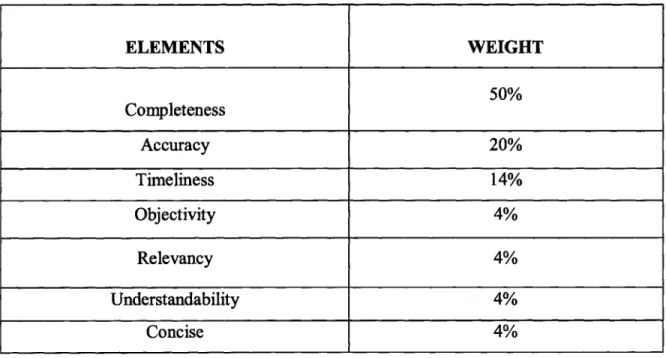
Table 4.4 SAR element Scoring Sheet
ELEMENTS WEIGHT 50% Completeness Accuracy 20% Timeliness 14% Objectivity 4% Relevancy 4% Understandability 4% Concise 4%
The individual break down of scores and its corresponding value is as shown in the table below. See Appendix 2 for a SAR form to understand the breakdown of values. The completeness factor account for 50% of the weight, accuracy accounts for 20%, timeliness accounts for 14%, objectivity, relevancy, understandability and conciseness represents 4% each. Completeness is composed of 10 individual sections accounting for 2% each and a SAR portion which accounts for 30%. The 10 individual sections are as given below with their breakdown of elements at every stage and the corresponding scores. Accuracy of all the other elements account for 20% and timeliness accounts for
14%. The last four elements namely objectivity, relevancy, understandability and conciseness applies to the narrative portion of the SAR and hence must be scored with additional care as to ensure the quality of the document.
The completeness factor was given a weight of 50%. The score of 50% will be distributed accordingly.
Completeness
Fields in SAR form Narrative
(20%) (30%)
1. Part 1. Reporting Financial Institution Information
Fields -Address of Branch, City, State, Zip Code (Elements -9, 10, 11, 12 in SAR form) -2 points
2. Part 1. Reporting Financial Institution Information Fields- Account Numbers affected, multiple accounts
(Elements - 14 in SAR form) - 2 points
~-~ 3. Part 2. Suspect Information
Fields- Last Name, First Name, Middle, Address, City, State, Zip Code, Country, Phone Number, Work Phone (Elements - 15,16,17,18,20,21,22,23,24,25 in SAR form) -2 points
4. Part 2. Suspect Information
Fields- SSN/TIN, Occupation/Business, Date of Birth, Forms of Identification
(Elements - 19,26,27,29 in SAR form) - 2 points
5. Part 2. Suspect Information
Fields- Relation to financial institution.
(Elements - 30 in SAR form) - 2 points. If internal
Ar-Employee, activate 28, 31, 32 in SAR form)
-. 6.
- * 7.
-- 8.
- 9.
Part 3. Suspicious Activity Information Fields- Date and Range of Activity
(Elements - 33 in SAR form) - 2 points
Part 3. Suspicious Activity Information Fields- Total Amount involved in activity (Elements - 34 in SAR form) - 2 points
Part 3. Suspicious Activity Information Fields- Summary characterization of activity
(Elements - 35 in SAR form) - 2 points
Part 4. Contact for Assistance
Fields- Last Name, First name, Middle name, Title, Phone Number
(Elements - 45,46,48,49 in SAR form) - 2 points
10. Part 5. Suspicious Activity Description
Fields- Explanation/Description
(Elements - 52 in SAR form) - 2 points
Total of 20 points is distributed for elements in the SAR form and remaining 30% of the score is distributed for the Narration portion of the SAR depending on 5W -I H analysis. This scale was verified using Mahalanobis Taguchi Method and the results were
4.5 Data Collection
To validate using the MTS method, good and bad data were needed for the analysis and hence a sample set of good and bad SARs were created. SARs that were submitted by the
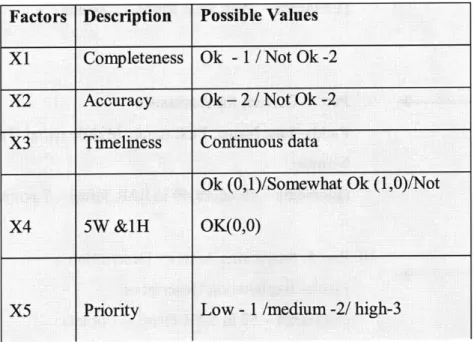
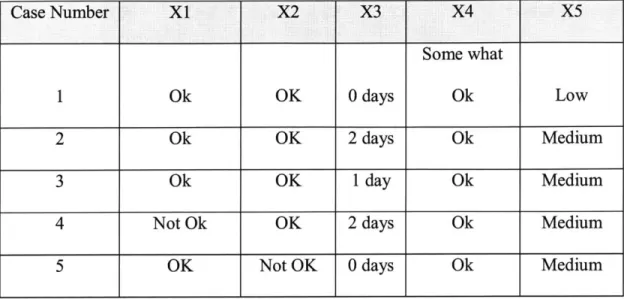
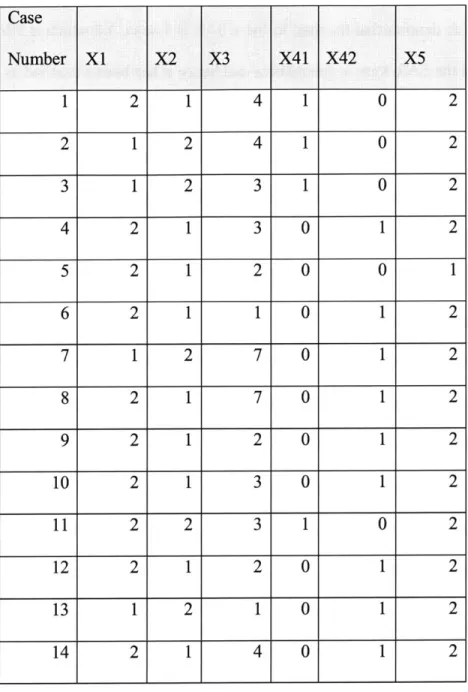
investigators were taken and analysis was done to know the variables that are important in determining the quality of the SAR. Five different variables that were critical to the SAR quality were created and they are as follows.
Factors Description Possible Values
Xl Completeness Ok - 1 / Not Ok -2 X2 Accuracy Ok -2 /Not Ok -2
X3 Timeliness Continuous data
Ok (0, 1)/Somewhat Ok (1,0)/Not
X4 5W &1H OK(0,0)
X5 Priority Low - 1 /medium -2/ high-3
Table 4.5.1 Variable description
The five factors that were chosen for measuring the quality of the document were
Completeness - The completeness factor of a SAR has two values; if all the elements of the SAR are completed by the investigator, Ok is assigned. If some elements are missing,