Development and Application of an Analysis Methodology for
Satellite Broadband Network Architectures
by
Tatsuki Kashitani
B.S., Engineering and Applied Science
California Institute of Technology, 1999
Submitted to the Department of Aeronautics and Astronautics
in Partial Fulfillment of the Requirement for the Degree of
Master of Engineering in Aeronautics and Astronautics
at the
MASSACHUSETTS INSTITUTE OF TECHNOLOGY
June 2002
Author ...
AERO
MASSACHUSETTS INSTITUTE OF TECHNOLOGYAUG
1 3 2002
LIBRARIES
@2002 Tatsuki Kashitani. All Rights Reserved
The author hereby grants to MIT permission to reproduce and
distribute publicly paper and electronic copies of this thesis document
in whole or in part.
.
.... ...
...
Department of Aeronautics and Astronautics
May 23rd 2002
Certified by
Certified by ..
Certified by .1
.( 1 1Accepted by ...
S. ...Charles Boppe, Senior Lecturer
Dypartnient of Aeronautics and Astronautics
Thesis Supervisor
...
P ul Cefola, Technical Staff Lincoln Laboratory
Lectur r, Department of Aeronautics and Astronautics
Thesis Supervisor
. ...
Eytan Modiano, Assistant Professor
Iepartijient of Aeronautics and Astronautics
Thesis Supervisor
..
...
.
Development and Application of an Analysis Methodology for
Satellite Broadband Network Architectures
by
Tatsuki Kashitani
Submitted to the Department of Aeronautics and Astronautics on May 23rd, 2002, in partial fulfillment of the
requirement for the degree of
Master of Engineering in Aeronautics and Astronautics
ABSTRACT
An analysis methodology for analyzing the technical and economic performance of a satellite network system has been developed and implemented. It was applied to a set of satellite broadband network system designs based on the five systems in Ku-band recently proposed to the Federal Communications Commission. The considered systems represent satellite constellations with low Earth orbits (LEO), medium Earth orbits (MEO), and highly elliptic orbits (HEO). The technical and economic performance of the systems was evaluated by the metric: cost per billable T1 minute required to achieve an internal rate of return of 30 % with key technical requirements satisfied. The robustness of the system with respect to the fluctuation in the market size was also examined. Various assumptions were made to allow a unified comparison and modeling of the systems. As a consequence, the analyzed system designs are only similar to the FCC filings. The computed results show that the preferred system differs for different levels of market demand. The MEO and HEO systems are better in low demand scenarios. The LEO systems can support very large number of customers and achieve low cost per subscription in high demand scenarios. In terms of robustness to the market fluctuations, the HEO system, which has the ability to deploy by sub-constellation, showed an improved metric by adapting the deployment schedule to the demand size. A computer tool has been developed to automate this methodology in order to efficiently evaluate the performance metric from a set of design variables.
Thesis Supervisor: Charles Boppe Title: Senior Lecturer
Thesis Supervisor: Paul Cefola
Title: Lecturer, Technical Staff Lincoln Laboratory Thesis Supervisor: Eytan Modiano
Acknowledgements
This thesis would not have been possible without the help from many people. First I would like to thank my thesis supervisors Charles Boppe, Paul Cefola, and Eytan Modiano. Charles Boppe from the MIT aeronautics and astronautics department has always been caring and supportive since I arrived at MIT. Paul Cefola from MIT Lincoln Laboratory has given a lot of information and directions that were absolutely necessary for this thesis. He also put me in contact with people and resources outside of MIT. Eytan Modiano from the MIT aeronautics and astronautics department provided clear and precise insights to our problems with his expertise in communications.
I would like to thank John Draim and Rich Inciardi of Space Resource America Corporation for supporting this study. They provided valuable information and guidance from the beginning of the study. David Carter, Ron Proulx, and Duane Larsen from Draper Laboratory helped me in many technical aspects.
I would like to thank Cyrus Jilla for working together with me. He has been my role model of a superb graduate student and is receiving a PhD from MIT this year. I thank Melahn Parker who received a Master of Engineering degree last year for starting and working on this project with me.
Many members of the MIT aeronautics and astronautics department helped me. I thank John Hansman for sharing his opinion on the application of satellite networks in the air transportation industry. I thank Frederick Donovan for taking care of the computers and software. I also thank Daniel Sheehan, the spatial data specialist at MIT information systems, for helping with the data conversion.
The versatility of the MATLAB software from the MathWorks, Inc. assisted me in implementing the methodology as a computer tool. The Satellite Tool Kit developed by the Analytical Graphics, Inc. was also very helpful.
I would like to thank all of my friends. They helped even when they did not know they were helping.
Biographical Note
Tatsuki Kashitani received a Bachelor of Science in engineering and applied science from California Institute of Technology in 1999. He has been studying as a candidate for the Master of Engineering degree at the MIT aeronautics and astronautics department since September 2000. After the expected graduation in June 2002, he plans to work at the Nagoya Propulsion and Guidance Works of Mitsubishi Heavy Industries Ltd. in Japan. He can be contacted by electronic mail at [email protected].
Table of Contents
1 Introduction...17
1.1 Satellite Broadband Networks ... 17
1.2 Thesis Objective...18
1.3 Overview of Thesis...18
2 Background...19
2.1 Satellite Constellations ... 19
2.2 Overview of the Proposed Network System s in Ku-Band ... 20
2.2.1 Boeing ... 21
2.2.2 HughesLINK ... 21
2.2.3 HughesNET ... 21
2.2.4 SkyBridge...22
2.2.5 Virgo ... 22
2.3 Past Studies on Satellite Constellation Perform ance... 22
2.3.1 M ichael D. Violet & Cary C. Gumbert... 23
2.3.2 Andjelka Kelic...23
2.3.3 Graem e B. Shaw ... 23
2.3.4 M elahn L. Parker ... 24
3 M ethodology ... 25
3.1 Requirem ents on M ethodology ... 25
3.2 Overview of M ethodology... 25
3.2.1 System Goal...26
3.2.2 Custom er Needs...26
3.2.3 Find Key Param eters... 27
3.2.4 Technical Requirements... 32
3.2.5 Perform ance M etric ... 32
3.2.6 System M odel...33
3.3 Implem entation of M ethodology... 33
4 System M odel ... 35
4.1 System M odel Overview ... 35
4.1.1 Design Vector...35
4.1.2 Constants Vector...36
4.2 Constellation and Satellite M odel ... 37
4.2.1 Orbital Param eters ... 37
4.2.2 Spare Satellites ... 38
4.2.3 M ass ... 39
4.2.4 Dim ension ... 39
4.2.5 Power ... 40
4.3 System Capacity M odel... 41
4.3.1 Overview of Capacity Simulation ... 41
4.3.2 Assumptions on Capacity Simulation... 41
4.3.3 Orbit Propagation...42
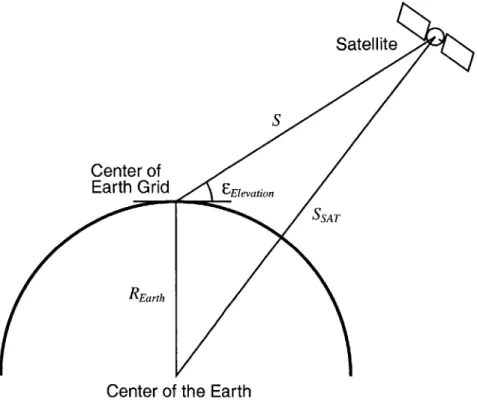
4.3.4 Link Geom etry...42
4.3.5 Assumptions on Link Calculation ... 44
4.3.6 Link Capacity ... 45
4.4.2 Satellite Production Costs ... 47
4.4.3 Satellite Non-Recurring Costs... 48
4.4.4 Launch Costs...49
4.4.5 Insurance Costs...50
4.4.6 Ground Station Costs... 50
4.4.7 Cost M odel Results... 51
4.5 M arket M odel...52
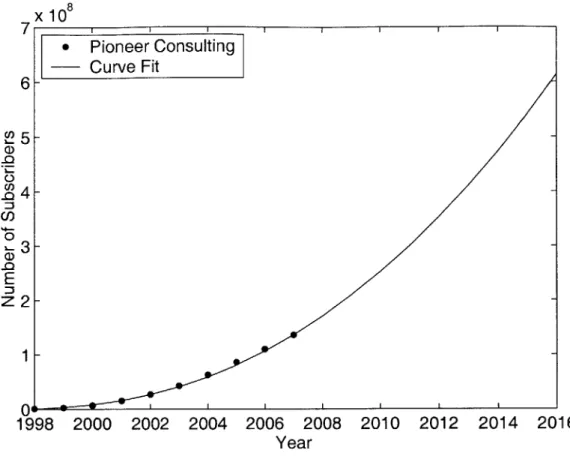
4.5.1 M arket Size...53
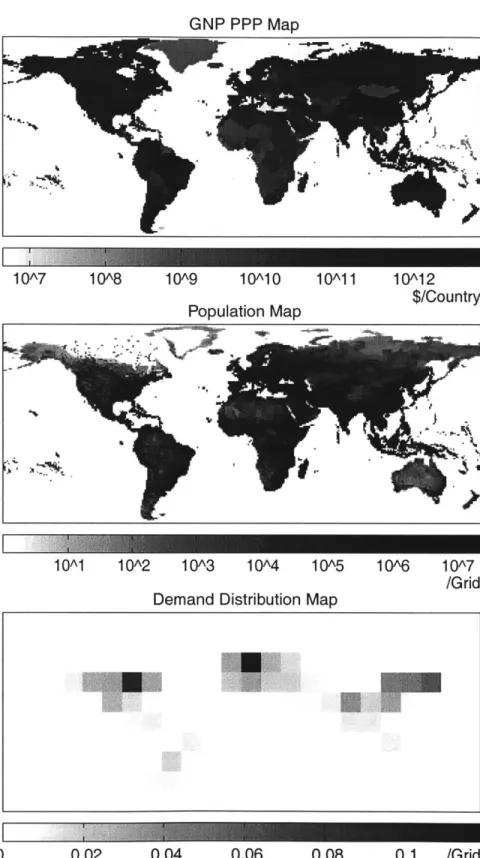
4.5.2 M arket Geographic Distribution... 54
4.6 Capacity-Dem and M atching... 57
4.6.1 Assumptions on Capacity-Demand M atching... 57
4.6.2 Capacity-Dem and M atching Algorithm ... 57
4.7 M etric...59
4.7.1 Assumptions on M etric Calculation ... 59
4.7.2 M etric Calculation ... 60
4.8 Benclm arking against Estim ations of the FCC Filings... 61
4.8.1 Satellite M ass Benchm arking ... 61
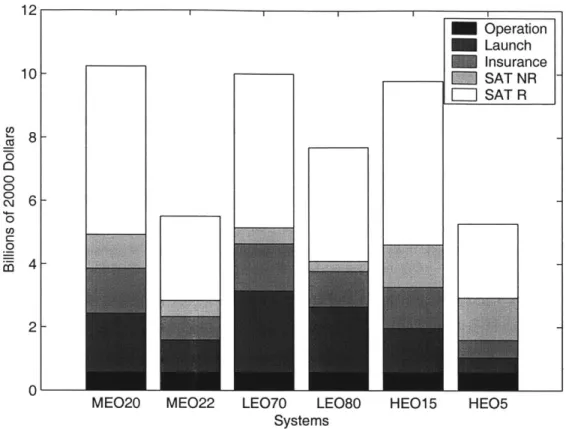
4.8.2 System Costs Benchmarking... 62
5 Results ... 65
5.1 M arket Capture...65
5.2 Cost per TI M inute M etric... 67
6 Conclusion ... 71
7 Future W ork ... 73
7.1 M odel Fidelity...73
7.2
M arket M odel...737.3 Phased Deploym ent Granularity ... 74
7.4 User Term inal Initial Cost ... 74
Bibliography ... 75
Appendix A: N2 Diagram ... 79
List of Figures
Figure 3.1: QFD Requirements Matrix Relating Customer Needs to Technical Requirements. ..29
Figure 3.2: QFD Design Matrix Relating Technical Requirements to System Parameters...31
Figure 3.3: Decomposition of Computerized Analysis System Into Modules...33
Figure 4.1: Link Geometry between Satellite and Earth Grid...43
Figure 4.2: Break Down of System Costs Estimated by the Cost Model ... 52
Figure 4.3: Estimate of Broadband Subscriber Growth and Curve Fit...54
Figure 4.4: Global Distribution Maps of GNP PPP, Population, and Estimated Market Demand. ... 5 6 Figure 4.5: Benchmarking by Satellite W et M ass. ... 62
Figure 4.6: Benchmarking by Systems Cost up to the First Year of Operation...63
Figure 5.1: Market Capture of the LEO70, LEO80, MEO20, ME022, and HEO Systems. ... 66
Figure 5.2: Cost per TI Minute Metric at Different Market Demand Levels. ... 68
List of Tables
Table 2.1: Summary of Proposed Broadband Satellite Systems in Ku-Band. ...
21
Table 4.1: Elements of The Design Vector And Their Symbols...35
Table 4.2: Elements of the Constant Vector with Their Symbols, Values, and Units...36
Table 4.3: Assumptions for Link Calculations...
44
List of Symbols
aSA T Clabor Cnurance CLaborGS Cau.c h CLV CPF CSAT CSubscription - 2000 CSubscriptionNominal CSubscription - PV CTFU C TotalPV dinclination DLV -fairing DMarket DSA T dpayload dSAT e Eb/ No fDownlinkfUser _ Downlink Power
fDry - Mass fInsurance
fNR
_GSfNR
_SATfPayload
fSatellite GPA G~ser h hLV -fairingSemi-Major Axis of Satellite's Orbit Cost of Unit Labor
Total Insurance Cost
Total Ground Station Labor Cost Total Launch Cost
Cost of a Launch Vehicle Cost per Minute of Subscription
Satellite Capacity (Number of Simultaneous Users Satellite Can Support) Charge for Subscription-Year in Constant 2000 Dollars
Charge for Subscription-Year in Nominal Dollars Charge for Subscription-Year in 2000 Present Value
Theoretical First Unit Cost per Kilogram of Satellite Dry Mass Total System Cost in 2000 Present Value
Degradation in LV Performance per Degree of Inclination Increase Diameter of Launch Vehicle Fairing
Distribution of Broadband Market Diameter of Satellite Bus
Payload Power per Payload Mass Satellite Density
User Terminal Antenna Aperture Diameter Eccentricity of Satellite's Orbit
Signal-to-Noise Ratio Required for User Downlink User Downlink Frequency
Fraction of User Downlink Power in Payload Power Fraction of Dry Mass in Wet Mass
Insurance Rate
Non-Recurring Cost Factor of Ground Stations Non-Recurring Cost Factor of Satellites
Fraction of Payload Mass in Dry Mass
Fraction of Satellite Market in Total Broadband Market Gain of Satellite's Phased Array Antenna for User Downlink Gain of User Terminal Antenna
Altitude of Satellite's Orbit Height of Launch Vehicle Fairing
ilnflation iRR LA LGS LLV LRain+Margin Ls 'SAT M Broadband M Dy mGrid MLV MPayload M Satellite MWet NGrid NGS NPlanes NRSA T NSAT
nSAT _ per _ Plane NSATProduced NSpare
nSpare _ per _ Plane
NSUB nSUB PC PMin -Coverage Prayload PUser Dwonlink PUser Downlink EIRP
PUser Downlink _ RF
REarth
Inclination of Satellite's Orbit Inflation Rate
Internal Rate of Return Atmospheric Loss
Labor Required for a Ground Station Launch Site Latitude
Rain and Link Margins Space Loss
Height of Satellite Bus
Size of Total Broadband Network Market Demand Satellite Dry Mass
Number of Potential Customers in Earth Grid Launch Vehicle Performance
Launch Vehicle Margin Mass of Satellite Payload
Size of Satellite Broadband Network Market Demand Satellite Wet Mass
Number of Earth Grids Number of Ground Stations Number of Orbital Planes Non-Recurring Cost of Satellites Number of Satellites
Number of Satellites per Orbital Plane Number of Satellites Produced
Number of Spare Satellites
Number of Spare Satellites per Orbital Plane Number of Subscribers
Number of Subscribers in One Earth Grid Potential Customer Map
Minimum Coverage Probability Required Satellite Payload Power
Satellite's Power Used for User Downlink
Satellite's Effective Isotropic Radiated Power for User Downlink Satellite's Radiated Power Used for User Downlink
RGS rMax_ Allocation RPy RSAT rSAT R~ser Rrotal rUsed S SSAT SSAT SGS TFUSAT TFUGS Tuser VSAT y A# EElevation EMin_ Elevation 1 Amplifier MA 1lUser ADownlink USAT Q SAT
Total Recurring Cost of Ground Stations
Maximum Resource Allocatable to One Earth Grid Link System's Total Revenue in Present Value
Total Recurring Cost of Satellites Satellite's Resource Available Individual User Terminal Data Rate Total Downlink Data Rate
Satellite's Resource Used for an Earth Grid Link Transmission Pathlength from Satellite to Earth Grid
Radius of Satellite's Position with respect to the Center of the Earth Learning Curve Slope for Satellite Production
Learning Curve Slope for Ground Station Production Theoretical First Unit Cost of Satellite
Theoretical First Unit Cost of Ground Station User Terminal System Noise Temperature
Satellite Bus Volume Year
Relative Phasing between Satellites in Adjacent Orbital Planes Elevation Angle of Satellite Seen by User
Minimum Elevation Angle Required Amplifier Efficiency
Efficiency of Multi-Access Scheme
User Terminal Antenna Illumination Efficiency Downlink Wavelength
True Anomaly of Satellite
List of Acronyms
CDMA Code Division Multi-Access
CPF Cost Per Function
DSL Digital Subscriber Line
EIRP Effective Isotropic Radiated Power FCC Federal Communications Commission FDMA Frequency Division Multi-Access GEO Geostationary Earth Orbit
GINA Generalized Information Network Analysis GNP Gross National Product
HEO Highly Elliptic Orbit
LEO Low Earth Orbit
LV Launch Vehicle
MDO Multidisciplinary Design Optimization MEO Medium Earth Orbit
MIT Massachusetts Institute of Technology
PPP Purchasing Power Parity
PV Present Value
QFD Quality Function Deployment
QPSK Quadrature Phase Shift Keying TDMA Time Division Multi-Access
1 Introduction
1.1 Satellite Broadband Networks
Data communication has become an important infrastructure in today's society. Personal,
commercial, and government activities depend more and more on digital networks. As a
consequence of this increase in broadband demand, many means of providing digital network
connections compete for subscribers. The Federal Communications Commission (FCC) has been
conducting a series of national surveys on the deployment of broadband networks to business
and residential users since 1998. They define advanced communications capability as network
connection with 200 kbps or greater data rate in both directions, and assess the availability in the
United States. The three reports released so far indicate rapid deployment each year [FCC,
1999a; FCC, 2000; FCC, 2002a].
Over the past few decades, the world has seen the emergence and evolution of many
technologies to provide digital network connection: modems that talk over analog phone lines,
digital subscriber lines (DSL) that use a higher frequency band on phone lines, cable modems
that use cable television lines, fiber optics that transmit signals through fiber optical cables, and
satellite links that send signals on electro-magnetic waves back and forth to satellites.
With the successes of the Syncom satellite in 1963, technology became available to utilize the
geostationary orbit. Since then the geostationary orbit has been the most common choice for
communication applications, and other orbits have not been used as much [McLucas, 1991].
However, communication service using a constellation of satellites in lower altitude has been
conceived and put into service today. For example, Globalstar and Iridium were deployed to
provide global mobile phone service. These systems, however, experienced severe financial
difficulties and filed for bankruptcy soon after service started.
In 1999, FCC received applications for non-geostationary data communication systems in the
Ku-band from Boeing, Hughes (two applications), SkyBridge, and Virtual Geosatellite [FCC,
1999b; Boeing, 1999; Hughes, 1999a; Hughes, 1999b; SkyBridge, 1997; SkyBridge, 1999;
Virtual Geosatellite, 1999]. These satellite systems aim to deliver broadband network
connections to residential and business users. Their architectures represent LEO (low earth orbit),
1.2 Thesis Objective
Given the financial difficulties that the two major satellite mobile phone ventures experienced in the late 1990's, the economic viability of satellite ventures should be assessed in the very early stages of design. However, such an assessment and unified comparison has not been carried out for the proposed broadband satellite systems highlighted above.
This thesis 1) describes a systems engineering methodology that has been developed and implemented to analyze the technical and economic performance of different broadband satellite networks and 2) provides some initial computed results for the point designs based on the proposed systems, and 3) suggests potential areas for future work.
1.3 Overview of Thesis
The next chapter provides background information on the proposed satellite network systems and their analysis. Chapter 3 explains the approach to the analysis problem, and Chapter 4 goes into the details of the developed models. The result is presented in Chapter 5. Chapter 6 concludes the thesis, and Chapter 7 suggests areas for further investigations. References and Appendices follow.
2 Background
2.1 Satellite Constellations
The idea of providing communication service by a constellation of satellites became a reality in
the 1990's. It was thought that a constellation of small satellites at low altitude could provide
wide coverage at competitive cost and schedule compared to other alternatives such as
geostationary satellites and ground-based technologies. It was considered that the low-altitude
reduces transmission delays, decreases satellite size and launch cost, and justifies multiple
satellites and multiple launches.
In a typical satellite constellation, satellites are placed into coordinated orbital planes and orbits
known as the Walker delta patterns. Three of the five studied systems are based on the Walker
constellation (Boeing, SkyBridge, HughesNET). A Walker constellation consists of circular
orbits of equal altitudes and inclinations. The orbital planes are evenly distributed around the
equator, and the satellites are evenly distributed in the orbital planes. The number of orbital
planes, the number of satellites per orbital plane, and the relative spacing between satellites in
adjacent orbital planes characterize a Walker delta pattern. More recent constellations explore
the utilization of elliptic orbits, mixed altitudes, and mixed inclinations. Hybrid constellations
such as Ellipso use a mix of circular and elliptic orbits [Draim et al., 1992; Draim et al., 1997;
Draim et al., 2000].
Two satellite constellations were deployed in the late 1990's to provide global mobile phone
service. The Iridium system consists of 66 satellites in six near-polar orbital planes. The altitude
of the orbit is
785
km. The satellites are capable of downlink, uplink, inter-satellite link, and
routing calls. The functionality and capability pushed the Iridium satellites to be quite
complicated and large. The Globalstar system, on the other hand, consists of 48 satellites at 1410
km altitude in eight orbital planes inclined at 52 degrees. The architecture of the Globalstar
system emphasizes simplicity, and utilizes terrestrial infrastructure to a greater extent than the
Iridium system [Gumbert, 1996].
Both the Iridium and the Globalstar ventures faced severe financial hardships once in operation.
The number of subscribers did not grow as expected. The deployment of the Iridium system
system. However, Iridium was forced to file for a bankruptcy in August 1999 [Space News, 1999]. The Iridium satellites were once to be de-orbited for safe disposal, but a new company acquired the system to continue service. Iridium is now providing satellite communications services to the U.S. Government and commercial users [Space News, 2000]. Globalstar started service in 2000, but also filed bankruptcy in 2002 [Space News 2002]. The primary cause of these financial hardships was the uncertainty in the market with the high initial cost of the user terminals. Also, the terrestrial mobile phone service deployed faster at lower price. The satellite mobile phone became an expensive gadget for many people once their commonly visited areas were covered by terrestrial mobile phone service.
This implies that the robustness of the system architecture with respect to the fluctuation in economic circumstances is particularly important for success of these commercial satellite network ventures.
2.2 Overview of the Proposed Network Systems in Ku-Band
Upon receiving the first application from SkyBridge in 1997, the FCC called for others to file application for non-geostationary data communication systems in the Ku-band and established the cut-off date of January 8, 1999 [FCC, 1998]. This was done to allocate the spectrum to the most promising proposals. In 2002, FCC announced that these systems may advance their plans pending the creation of a frequency sharing and interference avoidance method so that they can operate simultaneously [FCC, 2002b; FCC, 2002c]. In this thesis, proposals from Boeing, Hughes (two applications), SkyBridge, and Virtual Geosatellite have been selected as representative candidates because they are relatively similar in system architecture and focus on providing digital network connection only. Pentriad was dropped from the study since it tries to provide broadcasting service with the same system. Table 2.1 summarizes the characteristics of the proposed systems. To standardize for comparison, it was assumed that the system development starts in the year 2001, and the network service is provided from 2006 to 2015. Other standardization will be discussed in later sections.
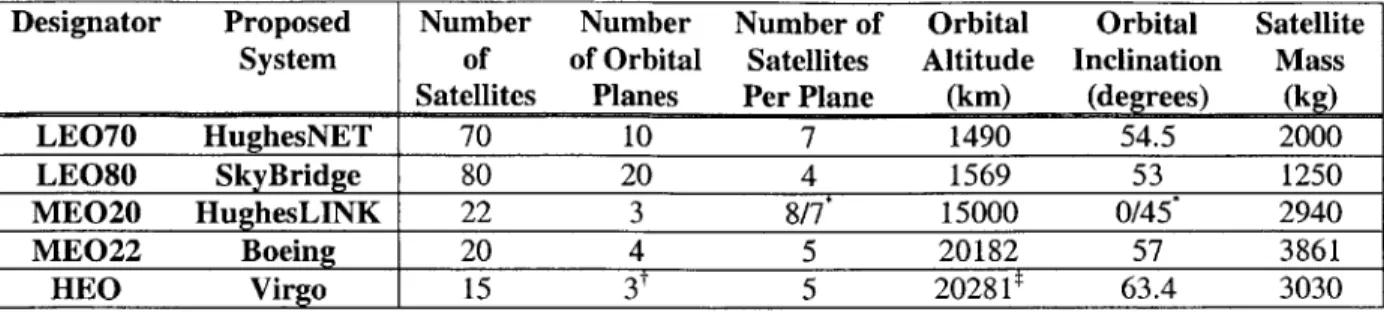
Table 2.1: Summary of Proposed Broadband Satellite Systems in Ku-Band.
Designator Proposed Number Number Number of Orbital Orbital Satellite System of of Orbital Satellites Altitude Inclination Mass
Satellites Planes Per Plane (km) (degrees) (kg)
LEO70 HughesNET 70 10 7 1490 54.5 2000
LEO80 SkyBridge 80 20 4 1569 53 1250
MEO20 HughesLINK 22 3 8/7* 15000 0/45' 2940
ME022 Boeing 20 4 5 20182 57 3861
HEO Virgo 15 3t 5 20281' 63.4 3030
One equatorial plane with eight satellites and two inclined planes with seven satellites each. tNumber of sub-constellations. *Semi-major axis.
2.2.1 Boeing
Boeing proposed a system with 20 satellites at 20182 km altitude in four orbital planes. The Boeing satellites are the largest of the five systems. The Boeing system is designed to provide "bandwidth on demand" communication services to corporate, institutional, governmental and large professional users. The provided data rate goes up to 240 Mbps [Boeing, 1999].
2.2.2
HughesLiNK
HughesLINK is proposed by Hughes Communications. HughesLINK is a MEO constellation with 22 satellites at 15000 km altitude in three orbital planes. HughesLINK constellation uses a mix of the equatorial orbital plane and inclined orbital planes. The number of satellites per plane also differs for the equatorial and inclined planes. The system intends to provide broadband communications services at data rates from 1.54 Mbps to 155 Mbps [Hughes, 1999a].
2.2.3 HughesNET
HughesNET is a LEO constellation designed to work with the HughesLINK. It consists of 70 satellites in ten orbital planes at 1490 km altitude. HughesNET aims to provide broadband communications services to wide range of users worldwide at data rates from 512 kbps to 10 Mbps [Hughes, 1999b].
2.2.4 SkyBridge
The SkyBridge constellation has the largest number of satellites, but the satellites are the smallest of the five systems. The SkyBridge constellation consists of 80 satellites at 1569 km altitude in 20 orbital planes. The design of the architecture emphasizes simplicity. The satellites function in "bent pipe" fashion, just bouncing signals between user terminals and gateways [SkyBridge, 1997; SkyBridge, 1999]. However, this low complexity design of SkyBridge satellites could not be modeled since the simulation uses one generic satellite model, and cross-link capability is assumed.
2.2.5 Virgo
Virgo consists of three sub-constellations with five satellites each. Each sub-constellation consists of five elliptic orbits in different inertial orbital planes inclined at the critical inclination of 63.4 degrees. This inclination prevents the drifting of apogee caused by the non-spherical shape of the earth. The elliptic orbits have the semi-major axis of 20281 km and the eccentricity of 0.66. Satellites above a certain altitude are in "active arc" and turned on, while satellites below the active arc altitude are turned off. As a consequence, there are three active satellites in each sub-constellation at any moment. Since the satellites are active near the apogee, they appear to move relatively slowly in the user's field-of-view. The unique feature of Virgo system is that one sub-constellation alone can cover the northern or southern hemisphere continuously [Virtual Geosatellite, 1999]. Other systems require that their entire system be deployed to maintain coverage. The simulation captures this feature. Since Virgo has three sub-constellations, the deployment schedules of the second and third sub-constellations were allowed to adapt to the market size.
2.3 Past Studies on Satellite Constellation Performance
There have been several studies on the technical and economic feasibility of satellite network constellations. At MIT, several graduate theses investigated satellite network constellations with LEO, MEO, GEO, and elliptic orbits for mobile phone and data communication networks. The MITRE Corporation has conducted large detailed studies of mobile phone systems [Ciesluk et al., 1992; Gaffney et al., 1994]. This thesis builds upon and extends these studies. To model and
simulate complex behavior of the satellite network systems, an analysis framework and
simplifying assumptions were adopted from the past studies. To better understand the
significance of market fluctuation on the cost per billable TI minute metric and the survival of
the system, the balance of model fidelity balance and computing expense were assessed. This
made it possible to explore much larger market fluctuations.
2.3.1 Michael D. Violet & Cary C. Gumbert
Michael Violet and Cary Gumbert compared six mobile satellite phone systems using a cost per
billable minute metric. The considered systems included two LEO systems, two MEO systems,
one GEO system, and one hybrid system with circular and elliptic orbits. Using computer
simulations, the cost of one billable minute of a phone call was estimated for each system
assuming three different levels of market penetration. It was found that market penetration has
the significant effect on the cost of the service. The studies also indicated that results could be
very dependent on factors such as marketing strategy, which are difficult to incorporate in
computer models [Violet, 1995; Gumbert, 1996; Gumbert et al., 1997].
2.3.2 Andjelka Kelic
Kelic carried out a similar analysis to Violet and Gumbert on broadband satellite systems using
a cost per T1 minute metric. The investigated systems included four GEO systems and one LEO
system. It was again shown that the cost per billable T1 minute metric was highly sensitive to
market variations [Kelic, 1998].
2.3.3 Graeme B. Shaw
Shaw developed a systematic analysis methodology named Generalized Information Network
Analysis (GINA) to assess the performance of distributed satellite systems. The GINA analysis
looks at a satellite mission as an information process in which information is generated, gathered,
transmitted, and exchanged. Then methods from information theory are applied to assess
performance and satisfaction of requirements. Shaw applied this methodology to broadband
satellite systems as one of the case studies [Shaw, 1999].
2.3.4 Melahn L. Parker
Parker analyzed satellite network architectures emphasizing the altitude and number of satellites
in the constellation. He sampled many proposed systems and added ones he created from scratch.
The cost per subscription was used as the metric to compare the different constellations and to
study the design space trends [Parker, 2001].
3 Methodology
This chapter provides an overview of the approach that was taken to assess the technical and
economic performance of different satellite broadband networks.
3.1 Requirements on Methodology
As a system engineering tool to be used in the conceptual design phase, the methodology itself is
subject to requirements. The identified requirements are:
1) Since the satellite network system design is in its initial phase, only top-level information
is available. The methodology must work with this limited information.
2) The intended use of the methodology is comparing design alternatives, exploring the
design space, optimization, and sensitivity analysis. These usages require the
methodology to return the computed result quickly so that it can be iterated.
3) These usages also require automation.
4) And last but not least, the methodology must be accurate.
3.2 Overview of Methodology
The problem being considered is a multidisciplinary problem since it involves many disciplines
from orbital dynamics to economic analysis. The approach to this problem was adopted from the
Multidisciplinary Design Optimization (MDO) theory. MDO is a framework for optimizing a
system design that involves a number of disciplinary areas coupled to each other. MDO suggests
the following step to approach problems [De Weck et al., 2002].
1) Define overall system requirements.
2) Define design vector, objective, and constraints.
3) System decomposition into modules.
4) Modeling of physics via governing equations at module level.
5) Model integration into an overall system simulation.
6) Benchmarking of model with respect to a known system from past experience.
7) Design space exploration to find sensitive and important design variables.
8) Formal optimization to find optimum.
9) Post-optimality analysis to explore sensitivity and tradeoffs.
Steps 1) to 6) were adopted and applied to the modeling and simulation of satellite broadband network systems in this thesis.
The proposed systems were compared by a single metric and the sensitivity of the metric to market demand fluctuations. The metric used is the cost per billable T1 minute achieving a 30 % internal rate of return. To enable the modeling and simulation, many simplifying assumptions were made. In simplifying the problem, the system goal was derived from the customer needs, and important technical parameters were identified by relevance to the system goal and customer needs. These parameters were incorporated in the models. The fidelity of the models is checked by benchmarking against the estimations in the FCC filings
The following sections explain how this approach was implemented.
3.2.1 System Goal
The unified goal of the satellite network systems must be clearly defined to meaningfully discuss and compare them. Although the stated goals of the five proposed systems differ in many aspects such as network data rate, target users, etc., they were altered to pursue an identical goal. The goal is to provide TI data rate (1.54 Mbps) network connections to business and residential users while achieving a 30 % internal rate of return.
As a consequence, the systems that are compared in this thesis are not the exact representation of the proposed systems. Rather, they are the design space "point designs" based on the proposed systems. Only the variables in the design vector characterize and differentiate the architectures, although this takes pages of technical details in the FCC filings. The results presented later must be interpreted understanding that the findings are influenced by this simplification.
3.2.2 Customer Needs
In this study, it was decided to model the business and residential markets as potential customers, although satellite information networks are and will be used in many more applications given the
expected rise in data rate and cost-effectiveness. For example, tele-medicine, tele-education, military, or mobile network connection on airplanes and ships, etc may become the "killer application." It is hard, however, to model these emerging applications. The size and distribution of such a market cannot be modeled with satisfactory confidence to extrapolate to the future. Because of this uncertainty it is important to assess the adaptability of the proposed systems to variability in market size.
The satellite network system must be aligned with the needs of customer for the system to be successful. Three major needs identified are availability, data rate and integrity of the connections. Availability is defined as the probability of establishing network connections when a customer wants it in the service area. Availability can further be decomposed into geographical and temporal availability. Data rate is the primary factor when consumers shop for network service providers. Thus, for a satellite network system to be successful in the market, the data rate must be competitive. Although integrity is not explicitly advertised or looked for in the consumer network service provider market, it is implicitly assumed that the provided connection has a certain quality.
3.2.3 Find Key Parameters
Upon identifying the customer needs, the Quality Function Deployment technique was used to identify important technical requirements and important system parameters.
In modeling the satellite network systems, complete modeling and simulation of all of the involved physical and information processes is clearly impossible. Simplification is necessary. This must be done in a way that the simplified model still captures the trends and tradeoffs in the design space. The
QFD
technique helps identify important parameters by visually representing the relationships from user needs to technical requirements and from technical requirements to parameters in a traceable fashion. The relationship between each customer need and each technical requirement is ranked none, weak, medium, or strong (in this case by physical laws and engineering intuition). When the relationship matrix is populated with the strength of relationship, the technical variables can be ordered by the relevance to the customer needs [Clausing, 1993].Figure 3.1 is the QFD requirements matrix, which relates customer needs to technical requirements. The matrix in the center is the relationship matrix filled with signs that indicate the strength of the relationship. To the left of the relationship matrix, customer needs are listed with the weighting. Above the relationship matrix, technical requirements and constraints are listed. The triangular matrix above the technical requirements contains the dots indicating the conflicts of requirements. Below the relationship matrix, the priorities of the technical requirements are listed. The upper row contains the absolute score which is the sum of the product of customer needs weight and relationship weight for each technical requirement. The lower row contains the normalized score between one and ten.
Data rate, geographical and temporal coverage, and bit error rate (BER) were chosen as the technical requirements that directly reflect the user needs discussed in the previous subsection. The results also indicated that the scalability and capability to operate with a partial constellation are important. Among the five systems compared, the HEO system has the ability to operate with partial constellation. It was decided that this feature should be reflected in the model and investigated.
0C C~
~
0 (1 C D0C a'C 0f -0 M CA CD oLCO MC Co CD(aCD CD 0 D .0 0i Cl)CD CA -4 (D~CL
CD ' 92 9w 0T T1=1.54 Mbps iO O 0 0 High Data Rate Matched w/ Market o 0 O O Geographic Coverage 98C% 0 001 0 0 High Percent Temporal Coverage 5 mins L 0 > 0 Low Mean Response Time Matched w/ Market o 0 0 0 10 0 Total System Capacity 010 0 0 Robust Satellite 0 0 0 Complement Exisiting Infrastructure J1 00 0 0 Fault Avoidance 010 0 0 Fault Tolerance 01; 0-00 0 Functional Redundancy O 0 0 > e > Low Latency Less Than 10/-9 CD 0 > 0 Low BER 01 -0 -Low Satellite Complexity o o . 0 0 High Scalability 0 > Low Orbital Maintenance Effort -4 6 0 0 0 0 Operate w/ Parital Constellation 0 . 0 0 Allow Capacity Upgrade -> --- --Common Design Less than 6 Years # o4 0 0 > > Fast Deployment 8 0 Provide Unique Service 0 0 0 0 Low Signal Attnuation CONSTRAINTS Operate within Allocated Spectrum Comply w/ PFD Regulation No Interference w/ Other Systems Launch Vehicle Constraint Disposal/Deorbit 0 0Figure 3.2 is the QFD design matrix, which relates the technical requirements to the system parameters. The matrix in the center is the relationship matrix filled with symbols that indicate the strength of the relationship. To the left of the relationship matrix, technical requirements are listed with the weighting found in the QFD requirements matrix. Above the relationship matrix, system parameters are listed. Below the relationship matrix, the priorities of the system parameters are listed.
From the QFD analysis, orbital parameters were found to be the most important. The next important group of parameters is related to the communication subsystems. This is consistent with the intuitive expectation.
These observations were used in choosing which parameters are incorporated in the simulation, and whether they go into the design vector or the constants vector. The design vector contains the design variables unique to the system, and the constants vector contains the parameters that are kept the same across the different systems.
0 00 na r C) -0 D (0 W 2 (a>2. CD co (n C 3 0in ( M 0 50 0 CD ( 0 0 :::t 3 (D 0 0 0CD 0 00D CD( 0m 0C C a0DD CD 'a . 0 CD D LS 00 (D 3 CD C~-~C
-~.-~
~3~
01C) 1010 Ci )01~~(DCD0 0 0 0 i 9 9 9 0 o>10 0 Oe Ole 00 00 1 Altitude o o 0 0 000 0 0 > 0 @@@ # of Satellites 0o -0 O 4 0 00 > 0 0 ip 00 # of Satellite per Orbital Plane 00 0 > > 0 0@@@ # of Orbital Planes C O0 01O01 0 0 000 0 Orbit Eccentricity > 0 0 00- I> -010 Inclination con00-- -0 0 011 0 000 Minimum Elevation Angle 0 > 0> > _ Satellite Antenna FOV ca ---> > 0 Satellite Power O 0 -0 > 0 0 @ 00 O # of Ground Stations P 0 IO 0- 0 -0101> Spot Beam Configuration O 0-- O -oo 00 00 Crosslink Capability 0 O O 0 1 > O O O # of Antennas O 1 --> > I> > Frquency ReuseC>C>0
t>
> > SAT Uplink Antenna Gain > -> .0> >1> * SAT Downlink Antenna Gain o > -> -> > @ UT Uplink Antenna Gain > > > 0 UT Downlink Antenna Gain 0 > > > @ UT Power co > 0 0 0 0 Data Access Path > 0 0 Radiation Hardening > 0 0 Debris Protection 0 0 0 0 Satellite Mass 0 O 01 0 00 Right Ascension of Ascending Node 4L 0 00 0 Argument of Perigee O0 00 Time of Perigee Passage 0 * e 0 0 ADACS Scheme 0 0 0 Propulsion Mehtod 0 0 > Degree of New Technology 0 0 0 0 0 UT Tracking Capability 0 0 UT Antenna FOV O O 0 Operation Cycle O -> -> ->1> 0 Allocated Spectrum > > 0 0 >1 Thermal Control 0 1- --> -- -Launch Vehicle _- > #of Spare Satellite on Orbit _ _ 0 OEnergy per Bit 00 0 SAT ponting Accuracy o 0 O O Modulation & Coding o 0 0 UT Pointing Accuracy -1>1 I _--SAT Cross-sectional Area3.2.4 Technical Requirements
From the QFD analysis described in the previous subsection, four technical requirements were identified as the direct transformations of the customer needs: temporal coverage, geographical coverage, data rate, bit error rate.
The required availability was set at 98 %. This probability is based on the stated values in the FCC filings. Geographical coverage may not necessarily be global. For example, a system may only cover parts of the Earth. The system could still be successful if it has enough subscribers to be profitable. Thus, the geographical coverage of the system must be matched with the distribution of potential customers on the Earth. Since the simulation takes into account the geographical distribution of the market, global coverage was not required. It was assumed that TI data rate (1.54 Mbps) is necessary. There is not a crisp definition of broadband connection. Different groups use the term broadband with different definitions. The FCC reports refer to the connection with data rate higher than 200 kbps in both directions as advanced telecommunications technology, while they also use the term "high-speed" to refer to connection faster than 200 kbps at least in one direction [FCC, 1999a; FCC, 2000; FCC, 2002a]. The Ti data rate was chosen for compatibility with the Kelic's study [Kelic, 1998]. It was assumed that a bit error rate (BER) of 10- would characterize the required integrity for business and residential users. More critical applications such as the military require a BER of 10~9, while more forgiving applications such as voice communication require a BER of 10-. As such, a BER of 10- was chosen as the requirement for a data communication network for residential and business users.
3.2.5 Performance Metric
The simulation must output one or more numbers that reflect the technical and economic performance of the satellite network system. Based on the GINA methodology, a cost per function (CPF) type metric was most appropriate [Shaw, 1999]. This analysis used the cost per minute of fully utilized TI network connection achieving an internal rate of return of 30 % and satisfying the requirements defined above. This is a metric that it is neutral to system architecture and captures needs of customers, investors, and the service provider. This cost does not include the initial cost of the user terminal.
Other outputs include the number of subscriber-years over the operation period, total data throughput, mean number of satellites in view from users, etc.
3.2.6 System Model
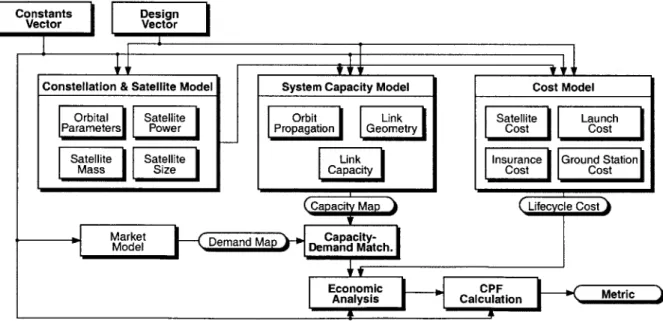
Based on the above steps, the behavior of the satellite network system was modeled by a set of mathematical relationships. Several major models constitute the system simulation. The constellation & satellite model estimates various properties of the satellites. The system capacity model simulates the motion of the satellites over the Earth and estimates how many users can be supported. The cost model estimates the system's lifecycle cost. The market model represents the potential customers on the Earth who wish to subscribe to the satellite network system. These modules are further broken down into smaller components. The output of the integrated models is the performance metric of the system. Figure 3.3 shows the block diagram representation of the models.
Constants Design
Constellation & Satellite Model System Capacity Model Cost Model
Orbital Satellite Orbit Link Satellite Launch
Parameters Power Propagation Geometry
Satellite Satellite Insurance Ground Station
(CapacitMa ( Lifecycle Cost),
Market Demand Mea atch.
Analyss Calculation Mti
Figure 3.3: Decomposition of Computerized Analysis System Into Modules.
3.3 Implementation of Methodology
The system model and simulation were implemented in the Matlab environment. The orbit propagation data was pre-calculated using the Satellite Tool Kit. Appendix A shows the N2
diagram, which shows the inputs and outputs to the modules. The table following the N2 diagram lists the internal parameters.
4 System Model
This chapter explains the developed models. Each section describes the decomposed model shown in Figure 3.3: 1) constellation and satellite models, 2) system capacity model, 3) cost model, 4) capacity/demand matching, 5) market model, and 6) metric calculation.
4.1 System Model Overview
4.1.1 Design Vector
The design vector contains the design variables that characterize a broadband satellite system and differentiate it from others. The number of the design vector elements was kept low so that the results of the comparisons are traceable to design features. The low number of design vector elements also reduces the size of the design space when the developed tool is used for optimization.
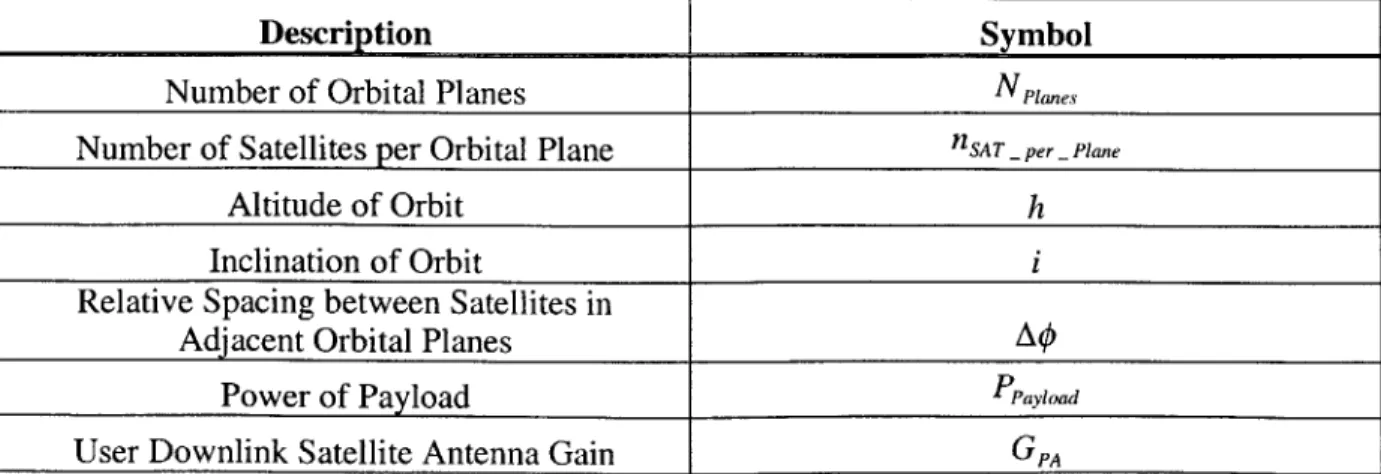
As discussed in "Find Key Parameters" section, the Quality Function Deployment (QFD) analysis was used to identify the system design variables that are most relevant to the user needs. The design vector holds the constellation parameters sufficient to derive the orbital parameters of all satellites or the list of the orbital parameters for all satellites. The design vector also contains the payload power and the gain of user downlink satellites antenna. The Table 4.1 lists the elements of the design vector for the case in which constellation parameters are specified. Appendix B lists the numerical values of the design vectors of the studies systems.
Table 4.1: Elements of The Design Vector And Their Symbols.
Description
Symbol
Number
of Orbital
Planes NPanesNumber of Satellites per Orbital Plane nSAT -per _ Plane
Altitude of Orbit h
Inclination of Orbit
Relative Spacing between Satellites in
Adjacent Orbital Planes A0
4.1.2 Constants Vector
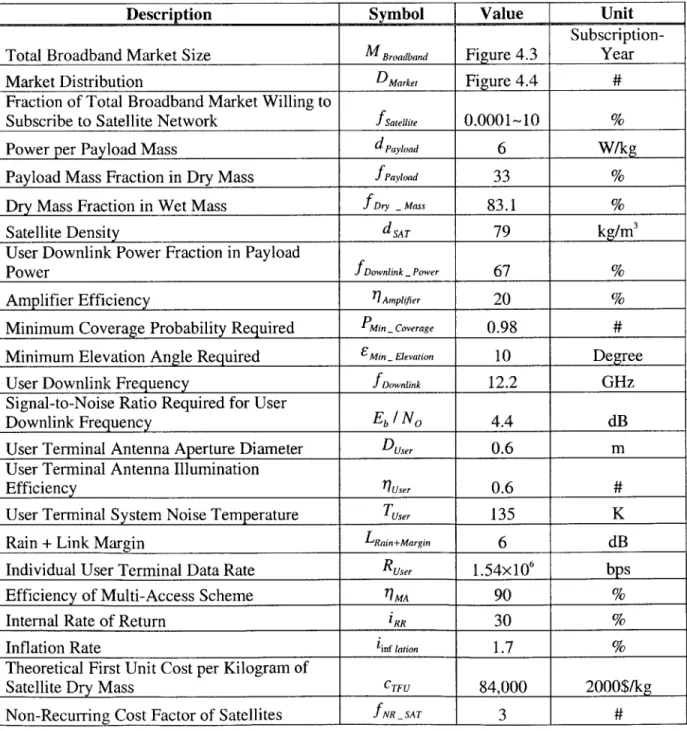
The parameters not included in the design vector are kept constant across different systems in order to make a meaningful comparison. These parameters constitute the constants vector. The table below lists the elements of the constants vector with the symbol, value, and unit.
Table 4.2: Elements of the Constant Vector with Their Symbols, Values, and Units.
Description
Symbol
Value
Unit
Subscription-Total Broadband Market Size MBroadband Figure 4.3 Year
Market Distribution DMarket Figure 4.4 #
Fraction of Total Broadband Market Willing to
Subscribe to Satellite Network fsatenite 0.0001~10 %
Power per Payload Mass dPayload 6 W/kg
Payload Mass Fraction in Dry Mass fpayload 33 %
Dry Mass Fraction in Wet Mass fDry _Mass 83.1 %
Satellite Density dSAT 79 kg/m3
User Downlink Power Fraction in Payload
Power Downlink _ Power 67%
Amplifier Efficiency
7lAmpifier20
%
Minimum Coverage Probability Required PMin_ Coverage 0.98 #
Minimum Elevation Angle Required EMin_ Elevation 10 Degree
User Downlink Frequency fDownlink 12.2 GHz
Signal-to-Noise Ratio Required for User
Downlink Frequency Eb / No 4.4 dB
User Terminal Antenna Aperture Diameter DUser 0.6 m
User Terminal Antenna Illumination
Efficiency
1?User0.6
#
User Terminal System Noise Temperature Tuser 135 K
Rain + Link Margin LRain+Margin 6 dB
Individual User Terminal Data Rate RUser 1.54x 10⁶ bps
Efficiency of Multi-Access Scheme 1iMA 90 %
Internal Rate of Return iRR 30
Inflation Rate inf lation 1.7 %
Theoretical First Unit Cost per Kilogram of
Satellite Dry Mass CTFU 84,000 2000
Description
Symbol
Value
Unit
Insurance Rate finsurance 20 %
Number of Ground Stations NGS 12
TFU Cost of a Ground Station TFUGS 16000000 2000$/GS
Required Labor per Ground Station 'GS 20 man-year/GS
Cost of Labor Clabor 160000 2000$/man-year
Non-Recurring Cost Factor of Ground Stations fNRGS 3
Number of Spare Satellites per Orbital Plane nSpare per _rlane 1 #
Launch Vehicle Margin mLV 10 %
Height of Launch Vehicle Fairing hLV fairing Table 4.4 m
Diameter of Launch Vehicle Fairing DLV _ fairing Table 4.4 m
Cost of Launch Vehicle CL:v Table 4.4 2000$/LV
Launch Vehicle Performance MLV Table 4.4 kg
Launch Site Latitude LLV Table 4.4 degree
Degradation in Launch Vehicle Performance
per Degree of Inclination Increase dincuination 40 kg/degree
4.2 Constellation and Satellite Model
The constellation and the satellites in it were modeled with a set of mathematical relationships that link the design vector and the constant vector to various parameters. Many of the relations are empirical. They are adopted from the previous works and from Space Mission Analysis and Design, 3rd Edition by Larson and Wertz [Violet, 1995; Gumbert, 1996, Larson et al., 1999].
4.2.1 Orbital Parameters
When the constellation parameters were specified instead of listing the orbital parameters for all satellites (Boeing, HughesNET, and SkyBridge), the orbital parameters were derived in the following way. The number of orbital planes NPne, and the number of satellites per orbital
plane nSArper _lane determine the number of satellites in a constellation.
The semi-major axis aSAT is simply the sum of the radius of the Earth (REarth = 6378137 m) and
the altitude of the orbit h .
aSAT = REarth + h (Equation 4.2)
When the complete list of satellites' Right Ascension of Ascending Node (RAAN) was not available in FCC flings, it was calculated based on the number of orbital planes. Because of the symmetry of the constellation, RAAN ASAT of the n-th orbital plane can be calculated by spreading the orbital planes evenly around the Earth.
QSAT= (n -1)21
NPlanes
(Equation 4.3)
Similarly when not explicitly available in the FCC filing, true anomaly was estimated as follows. The true anomaly VSAT of the m-th satellite in the n-th orbital plane was calculated as,
(Equation 4.4)
SAT - ) 2)c +(n -1) -A,
nSAT _ per _ Plane
where A$ is the relative phasing between satellites in adjacent orbital planes.
4.2.2 Spare Satellites
It was assumed that one spare satellite is needed for each orbital plane (nSpare per _Plane = 1). In the case of the Virgo's elliptic constellation, it was assumed that one spare satellite per each sub-constellation is needed. Thus, the number of spare satellites NSpare is
4.2.3 Mass
The masses of various components were estimated from the payload power using empirical
parametric relationships. First, the payload mass was estimated assuming the energy density
dPayload
of 6 watts per kilogram of payload mass [Violet, 1995; Gumbert, 1996].
(Equation 4.6)
MPayload - Payload
dPayload
Second, the dry mass of the satellite was estimated assuming that the payload mass is 33 % of
the spacecraft dry mass
( fPaylod =0.33) [Violet,
1995;Gumbert, 1996].
M
Dry - PayloadfPayload
(Equation 4.7)
Finally, the wet mass was estimated using the historical average of propellant mass fraction
fDry _ Mass
of 83.1 % [Larson et al., 1999].
(Equation 4.8)
MVWet - Dry
fDry Mass
4.2.4 Dimension
The dimensions of the satellite must be estimated to verify fit in the launch vehicle fairings. The
satellite bus volume
VSATwas first estimated from the wet mass Mwet assuming the density
dSATof 79 kg/m
3for the overall satellite. This density is a historical average for communication
satellites [Larson et al., 1999].
YS Wet
VST dSAT
(Equation 4.9)
The diameter of the satellite bus
DSATwas estimated from the satellite wet mass
Mwetusing
another parametric relationship [Larson et al., 1999].
DsA7 =0.25
-
M we(
Finally, the height of the satellite bus 1sa was calculated simply by dividing the volume by the
base area. (Equation 4.11) 1 SAT VSAT K(DsAT
4.2.5 Power
Since there are multiple spot beams that are power-controlled, it is difficult to model the power consumptions for user downlink, user uplink, gateway downlink, and gateway uplink. Although complete description of the power consumption and management was not always present in the FCC applications, it was assumed that 2/3 of the payload power P,yoad is available for the user
downlink
( fDo,,,,i,,k Power =0.67 ). The user downlink power
PUser Dwonlink is,(Equation 4.12)
PUser_ Downlink U ser -Downlink -Power PayloadThe above power is input to the amplifier. Assuming an amplifier efficiency 7Apli,ier of 20 % the radio frequency power radiated is,
PUser _Downlink _RF ~ flArplier User Downlink (Equation 4.13)
Combining the radio frequency power PUserDownlink _RF and the phased array antenna gain GPA,
the Effective Isotropic Radiated Power (EIRP) for user downlink PUser _Downlink _EIRP 1s
![Table 4.4: Characteristics of the Considered Launch Vehicles [Isakowitz, 1999].](https://thumb-eu.123doks.com/thumbv2/123doknet/14731593.573105/49.918.108.814.674.838/table-characteristics-considered-launch-vehicles-isakowitz.webp)