HAL Id: insu-01174854
https://hal-insu.archives-ouvertes.fr/insu-01174854
Submitted on 21 Jul 2015HAL is a multi-disciplinary open access archive for the deposit and dissemination of sci-entific research documents, whether they are pub-lished or not. The documents may come from teaching and research institutions in France or abroad, or from public or private research centers.
L’archive ouverte pluridisciplinaire HAL, est destinée au dépôt et à la diffusion de documents scientifiques de niveau recherche, publiés ou non, émanant des établissements d’enseignement et de recherche français ou étrangers, des laboratoires publics ou privés.
Time domain structures: What and where they are,
what they do, and how they are made
F.S. Mozer, O. V. Agapitov, A Artemyev, J.F. Drake, V Krasnoselskikh, S
Lejosne, I Vasko
To cite this version:
F.S. Mozer, O. V. Agapitov, A Artemyev, J.F. Drake, V Krasnoselskikh, et al.. Time domain struc-tures: What and where they are, what they do, and how they are made. Geophysical Research Letters, American Geophysical Union, 2015, 42, pp.3627-3638. �10.1002/2015GL063946�. �insu-01174854�
Time Domain Structures: what and where they are, what they do, and how they are made F.S. Mozer1, O.V. Agapitov1,2, A. Artemyev3, J.F. Drake4, V. Krasnoselskikh5, S. Lejosne1,
and I. Vasko
3
1. Space Sciences Laboratory, University of California, Berkeley, California 94720, USA 2. National Taras Shevchenko University of Kiev, Kiev, Ukraine
3. Space Research Institute, Russian Academy of Science, Moscow, Russia 117917 4. University of Maryland, College Park, MD 20742, USA
5. LPC2E/CNRS-University of Orleans, Orleans, France.
This article has been accepted for publication and undergone full peer review but has not been through the copyediting, typesetting, pagination and proofreading process which may lead to differences between this version and the Version of Record. Please cite this article
Time Domain Structures (TDS) (electrostatic or electromagnetic electron
holes, solitary waves, double layers, etc.) are ≥1 msec pulses having significant parallel (to the background magnetic field) electric fields. They
are abundant through space and occur in packets of hundreds in the outer
Van Allen radiation belts where they produce magnetic-field-aligned
electron pitch angle distributions at energies up to a hundred keV. TDS can
provide the seed electrons that are later accelerated to relativistic energies
by whistlers and they also produce field-aligned electrons that may be
responsible for some types of auroras. These field-aligned electron
distributions result from at least three processes. The first process is
parallel acceleration by Landau trapping in the TDS parallel electric field.
The second process is Fermi acceleration due to reflection of electrons by
the TDS. The third process is an effective and rapid pitch angle scattering
resulting from electron interactions with the perpendicular and parallel
electric and magnetic fields of many TDS. TDS are created by
current-driven and beam-related instabilities and by whistler-related processes such
as parametric decay of whistlers and non-linear evolution from oblique
whistlers. New results on the temporal relationship of TDS and particle
injections, types of field-aligned electron pitch angle distributions produced
by TDS, the mechanisms for generation of field-aligned distributions by
TDS, the maximum energies of field-aligned electrons created by TDS in
the absence of whistler mode waves, TDS generation by oblique whistlers
and three-wave-parametric decay, and the correlation between TDS and
1. INTRODUCTION
The name “Time domain structures” (TDS) was initially given to packets of ≥1 msec duration intense electric field spikes detected by the Van Allen Probes in the Earth’s outer
radiation belts. These electric field spikes had significant components parallel to the local
magnetic field and each packet contained as many as hundreds of such spikes [Mozer et al,
2013]. The velocity of propagation of these TDS along magnetic field lines was found to be
close to the thermal speed of 100-200 eV electrons and they were identified as electron
acoustic-like perturbations of the plasma density and electric field. Van Allen Probe
observations have shown that at least five different types of intense electric field spikes exist
and they were united by the common title “TDS.” These types include electrostatic and
electromagnetic double layers, electrostatic and electromagnetic electron holes, and
non-linear whistlers, all of which were known and studied earlier. Because these TDS are
abundant in the observations, it has been suggested that they are an important factor in the
macroscopic dynamics of the radiation belts, providing the mechanism of acceleration of low
energy electrons up to keV energies after which they are further acceleration by whistler
waves to relativistic energies in the radiation belts [Mozer et al, 2014]. They may also be
responsible for producing field-aligned electron fluxes that make auroras.
2. TYPES OF TDS
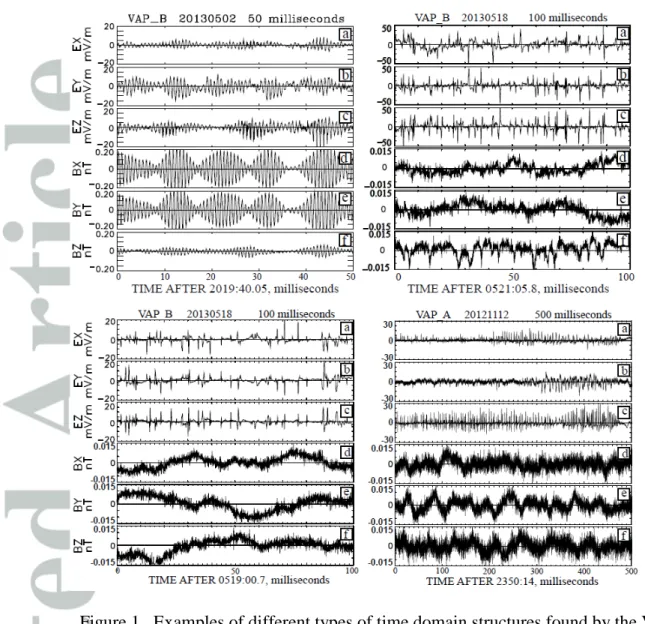
Figure 1 illustrates examples of different types of TDS found on the Van Allen Probes
in the Earth’s outer radiation belt by the EFW [Wygant et al, 2013] and EMFISIS [Kletzing
et al, 2013] instruments. In each of the four sections of this figure, the top three panels give
the electric field perturbations in magnetic-field-aligned coordinates and the bottom three
panels give the magnetic field perturbations in the same frame, with the parallel components
located in panels (c) and (f) of each section. Observationally, it is not clear which, if any, of
in only one of the four examples (in the upper left section), which is typical of the overall
data observed in the Van Allen radiation belts. Instead, in each of the three other sections,
there is low frequency (a few tens of Hz) noise in the magnetic field, which may result from
Doppler shifted kinetic Alfven waves [Chaston et al, 2014]. This low frequency magnetic
noise is typical of TDS observations in the radiation belts. It is also noted that the TDS in
this figure are three dimensional objects because they produce spiky signatures in the
perpendicular as well as the parallel electric field.
3. TDS APPEARANCE FOLLOWING PLASMA INJECTIONS
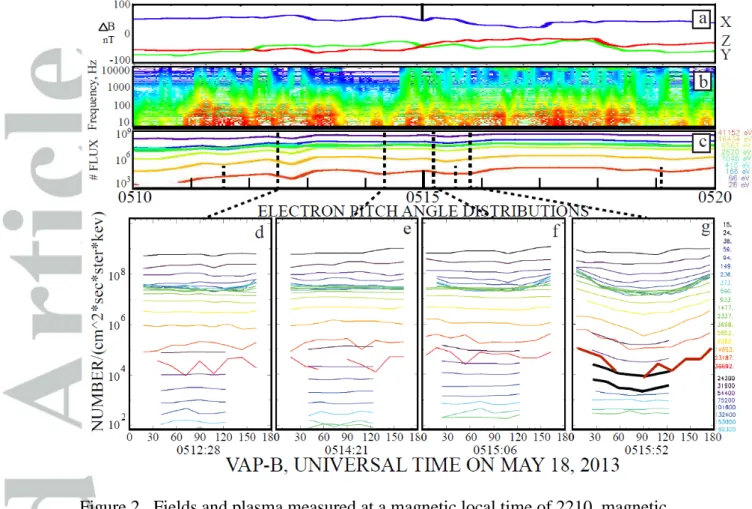
Figure 2 presents an example of a plasma injection into the outer radiation belt followed, a
few minutes later, by electromagnetic energy injection, TDS, and electrons that were
field-aligned to energies of 100 keV. In this and all examples discussed in this paper, events were
selected on the basis of the presence of TDS in the absence of whistlers, in order to study the
effects caused by TDS alone. Panel 2a presents the three components of ΔB=(Bmeasured–
Bmodel) in GSE coordinates during the 10 minute interval covered in the figure, where Bmodel
is obtained from a Tsyganenko model [1995]. Panel 2b gives the electric field frequency
spectrum and Panel 2c gives nine HOPE detector electron number fluxes from 26 eV to 41
keV [Spence et al, 2013]. Panels 2d through 2g provide pitch angle distributions of the
HOPE and magEIS detected electrons at the four times illustrated by the long, vertical,
dashed lines in panel 2c. These data were collected at a 20 second cadence. Shortly after
0510 UT, the electron fluxes in panel 2c increased at all energies due to the injection of
electrons from further down the tail. At this time, the low frequency electric field amplitude
of panel 2b increased due to electromagnetic noise that was also observed in the magnetic
field (not shown) and in a burst of high time resolution electric and magnetic field waveforms
electron pitch angle distribution of panel 2d, obtained during the flux increase, at the position
of the first long vertical dashed line in panel 2c, showed that electrons of all energies were
approximately isotropic during the injection. After the injection was complete, at 0514:21,
the pitch angle distribution of panel 2e remained isotropic and the electrons were apparently
not influenced by the low frequency noise. Forty seconds later, ΔBZ, (the red curve in panel
2a) indicated a current associated with dipolarization of the magnetic field. Along with this
current, the pitch angle distribution of panel 2f began to show field-aligned distributions of
0.1-1 keV electrons (the green curves) at the same time that TDS, intermixed with the low
frequency noise, first appeared (not shown). During the next 45 seconds, the TDS intensity
increased and the pitch angle distributions became magnetic-field-aligned at all energies from
0.1 to 100 keV in panel 2g. At energies of 20-50 keV, the HOPE and MagEIS data overlap
with the HOPE data covering a wider pitch angle range and magEIS providing better
counting statistics. The thick red curve in panel 2g gives the HOPE pitch angle distribution
at 37 keV and the two thick black curves give the MagEIS distributions at 55 and 75 keV.
Thus, both the HOPE and the MagEIS data are required to make the case that the electrons
were field-aligned to energies as high as 100 keV. It is noted that the field-aligned electron
flux exceeded the 90degree flux by an order-of-magnitude at most energies. Examples of the
TDS observed shortly after this interval are given in the lower left (electrostatic electron
holes with amplitudes ~15 mV/m) and upper right sections of Figure 1 (electromagnetic
electron holes with amplitudes ~50 mV/m).
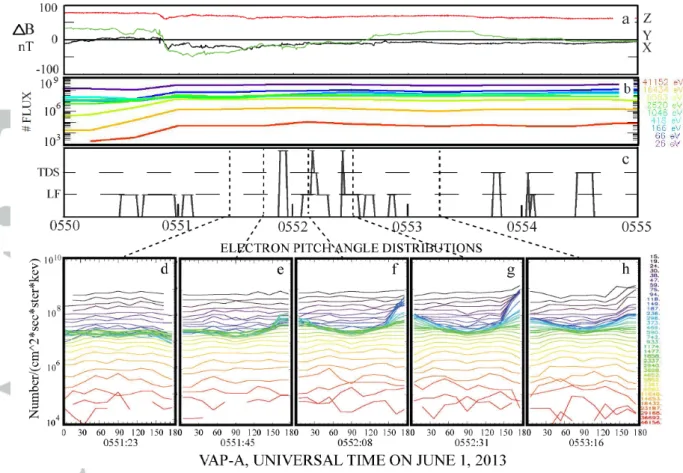
A second example of the same temporal behavior of plasma injection followed a few
minutes later by TDS and pitch angle deformation is given in Figure 3. Panel 3a gives ΔB during a five minute interval and panel 3b gives nine HOPE electron fluxes from 26 eV to 41
during this time, a summary of the bursts rather than the spectrum of the electric field signal
is given in Figure 3c. At times when the curve of panel 3c is at the lower level (labeled LF),
low frequency noise was detected in the time domain bursts of wave data. (While the low
frequency noise is not relevant to the present paper, its presence is included for
completeness.) When the curve is at the middle level (labeled TDS), TDS alone were
observed and when the curve is at the top of the panel, both TDS and low frequency noise
were observed. These TDS were three-dimensional electromagnetic holes, similar to the
example in the upper right section of Figure 1. This is determined by the presence of the
perpendicular electric field components in the TDS that were comparable with the parallel
components and the presence of parallel magnetic fields that in these TDS were significant.
The electric field amplitudes varied between about 15 and 40 mV/m. Between 0550 and
0551 UT, injected electrons appeared at the spacecraft with low frequency noise and no TDS.
At 0551:23 (the time of the first vertical dashed line in panel 3c), panel 3d shows that the
pitch angle distributions resulting from the injection were peaked at 90 degrees. By 0551:45
(the second vertical dashed line in panel 3c), 20 seconds later, the pitch angle distribution of
0.1-1 keV electrons started to have a peak at a pitch angle of 180 degrees, as seen in panel 3e.
Just before 0552 and throughout the remaining interval, TDS, sometimes with low frequency
noise, were observed, while the pitch angle distributions of panels 2f, and 2g, showed an
increasing anisotropy with the flux at 180 degrees of 100 eV to 1 keV electrons exceeding
that at smaller angles by an order-of-magnitude. This flux constituted a beam in the given
energy range. Thus, in this example also, the plasma injection preceded the TDS and
field-aligned electron distribution by about one minute.
4. TDS THEORIES AND OBSERVATIONS
As a plasma physics process, electron hole TDS were first studied in numerical models of
1969b]. Their generation was first observed in the lab in a Q-machine by Saeki et.al [1979].
Generation by spontaneous reconnection in a toroidal device was studied [Fox et.al, 2008],
and laboratory observations of electron holes in a plasma device have been presented
[Lefebvre et.al, 2011].
Double layer type TDS were first discussed in connection with magnetospheric physics
and astrophysics by the Stockholm group under Hannes Alfven [Alfven and Carlquist, 1978,
and references therein; Raadu, 1989]. TDS were first observed in the magnetosphere along
auroral zone magnetic field lines on the S3-3 satellite [Mozer et al, 1977; Temerin et al,
1982] and they were more thoroughly studied on the FAST mission [Ergun et al, 1998;
2001]. They have been seen in the tail [Matsumoto et al, 1994; Franz, 1998; Streed et al,
2001], the plasma sheet [Ergun et al, 2009; Deng et al, 2010], the plasma sheet boundary
layer [Lakhina et al, 2011], at shocks [Bale et al, 1998; Cattell et al, 2003], at magnetic field
reconnection sites [Cattell et al, 2002; Mozer et al, 2009a; Mozer et al, 2009b; Khotyaintsev
et al, 2010: Li et al, 2014], in the solar wind [Bale et al, 1996; Malaspina et al, 2013;
Williams et al, 2005], and at Saturn [Williams et al, 2006]. However, the huge numbers of
TDS in a single event [Mozer et al, 2013] and the large occurrence frequency of such events
[Malaspina et al, 2014] were very new and unusual statistical properties of TDS. In the
radiation belts they are often the major and dominant element of the wave activity. This
raised an important question on their role in processes of particle acceleration and losses.
Indeed, it was shown that they play an important role providing seed electrons that are further
accelerated by whistler waves to relativistic energies in the outer radiation belts. This was
described and unambiguously evidenced by [Mozer et al, 2014]. They also are a possible
5. TDS AND AURORAL PARTICLE PRECIPITATION
Because, as shown, TDS produce field-aligned electrons that can be lost in several
bounces, it is interesting to correlate such events with auroral emissions measured in the
Canadian and Alaskan all-sky camera network [Donovan et al, 2006; Mende et al, 2008] in
order to understand the role of TDS in producing auroras. The ratio between the HOPE
electron flux near the loss cone (the average of the 18, 36, 144 and 162degree fluxes) and the
90 degree flux was computed (as shown for one case in Figure 4b) to identify time intervals
of field-aligned electron distributions and possible precipitation. Of 81 events during which a
Van Allen Probe was in conjunction with an all-sky imager recording auroral activity, five
cases presented concurrent variations of wave activity, pitch angle ratios greater than one and
variations of the light intensity around the conjugate footprint. TDS were present in all five
cases and no other wave modes were present at times of auroral precipitation in any of the
five events. The event on April 26, 2013, when Van Allen Probe A was in magnetic
conjunction with the all-sky imager at Le Pas, Canada, is presented in Figure 4. Because the
mapping of the spacecraft footprint is not precise, primarily in the latitudinal direction, the
white light intensity averaged over a +/- one degree latitude window around the footprint
location was computed, as shown in Figure 4a. Because of moonlight, the background light
intensity measured by the all-sky imager was not spatially uniform. To correct for this, the
one-hour-averaged light background was subtracted from each individual measurement.
Clouds were present around the spacecraft footprint at the two time intervals, from 06:15 to
06:30, and from 06:58 to 07:03; these time intervals are reported in blue along the abscissa of
panel 4a. Panel 4b gives the ratios of the field-aligned to 90degree electron flux for 5 energy
ranges centered at 300eV, 1keV, 3keV, 10keV and 30 keV. A ratio of one indicates an
isotropic pitch angle distribution while a ratio greater than one indicates a predominately
spectra at about 75 Hz, which is the BEN indicator of the presence of TDS, and panel 4d
gives the amplitude of the electric field spectra in the chorus frequency range. The presence
of TDS was confirmed in the high time resolution waveform data bursts that occurred several
times during the interval of interest. The TDS occurrence rate (panel 4c) increased as the
ratio between field-aligned and equatorial particles increased for all five energy ranges (panel
4b) while auroral emission appeared (panel 4a). Thus, this example suggests that TDS
produced the field-aligned pitch angle distributions that filled the loss cone with electrons of
energy such that auroral light was emitted. It is noted that the electric field wave power due
to TDS exceeded the wave power in the chorus range by a factor greater than 10,000 during
the correlated time intervals, and the one burst of chorus emission (panel 4d at 0630) did not
produce field-aligned electrons or bright auroral light.
6. TDS GENERATION IN A PARTICLE-IN-CELL SIMULATION
TDS generation from whistlers [Karpman et al, 1982; Shapiro et al, 1994; Kellogg et al
2010, Agapitov et al, 2014] and by electric currents or beams [Roberts and Berk, 1967;
Morse and Nielson, 1969a, 1969b; Lashmore-Davies, 1973; Joyce and Hubbard, 1978;
Hubbard and Joyce, 1979; Yamamoto and Kan, 1985; Omura et al, 1996, 2008; Berthomier et
al, 1998; Miyake et al, 1998; Goldman et al, 1999; Newman et al, 2001; Oppenheim et al,
2001; Singh 2003; Wu et al, 2011] have been studied theoretically. Earlier work [Roth et al,
1999], more recent work [Artemyev et al, 2012, 2013, 2014a, 2014c: Osmane et al, [2012a,
2012b] and recent particle-in-cell simulations [Drake et al, 2015] illuminate the relationship
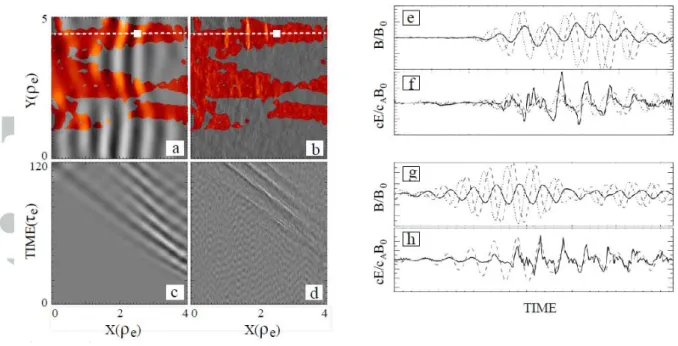
between oblique whistlers and TDS generation. The simulation that is illustrated in Figure 5
[Drake et al, 2015], was initialized by a temperature anisotropy in the center of the simulation
box that is to the right of the data shown. Thus, the waves and TDS move to the left in panels
5a and 5b. The fronts of the perpendicular whistler magnetic field at a fixed time are
panel 4b with the lighter regions indicating the locations of large parallel electric fields in the
TDS. The signals as a function of time (the vertical axis) are given of the perpendicular
magnetic field (panel 5c) and parallel electric field (panel 5d), as measured along the dashed
lines in panels 5a and 5b. From these data it is clear that the TDS parallel electric field spikes
moved at the phase velocity of the whistler. The red regions in panels 5a and 5b cover
locations where the wave normal angle (the angle between its k-vector and the background
magnetic field) was greater than15o
7. TDS GENERATION BY A PARAMETRIC INSTABILITY
; i.e., regions where the wave was oblique. It is seen that
the TDS of panel 5b were made in these red locations where the whistler was oblique.
Field-aligned electron beams, produced as whistlers grew because of the initial electron
temperature anisotropy, amplify the parallel electric field of the oblique whistler to produce
the TDS structures [Drake et al, 2015]. Panel 5e gives the wave perpendicular magnetic
field and 5f gives the parallel electric field from the simulation as functions of time at the
location of the small white boxes in panels 5a and 5b. Panels 5g and 5h provide an example
of the same measured quantities on the Van Allen probes. The striking similarity of the TDS
waveforms in experiment and simulation provide further evidence that one generation
mechanism for TDS in the outer radiation belt is from oblique whistlers. The comparison of
the simulation and measured electric fields is further discussed in Drake et al [2015].
Another TDS generation mechanism observed in space and modeled analytically is TDS
formation from a parametric instability in which a whistler at frequency ωo and k-vector ko
decays into a second whistler at ω1, k1, and an electron acoustic wave at ω2, k2, with ωo=(ω1
+ ω2) and k0=(k1 + k2). It is worth noting that these whistler waves are in the chorus
frequency range, the higher frequency in the upper band, and the lower frequency in the
lower band whistlers. Because the two whistlers travel in opposite directions, the magnitude
very short wavelength and is an electron acoustic signal that quickly evolves into TDS. The
possibility of the decay of a whistler wave into an electron acoustic wave that decays into
TDS has not been considered before because of the supposed, but incorrect, large linear
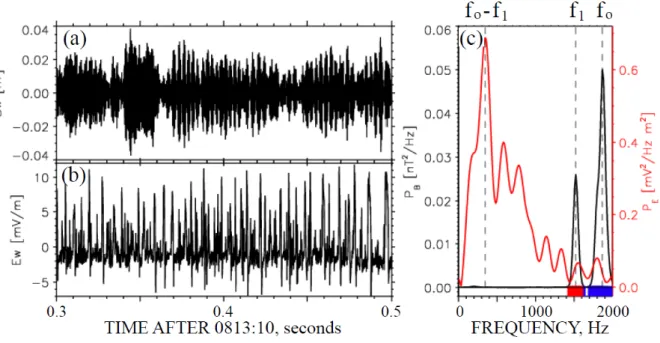
damping rate of the electron acoustic wave. Figure 6 illustrates this parametric instability in
experimental data collected on the Van Allen Probes. Panel 6a presents the perpendicular
magnetic field over a 0.5 second time interval and panel 6b gives the parallel electric field
during the same interval. The low frequency beats of the envelope in panel 6a result from the
presence of two whistlers with slightly different frequencies, and the spikes in 6b signify the
presence of large numbers of TDS. The black curve of figure 6c is the spectrum of the
magnetic field, which was comprised of two nearly monochromatic waves at frequencies
labeled fo and f1. The blue and red bars at the bottom of the figure indicate the direction of
(ExB)/B2, which shows that the two waves traveled in opposite directions, as required for the
parametric instability. The red curve of panel 6c is the spectrum of the parallel electric field
TDS. This spectrum peaked at (fo - f1
8. STATISTICS OF FIELD-ALIGNED ELECTRON DISTRIBUTIONS
) as is required by the instability, but it spread into
harmonics as the electron acoustic wave decayed into the observed TDS. Thus, figure 6
illustrates another way that TDS can be formed from whistlers. (It is noted that most of the
TDS in the 200 examples surveyed in this paper were probably generated by currents or
beams because none of them were observed in the presence of whistlers.)
During the first 11 months of Van Allen Probe operations, 200 events on the night side
having TDS in the absence of chorus frequency range whistlers were studied in order to
determine the effects of TDS alone. (The absence of whistlers was determined by the electric
and magnetic field spectra not having energy in the range of 3200-6500 Hz.) Their typical
durations, as judged by low frequency broad band noise in the electric field spectra in the
maximum field-aligned energy was estimated within an uncertainty of about 50 percent.
These results produced the bar chart of Figure 7, which has an energy resolution of a factor of
three. Field-aligned distributions having maximum energies from a few tens of eV to 100
keV were found, with the average energy being 7.6 keV and the number of events having
field-aligned distributions at energies greater than 30 keV being about 10% of the total. A
most significant result is that all of the selected 200 events having TDS also contained
field-aligned electron distributions at times. This is strong evidence that the parallel electric fields
in the TDS and the field-aligned electron pitch angle distributions are related. (Field-aligned
electrons were observed previously [Abel et al, 2002a, 2002b] and no statistical evidence of a
correlation between such electrons and chorus or ECH waves was found.)
9. DISCUSSION
Figures 2 and 3 illustrate two examples in which plasma injected from further down the
tail to the satellite location had initial pitch angle distributions that were isotropic or peaked
at 90
Because the field-aligned electron distributions of Figures 2 and 3 are very different from
each other and because several different types of TDS exist (Figure 1), it is important to
consider which types of TDS produce which types of accelerated electron pitch angle
distributions and to understand the mechanisms for such production. It has been shown that degrees. Following these injections by a few minutes, TDS and field-aligned electrons
appeared together and, in one of the two cases, at the time of a current system that produced
dipolarization of the magnetic field. Approximately 10 such cases have been studied in detail
and the initial pitch angle distributions of the injected electrons in all cases were isotropic or
peaked at 90 degrees. In all cases, field-aligned-pitch angle distributions and TDS appeared a
few minutes following the injections and, in the majority (but not all) of the cases, these
distributions and TDS occurred at the time of currents, as observed by the changing
field-aligned electron distributions to energies of several keV can be produced by Landau
interaction in a single electrostatic TDS having no net potential [Artemyev et al, 2014b;
Osmane et al, 2014]. A second mechanism involves electron interactions with many
electrostatic TDS, as illustrated in Figure 8, in which panels 8a and 8b present the before and
after pitch angle distributions in a test particle simulation and panels 8c and 8d illustrate
before and after observations in space during an event involving electrostatic TDS of the type
shown in the lower left section of Figure 1 and assumed in the simulation. In both the
simulation and the space data, electrons with energies of 50-500 eV become field-aligned
while both lower and higher energy electrons were relatively unaffected. Particle trajectories
in the simulation show that electrons were accelerated parallel to the magnetic field by
reflection from the TDS when the electron and TDS phase velocities were similar. Electron
scattering by the perpendicular electric field in the TDS was not considered. In the
simulation, TDS were generated near the equator at L=6 in packets of typically 50 individual
TDS having a maximum amplitude of 20 mV/m and a velocity of 4000 km/sec. They
propagated in a dipole magnetic field to a latitude of 40 degrees where they were lost and a
new packet was created at the equator. The initial particle distribution was the sum of three
isotropic Maxwellians with temperatures of 10, 100, and 2000 eV and with the hotter
densities being 0.025 and 0.001 of the cold density. The simulation lasted about one bounce
period of the cold electrons, during which about 8 packets of TDS were generated. About
135,000 particles were included in the simulation. It produced field alignment such that the
flux at 0 or 180 degrees is several orders-of-magnitude larger than the flux at 90 degrees
(Figure 8). In the space data, this flux enhancement is something less than a factor of 10.
Similar pitch angle distributions are seen early in Figure 2f and Figure 3 (except that
reflecting electrons are lost in this case).
In Figure 2 and in the event described in Figure 4, the pitch angle distributions became
field aligned to energies as great as 100 keV (the Figure 4 pitch angle distributions are not
shown). Looking across the four pitch angle distribution panels in Figure 2, it is seen that
electrons below about 100 eV did not become field-aligned and their fluxes were roughly
constant with time. At any higher energy, the omnidirectional flux varied little during the
time interval of interest, as can be seen in panel 2c where the omnidirectional fluxes from
0514 to 0516 UT varied by less than a factor of two. Thus, the parallel electrons at any
energy in figure 2g likely came largely from the deficit of 90
The TDS that produced the 100 keV field-aligned distribution in Figure 2 were the
electromagnetic TDS illustrated in the upper right section of Figure 1. The same type of TDS
was associated with the field-aligned distributions that produced the aurora of Figure 4.
Thus, it seems likely that the electromagnetic nature of the TDS (spikes in the parallel
magnetic field component) is important in making energetic field-aligned distributions
because such spikes are associated with an induced electric field that is not included in
simpler discussions.
degree electrons. The parallel
electric field in TDS cannot produce this result because the first invariant of the electron
motion is conserved in the presence of only a parallel field. However, the perpendicular
electric field in three-dimensional TDS, such as those in Figure 1, can cause the first invariant
to become non-conserved if the electron crosses the TDS in a time that is short or comparable
to its gyro-period. In this case the electron energy can be redistributed between the
perpendicular and parallel components and original 90 degree electrons might become
field-aligned. Preliminary estimates and simulations suggest that a process like this may be
happening.
electron bounce periods while an order-of-magnitude fewer electrons returned at pitch angles
of 0-30 degrees. Thus, the large pitch angle electrons must have been lost in one or a few
bounce periods. This requires continuous acceleration of 150-180 degree electrons. This
electron beam was moving tailward in a tail-like magnetic field that was within the GSE-XY
plane to less than 5 degrees.
The data set of two hundred events was produced by selecting time intervals during which
TDS were present in the absence of any other wave activity (other than low frequency noise).
Field-aligned electron pitch angle distributions were present, at least part of the time, in every
event in this data set. An alternative approach is to form a data set from events having
field-aligned distributions and to inquire about TDS and other waves that are present at such times.
In this data set, TDS were present in a clear majority of the cases and at least half of these
cases had only TDS. These statistics suggest that TDS are often responsible for producing
the field-aligned, accelerated electrons that are the seed population for relativistic
acceleration and for precipitation that makes auroras. Thus, inclusion of TDS in radiation
belt and auroral dynamics and theories seems to be required.
ACKNOWLEDGEMENTS
The data used in this paper is available at the Van Allen Probe web site,
http://rbspgway.jhuapl.edu/. The authors thank the scientists and engineers associated with
the EFW, EMFISIS, magEIS, and HOPE instruments for providing the high quality data
reported in this paper. The work by O.A., S.L. and F.M. was performed under JHU/APL
Contract No. 922613 (RBSP-EFW). The work of V.K. was partially supported by
1781.2014.2. The work of I.V. and A.A. was supported by Presidental grant
REFERENCES
Abel, G. A., A. N. Fazakerley, and A. D. Johnstone (2002a, Statistical distributions of field-aligned electron events in the near-equatorial magnetosphere observed by the Low Energy Plasma Analyzer on CREES, J. Geophys. Res., 107(A11), 1393, doi:
10.1029/2001JA005073.
Abel, G. A., A. N. Fazakerley, and A. D. Johnstone (2002b), Simultaneous acceleration and pitch angle scattering of field-aligned electrons observed by the LEPA on CREES, J.
Geophys. Res., 107(A12), 1416, doi: 10.1029/2001JA005090.
Agapitov, O.V., A. Artemyev, D. Mourenas, V. Krasnoselskikh, J. Bonnell, O. Le Contel, C. M. Cully, and V. Angelopoulos (2014), The quasi-electrostatic mode of chorus waves and electron nonlinear acceleration, J. Geophys. Res., 119, 16061626,
DOI:10.1002/2013JA019223.
Alfven H., and P. Carlqvist (1978), Interstellar clouds and the formation of start, Astrophysics
and Space Science, 55, 2, 487–509.
Andersson L, R.E. Ergun, J. Tao, A. Roux, O. LeContel, V. Angelopoulos, J. Bonnell, J.P. McFadden, D.E. Larson, S. Eriksson, T. Johansson, C.M. Cully, D.L. Newman, M.V. Goldman, K.-H. Glassmeier, and W. Baumjohann (2009), New features of electron phase space holes observed by the THEMIS mission, Phys. Rev. Lett., 102, 225004
Artemyev, A.V., V.V. Krasnoselskikh, O.V. Agapitov, D. Mourenas, and G. Rolland, (2012), Non-diffusive resonant acceleration of electrons in the radiation belts, Phys.
of Plasmas,19,doi.org/10.1063/1.4769726
Artemyev A.V., A.A. Vasiliev, D. Mourenas, O.V. Agapitov, and V.V. Krasnoselskikh, (2013), Nonlinear electron acceleration by oblique whistler waves: Landau resonance vs. cyclotron resonance, Phys. of Plasmas, 21, doi:10.1063/1.4836595
Artemyev, A.V., (2014a) Fast transport of resonant electrons in phase space due to nonlinear trapping by whistler waves, Geophys. Res. Lett., 41, doi:10.1002/2014GL061380
Artemyev A., O.V. Agapitov, F.S. Mozer and V. Krasnoselskikh (2014b) Thermal electron acceleration by localized bursts of electric field in the radiation belts, Geoph. Res. Lett., DOI: 10.1002/2014GL061248
Artemyev, A.V., A.A. Vasiliev, D. Mourenas, O.V. Agapitov, and V.V. Krasnoselskikh, (2014c), Electron scattering and non-linear trapping by oblique whistler waves: the critical wave intensity for non-linear effects, Phys of Plasmas, 21, doi:10.1063/1.4897945
Bale, S. D., D. Burgess, P. J. Kellogg, et al. (1996), Phase Coupling In Langmuir Wave Packets: Possible Evidence of Three-Wave Interactions in the Upstream Solar Wind,
Geophys Lett, 11, 109.
Bale, S.D., P.J. Kellogg, D.E. Larsen, R.P. Lin, K. Goetz, and R.P. Lepping (1998), Bipolar electrostatic structures in the shock transition region: Evidence of electron phase space holes,
Berthomier, M., R. Pottelette, and M. Malingre (1998), Solitary waves and weak double layers in a two-electron temperature auroral plasma, J. Geophys. Res., 103.
Cattell, C., J. Crumley, J. Dombeck, J. Wygant, F.S. Mozer (2002), Polar observations of solitary waves at the Earth's magnetopause, Geophys. Res. Lett., 29, 9-1.
Cattell, C., C. Neiman, J. Dombeck, J. Crumley, J. Wygant, C. A. Kletzing, W. K. Peterson, F. S. Mozer, and M. Andre (2003), Large amplitude solitary waves in and near the Earth's magnetosphere, magnetopause and bow shock: Polar and Cluster observations Science, 299, 383-6.
Chaston, C. C., et al. (2014), Observations of kinetic scale field line resonances, Geophys.
Res. Lett., 41, 209–215, DOI:10.1002/2013GL058507.
Deng, X., M. Ashour-Abdalla, M. Zhou, R. Walker, M. El-Alaoui, V. Angelopoulos, R.E. Ergun, and D. Schriver (2010), Wave and particle characteristics of earthward electron injections associated with dipolarization fronts, J. Geophys. Res., 115, A09, 225, DOI:10.1029/2009JA015107.
Donovan, E., S. Mende, B. Jackel, H. Frey, Syrjasuo, I. Voronkov, T. Trondsen, L. Peticolas, V. Angelopoulos, S. Harris, M. Greffen, and M. Connors (2006), The THEMIS All-Sky Imager Array - System design and initial results from the prototype imager, J. Atmos. Solar
Terr. Phys., DOI:10.1016/j.jastp.2005.03.27.
Drake J.F., O.V. Agapitov, and F.S. Mozer (2015), Development of a bursty precipitation front with intense localized parallel electric fields driven by whistler waves in the Earth's outer radiation belt, Geophys. Res. Lett., DOI: 10.1002/2015GL063528.
Ergun, R.E., et al. (1998), FAST satellite observations of large-amplitude solitary structures,
Geophys. Res. Lett., 25, 2041–2044, DOI:10.1029/98GL00636.
Ergun, R. E., Y.-J. Su, L. Andersson, C. W. Carlson, J. P. McFadden, F. S. Mozer, D. L. Newman, M. V. Goldman, and R. J. Strangeway, (2001), Direct observation of localized parallel electric fields in a space plasma, Phys. Rev. Lett., 87 (4), 045003, DOI:10.1103/PhysRevLett.87.045003.
Ergun, R. E., et al. (2009), Observations of double layers in Earth’s plasma sheet, Phys. Rev.
Lett., 102 (15), 155002, DOI:10.1103/PhysRevLett.102.155002
Fox, W., M. Porkolab, J. Egedal, N. Katz, and A. Le (2008), Laboratory Observation of Electron Phase-Space Holes during Magnetic Reconnection, Phys. Rev. Lett., vol. 101, Issue 25, id. 255003.
Franz, J. R., P.M. Kintner, J.S. Pickett (1998), POLAR observations of coherent electric field structures, Geophys. Res. Lett., Volume 25, Issue 8, p. 1277-1280.
Goldman, M.V., M.M. Oppenheim and D.L. Newman (1999), Nonlinear two-stream instabilities as an explanation for auroral bipolar wave structures, Geophys. Res. Lett., 26, DOI: 10.1029/1999GL900435
Hubbard, R.F. and G. Joyce (1979), Simulation of aurora1 double layers. J. Geophys. Res.,
84, 4297.
Joyce, G. and R.F. Hubbard (1978), Numerical simulation of plasma double layers., J.
Plasma Phys., 2391.
Karpman, V.I. and R.N. Kaufman (1982), Self-focusing of whistlers, Zh. Eksp. Teor. Fiz., 83.
Kellogg, P.J., C. A. Cattell, K. Goetz, S. J. Monson, and L. B. Wilson III (2010), Electron trapping and charge transport by large amplitude Whistlers, Geophys. Res. Lett., 37, L20106, DOI:10.1029/2010GL044845.
Khotyaintsev, Y.V., A. Vaivads, M. Andre, M. Fujimoto, A. Retino, and C. J. Owen (2010), Observations of Slow Electron Holes at a Magnetic Reconnection Site, , Phys. Rev. Lett.,
105(16), 165002, DOI:10.1103/PhysRevLett.105.165002.
Kletzing, C.A., et al. (2013), The Electric and Magnetic Field Instrument Suite and Integrated Science (EMFISIS) on RBSP, Space Sci. Rev., 179, 127–181, DOI:10.1007/s11214-013-9993-6.
Lakhina, G.S., D.A. Gurnett, N. Cornilleau-Wehrlin, A.N. Fazakerley, I. Dandouras, and E. Lucek, (2010), On the propagation and modulation of electrostatic solitary waves observed near the magnetopause on Cluster, Modern Challenges in Nonlinear Plasma Physics: A Festchrift Honoring the Career of K Papadopoulos, AIP Conference Proceedings 1320, American Institute of Physics, Melville, NY.
Lashmore-Davies, C., and T. Martin, Electrostatic instabilities driven by an electric current perpendicular to a magnetic field, Nuclear Fusion, 13(2), 193, 1973.
Lefebvre, B., L.-J. Chen, W. Gekelman, P. Kintner, J. Pickett. P. Pribyl, and S. Vincena (2011), Debye-scale solitary structures measured in a beam-plasma laboratory experiment,
Nonlinear Processes in Geophysics, Volume 18, Issue 1.
Li, S.Y., Y. Omura, B. Lembege, X.H. Deng, H. Kojima, Y. Saito, and S.F. Zhang (2014), Geotail observations of counter directed ESWs associated with the separatrix of magnetic reconnection in the near-Earth magnetotail, J. Geophys. Res.,
119,doi:10.1002/2013JA018920
Malaspina, D.M., D.L. Newman, L.B.III Wilson, K. Goetz, P.J. Kellogg, and K. Kersten (2013), Electrostatic solitary waves in the solar wind: Evidence for instability at solar wind current sheets, J. Geophys. Res., 118.
Malaspina D.M., L. Andersson, R.E. Ergun, J.R. Wygant, J.W. Bonnell, C. Kletzing, G.D. Reeves, R.M. Skoug, and B.A. Larsen (2014), Nonlinear electric field structures in the inner magnetosphere, Geophys. Res. Lett., 41, 5693
Matsumoto, H., H. Kojima, T. Miyatake, Y. Omura, M. Okada, I. Nagano, and M. Tsutsui, Electrotastic Solitary Waves (ESW) in the magnetotail: BEN wave forms observed by GEOTAIL (1994), Geophys. Res. Lett., 21, 2915–2918, DOI:10.1029/94GL01284.
Mende, S.B., et al. (2008), The THEMIS array of ground-based observatories for the study of auroral substorms, Space Sci. Rev., 141, 357-387, doi: 10.1007/s11214-008-9380-x.
Miyake, T., Y. Omura, H. Matsumoto, and H. Kojima (1998), Two-dimensional computer simulations of electrostatic solitary waves observed by Geotail spacecraft, J. Geophys. Res.,
103.
Morse, R.L. and C. W. Nielson (1969a), Numerical simulation of warm two-beam plasma,
Phys. Fluids, 12(11).
Morse, R.L., and C. W. Nielson (1969b), One-, Two-, and Three-Dimensional Numerical Simulation of Two-Beam Plasmas, Phys. Rev. Lett., 23.
Mozer, F.S., C.W. Carlson, M.K. Hudson, R.B. Torbert, B. Parady, J. Yatteau and M.C. Kelley (1977), Observations of paired electrostatic shocks in the polar magnetosphere, Phys.
Rev. Lett., 38, 292.
Mozer, F.S., and P.L. Pritchett (2009a), Regions associated with electron physics in asymmetric magnetic field reconnection, Geophys. Res. Lett., 36, L07102,
DOI:10.1029/2009GL037463.
Mozer, F. S., and P. L. Pritchett (2009b), The spatial, temporal, and amplitude characteristics of parallel electric fields associated with sub-solar magnetic field reconnection, J. Geophys.
Res., DOI:10.1029/2009JA014718.
Mozer F.S., O.V. Agapitov, V. Krasnoselskikh, S. Lejosne, G. D. Reeves, and I. Roth (2014), Direct Observation of Radiation-Belt Electron Acceleration from Electron-Volt Energies to Megavolts by Nonlinear Whistlers, Phys. Rev. Lett., 113, 035001.
Mozer F.S., S.D. Bale, J.W. Bonnell, C.C. Chaston, I. Roth, and J. Wygant (2013), Megavolt Parallel Potentials Arising from Double-Layer Streams in the Earth’s Outer Radiation Belt,
Phys. Rev. Lett., 111.
Newman, D.L., M.V. Goldman, R.E. Ergun, and A. Mangeney (2001), Formation of double layers and electron holes in a current driven space plasma, Phys. Rev. Lett., 87, 2559.
Omura, Y., H. Matsumoto, T. Miyake, and H. Kojima (1996), Electron beam instabilities as generation mechanism of electrostatic solitary waves in the magnetotail, J. Geophys. Res., 101.
Omura, Y., Y. Katoh, and D. Summers (2008), Theory and simulation of the generation of whistler-mode chorus, J. Geophys. Res., 113, A04223, DOI:10.1029/2007JA012622.
Oppenheim, M.M., G. Vetoulis, D.L. Newman, and M.V. Goldman (2001), Evolution of electron phase-space, holes in 3D, Geophys. Res. Lett., 28.
Osmane, A. and A.M. Hamza, (2012a), Relativistic particle acceleration as a consequence of Hopf bifurcation with application to the radiation belt electrons, Phys. of Plasmas, 19,doi:10.1063/1.3692234
Osmane, A., and A.M. Hamza, (2012b), Dynamical systems approach to relativistic nonlinear wave-particle interaction in collisionless plasmas, Phys. Rev., 85, doi:10.1103/PhysRevE.85.056410
Osmane, A., and T. I. Pulkkinen (2014), On the threshold energization of radiation belt electrons by double layers, J. Geophys. Res. Space Physics, 119, doi:10.1002/2014JA020236.
Raadu, M.A. (1989), The physics of double layers and their role in astrophysics, Physics
Reports, 178.
Roberts, K.V., and H. L. Berk (1967), Nonlinear Evolution of a Two-Stream Instability,
Phys. Rev. Lett., 19.
Roth, I., M. Temerin, and M.K. Hudson (1999), Resonant enhancement of relativistic electron fluxes during geomagnetically active periods, Ann. Geophys., 17, 631-638.
Saeki, K. P. Michelsen, H.L. Pécseli, J. Rasmussen (1979), Formation and Coalescence of Electron Solitary Holes, Phys. Rev. Lett., 42.
Shapiro, V.D., and S. K. Ride (1994), Nonlinear effects involving whistler wave propagation in the magnetosphere, J. Geophys. Res., 99.
Singh, N., Dynamically evolving double layers and density depletions (2003), J. Geophys.
Res., 108, DOI:10.1029/2002JA009815.
Spence, H. E. et al, (2013), Science Goals and Overview of the Energetic Particle, Composition, and Thermal Plasma (ECT) Suite on NASA’s Radiation Belt Storm Probes (RBSP) Mission, Space Sci. Rev., DOI:10.1007/s11214-013-0007-5
Streed, T., C. Cattell, F. Mozer, S. Kokubun, and K. Tsuruda (2001), Spiky electric fields in the magnetotail, J. Geophys. Res., 106.
Tao, J.B. et al, (2011), A model of electromagnetic electron phase-space holes and its application, J. Geophys. Res.,116, doi:10.1029/2010JA016054
Temerin M.A., K. Cerny, W. Lotko, and F.S. Mozer (1982), Observations of double layers and solitary waves in the auroral plasma, Phys. Rev. Lett., 48, 1175.
Tsyganenko, N.A. (1995), Modeling the earth’s magnetospheric magnetic-field confined within a realistic magnetopause, J. Geophys. Res., 100.
Vasko I., O.V. Agapitov, F.S. Mozer, A. Artemyev, D. Jovanovic (2015), Magnetic field depression within electron holes, Geophys. Res. Lett. DOI: 10.1002/2015GL063370
Williams, J.D., L.-J. Chen, W.S. Kurth, D.A. Gurnett, M.K. Dougherty and A.M. Rymer (2005), Electrostatic solitary structures associated with the November 10, 2003 interplanetary shock at 8.7 AU, Geophys. Rev. Lett., 32, L17103, doi:10.1029/2005GL23079
structures observed at Saturn, Geophys. Res. Lett., 33, L06103, doi:10.1029/2005GL024532
Wu, M., Q. Lu, A. Du, J. Xie, and S. Wang (2011), The evolution of the magnetic structures in electron phase‐space holes: Two‐dimensional particle‐in‐cell simulations, J. Geophys Res.,
116, A10208, DOI:10.1029/2011JA016486.
Wygant, J.R., et al.(2013), The Electric Field and Waves Instruments on the Radiation Belt Storm Probes Mission, Space Sci. Rev., 179, 183–220, DOI:10.1007/s11214-013-0013-7.
Yamamoto, T. and J.R. Kan (1985), Double layer formation due to current injection, Planet.
Figure 1. Examples of different types of time domain structures found by the Van
Allen Probes. The upper left section illustrates a non-linear whistler whose parallel
electric field is distorted by electron trapping that produces spin-periodic
unidirectional spikes [Kellogg et al, 2010]. The bottom left section describes
structures that are called electrostatic electron holes because the parallel electric
field signature is largely bipolar and there is no comparable magnetic field signature.
The top right section illustrates electron holes that are magnetized because the
electric field spikes are frequently accompanied by structures in the parallel
magnetic field component [Andersson et al, 2009; Tao et al, 2011; Vasko et al,
2015]. The bottom right section illustrates bipolar electron holes that evolve into
Figure 2. Fields and plasma measured at a magnetic local time of 2210, magnetic
latitude of 14.5o, and an L value of 5.9. In panel 2a, the X-component is black, the
Y-component is green, and the Z-component is red. The remaining quantities are
defined and described in the main text. The energy units at the rights of the plots are
Figure 3. Fields and plasma measured at a magnetic local time of 2310, magnetic latitude of
18.7o, and an L value of 11. In panel 3a, the X-component is black, the Y-component is
green, and the Z-component is red. The remaining quantities are defined and described in the
Figure 4. Correlation between Van Allen Probe A electric fields and plasma with auroral
Figure 5. Electric and magnetic fields observed in a particle-in-cell simulation in which
oblique whistlers produced time domain structures. Panels 5a and 5b give the perpendicular
magnetic field and parallel electric field inside a region of the box that is to the left of the
source. Panels 5c and 5d give the position as a function of time (the vertical axis) of the
perpendicular magnetic field and parallel electric field, from which it is seen that both
parameters move together at the same speed. Panels 5e and 5f give the simulation magnetic
and electric fields at a fixed point as a function of time. Panels 5g and 5h present the same
Figure 6. Electric and magnetic fields observed in space during the parametric instability of a
Figure 7. The distribution of the maximum field-aligned electron energies observed
Figure 8. Comparison of Van Allen Probe data with a field-aligned electron pitch
angle distribution produced in a simulation of electron interactions with 20 mV/m