HAL Id: hal-01553771
https://hal.archives-ouvertes.fr/hal-01553771
Submitted on 21 May 2021
HAL is a multi-disciplinary open access
archive for the deposit and dissemination of
sci-entific research documents, whether they are
pub-lished or not. The documents may come from
teaching and research institutions in France or
abroad, or from public or private research centers.
L’archive ouverte pluridisciplinaire HAL, est
destinée au dépôt et à la diffusion de documents
scientifiques de niveau recherche, publiés ou non,
émanant des établissements d’enseignement et de
recherche français ou étrangers, des laboratoires
publics ou privés.
of broadband electrons during a storm time substorm
A. Nakajima, K. Shiokawa, K. Seki, R. Nakamura, K. Keika, W.
Baumjohann, T. Takada, J. P. Mcfadden, C. W. Carlson, A. Fazakerley, et al.
To cite this version:
A. Nakajima, K. Shiokawa, K. Seki, R. Nakamura, K. Keika, et al..
Simultaneous FAST and
Double Star TC1 observations of broadband electrons during a storm time substorm.
Journal
of Geophysical Research Space Physics, American Geophysical Union/Wiley, 2010, 115, pp.7217.
�10.1029/2009JA014907�. �hal-01553771�
during geomagnetic storms. Here, we report a BBE event observed by the Fast Auroral
Snapshot (FAST) satellite at 1355–1359 UT, ∼61°–66° invariant latitudes, ∼0600
magnetic local time (MLT), and
∼3800 km altitude during a storm on 25 July 2004.
The Double Star (DS) TC1 satellite was located near the magnetic equator at L = 5.7, close
to the same local time as FAST. We investigate the acceleration process of BBEs from
the inner magnetosphere to near the ionosphere by comparing electron data obtained by
FAST and DS TC1. We also investigate both plasma and field variations in the inner
magnetosphere associated with substorm onset using DS TC1 data to examine the
relationship between the BBEs and the storm time substorm. Ground geomagnetic field
data show a positive H
‐bay at ∼1349 UT at ∼0600 MLT, indicating that a storm time
substorm started just before the appearance of the BBEs. At
∼1350 UT, a tailward ion flow
was observed by DS TC1. Then, DS TC1 observed a local dipolarization and a drastic ion
density enhancement at
∼1351 UT, indicating that particle heating associated with the
substorm was occurring in the inner magnetosphere. From
∼1352 UT, electron fluxes were
isotropically enhanced at energies above
∼0.5 keV as observed by DS TC1. On the other
hand, the pitch angle distribution of BBEs at the FAST altitude showed field‐aligned
lower‐energy electrons below ∼0.5 keV and isotropic higher‐energy electrons above
∼0.5 keV. From these data, it was inferred that the BBEs might consist of two energy
components due to the acceleration or heating of electrons at different altitudes in
association with the storm time substorm.
Citation: Nakajima, A., et al. (2010), Simultaneous FAST and Double Star TC1 observations of broadband electrons during a storm time substorm, J. Geophys. Res., 115, A07217, doi:10.1029/2009JA014907.
1.
Introduction
[2] Since the early 1970s, auroral electrons have been investigated by many researchers through analyses of elec-tron energy spectra obtained by rockets and ionospheric satellites [e.g., Frank and Ackerson, 1971; Lui et al., 1977; Bryant et al., 1978; McEwen et al., 1981]. The electron energy spectra provide much useful information for
under-standing the acceleration and heating of these electrons. Several studies have shown the characteristics of electron energy spectra, especially during geomagnetic storms [e.g., Denig and Rich, 1986; Egeland et al., 1994; Sharber et al., 1998; Dombeck et al., 2005]. However, the spectral char-acteristics of storm time auroral electrons are still not completely understood owing to the complexity of storm time spectra.
1Solar‐Terrestrial Environment Laboratory, Nagoya University,
Nagoya, Japan.
2Space Research Institute, Austrian Academy of Sciences, Graz,
Austria.
3Now at Center for Solar‐Terrestrial Research, New Jersey Institute of
Technology, Newark, New Jersey, USA.
4
Institute of Space and Astronautical Science, JAXA, Sagamihara, Japan.
5
Space Sciences Laboratory, University of California, Berkeley, California, USA.
6
Mullard Space Science Laboratory, University College London, Dorking, UK.
7Centre d’Etude Spatiale des Rayonnements, Toulouse University,
CNRS, Toulouse, France.
8Institute of Geophysics and Planetary Physics, University of
California, Los Angeles, California, USA.
9Laboratoire de Physique des Plasmas, Ecole Polytechnique, UPMC,
CNRS, Palaiseau, France.
10Department of ACSE, University of Sheffield, Sheffield, UK.
Copyright 2010 by the American Geophysical Union. 0148‐0227/10/2009JA014907
[3] In the present study, we will analyze broadband electrons (BBEs), which are auroral electrons observed during storms with characteristic spectra. The spectra of BBEs are very different from the spectra of ordinary plasma sheet electrons. BBEs have drastic electron flux enhance-ments over a broad energy range (0.03–30 keV) at the lower latitude side of the auroral oval during storms, which has been reported by Shiokawa et al. [1996] based on particle observations by Defense Meteorological Satellite Program (DMSP) satellites. The pitch angle distribution of electrons obtained by the Fast Auroral Snapshot (FAST) satellite suggests that BBEs consist of two energy components (higher and lower energies) due to the acceleration of electrons at different altitudes [Nakajima et al., 2007, 2008]. In these previous studies of BBEs, data from low‐altitude
satellites (DMSP: ∼840 km and FAST: ∼350–4200 km)
were used. Shiokawa et al. [1999] reported a BBE event observed by DMSP when the Combined Release and Radiation Effects Satellite (CRRES) was located at high
altitude (L ∼6) at the same local time as DMSP. CRRES
observed a drastic enhancement of electron flux at energies of 0.1–10 keV, particularly in the field‐aligned direction. However, the detailed spectra of the electrons and ions, including their pitch angle distribution and ion moments at CRRES, were not investigated.
[4] A multievent study of BBEs using FAST data
[Nakajima et al., 2008] found that, while BBEs are associ-ated with substorms during large storms (minimum Dst < −100 nT), storm time substorms do not always have BBEs. This suggests that BBEs are rare or short‐lived phenomena. [5] In this paper, we report a BBE event observed during a storm time substorm on 25 July 2004 using FAST and Double Star (DS) TC1 satellite data. When FAST observed
the BBEs at ∼3800 km, DS TC1 was located near the
magnetic equator at L = ∼5.7. DS TC1 has higher angular
resolution and wider energy coverage of electrons and ions than CRRES. The footprints of FAST and DS TC1 are mapped to similar latitudes separated by∼1 h of local time. The simultaneous observations provide a unique opportunity to compare particle features associated with BBEs at FAST altitudes, above the ionosphere, with the inner magneto-sphere observations from DS TC1. We investigate the acceleration process of BBEs from the inner magnetosphere to near the ionosphere by comparing the electron energy spectra and pitch angle distributions obtained by FAST and DS TC1. We also investigate both plasma and field varia-tions in the inner magnetosphere associated with the sub-storm onset using DS TC1 data to examine the relation between the BBEs and the storm time substorm evolution.
2.
Observations
2.1. Data Set
[6] The FAST satellite, which was launched on 21 August 1996, has an 83° inclination polar orbit and a perigee/apogee of 350/4200 km. The orbital and spin periods are∼133 min and ∼5 s, respectively. The satellite spin axis is nearly normal to the orbital plane [Carlson et al., 1998]. We use data from the Electrostatic Analyzers (ESAs) [Carlson et al., 2001] and the magnetic field instrument [Elphic et al., 2001] on board FAST. The ESAs provide energy spectra and pitch angle distributions of particles in the local magnetic field
every∼0.6 s during the present event. The energy ranges of the ESAs are 4 eV to 32 keV for electrons. We do not discuss the data of electrons at energies below 30 eV, as these low‐energy data are strongly affected by variations of satellite potential.
[7] The Double Star program consists of two spacecrafts. The first spacecraft, TC‐1, was launched on 29 December 2003 and placed into an equatorial orbit of 580 × 79,000 km altitude with a 28° inclination [Liu et al., 2005]. The DS TC1 satellite has a∼27 h orbit and a ∼4 s spin period. In this study, we use electron, ion, magnetic field, and wave data from the Plasma Electron and Current Experiment (PEACE) [Fazakerley et al., 2005], Hot Ion Analyzer (HIA) [Rème et al., 2005], Fluxgate Magnetometer (FGM) [Carr et al., 2005], and Spatiotemporal Analysis of Field Fluctuations (STAFF)‐Digital Wave‐Processing (DWP) experiment [Cornilleau‐Wehrlin et al., 2005] of DS TC1, respectively. The PEACE instrument measures electrons at energies from ∼1 eV to 25 keV in a 180° field of view and 15° resolution in the polar angle. For the azimuthal angle, there are three sweep modes (angular resolutions of 5.7°, 11.3°, and 22.5°). The HIA instrument performs a full 4p steradian scan completed every spin of the spacecraft, giving a full three‐ dimensional distribution of ions in the energy range from ∼5 eV/q to 32 keV/q. STAFF consists of a three‐axis search coil magnetometer for measuring magnetic fluctuations at frequencies up to 4 kHz. DWP provides several onboard analysis tools. One of these tools is a complex fast Fourier transform to fully characterize electromagnetic waves in the frequency range of 1 Hz to 4 kHz.
2.2. Overview
[8] Figure 1 shows an energy‐time (E‐T) spectrogram
of field‐aligned downward electrons (pitch angle <15°) obtained by FAST at 1340–1410 UT on 25 July 2004. Electron energy fluxes are drastically enhanced over a broad energy range (∼0.03–30 keV) at lower invariant latitudes (ILATs) of 66°–61°, as indicated by the horizontal arrow. Such intense electron fluxes over this broad energy range at the lower latitude side of the auroral oval are identified as BBEs. The BBEs are observed at magnetic local times
(MLTs) of ∼6.1–6.4 h and an altitude of ∼3800 km at
∼1355–1359 UT.
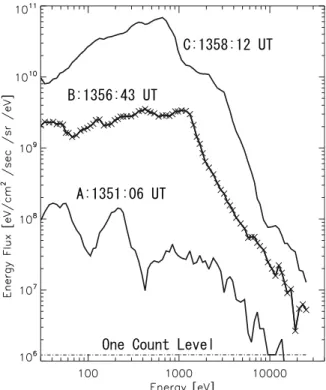
[9] To compare the intensity of the fluxes, energy spectra of field‐aligned electrons at pitch angles <15° at 1351:06 UT (curve A), 1356:43 UT (curve B), and 1358:12 UT (curve C) are plotted in Figure 2. The times of curves A–C are indi-cated by the vertical arrows in Figure 1. The time in curve A is selected as an example of higher‐latitude precipitation spectra. In curve B during the appearance of BBEs, the electron fluxes are much stronger than those at curve A over the whole energy range. Electron fluxes are even more enhanced over the whole energy range in curve C.
[10] Figures 3a and 3b show the locations of FAST, DS
TC1, and the geosynchronous GOES 10 satellite at 1340– 1400 UT on 25 July 2004 in the X‐Y and X‐Z planes of the SM coordinates, respectively. At 1356:43 UT, FAST and DS TC1 crossed the field lines indicated by the dashed and dotted lines, respectively. These field lines were calculated using a geomagnetic field model (T96_01) by Tsyganenko [1995, 1996].
[11] When FAST passed from the northern pole across the
auroral zone and observed the BBEs at∼1355–1359 UT, the
three satellites were located nearly in the same local time (∼0600 MLT) in the Northern Hemisphere. At 1400 UT, the positions of DS TC1 and GOES 10 were (X, Y, Z)∼(−2, −5, 1) REand ∼(−2, −6, 1) RE, respectively. These satellites were near the magnetic equator in the inner magnetosphere. When we later compare FAST and DS TC1 electron data at 1356:43 UT, the footprints of FAST and DS TC1 at the
magnetic equator are separated by∼3 RE.
[12] In Figure 4, the satellite track of FAST in
geo-graphical coordinates at an altitude of 100 km in the Northern Hemisphere is denoted by the solid line with asterisks every 10 min during 1340–1400 UT. This satellite passed from the northern arctic region to lower latitudes. On the other hand, the footprints of DS TC1 and GOES 10 indicated by the open diamond and open circle, respectively, did not move significantly. These footprints were calculated using the T96_01 geomagnetic field model [Tsyganenko, 1995, 1996]. The footprint mapping using the T96_01 model contains uncertainty, because this mapping calcula-tion is strongly influenced by magnetic field variacalcula-tion during storms and substorms. The present BBE event took place during a storm time substorm, as will be shown later. We must keep in mind this uncertainty when comparing observations
of FAST and DS TC1. The locations of the ground‐based
magnetometer and riometer stations, which are shown in Figures 6 and 7 and discussed in section 2.3, are also shown. The top and right of Figure 4 are sunward and dawnward, respectively.
[13] As shown in Figure 4, the footprints of FAST, DS
TC1, and GOES 10 at 1400 UT were at (51°N, 255°E), (54°N, 240°E), and (53°N, 243°E) in the dawnside sector, respectively. These footprints are mapped to similar latitudes with differences of less than 5° during the BBE event. The local time difference between these footprints was less than 1 h. Riometer data indicate that enhanced electron precipi-tation was occurring throughout the spatial region that included the FAST, GOES, and DS TC1 ionospheric
foot-prints, as will be noted in section 2.6. It is reasonable to speculate that the enhanced electron precipitation over the entire region results from the same mechanisms. In an event study of BBEs observed by FAST, Nakajima et al. [2007] reported that simultaneous auroral images from the Polar
Figure 2. Electron energy spectra of field‐aligned elec-trons (pitch angle <15°) obtained by FAST at 1351:06 UT (curve A), 1356:43 UT (curve B), and 1358:12 UT (curve C) on 25 July 2004. Times are indicated by vertical arrows in Figure 1. Crosses on energy spectrum (curve B) indicate energy steps of ESAs, which are almost the same for all three spectra. Dashed‐dotted line shows one count level of ESAs.
Figure 1. Energy‐time (E‐T) spectrogram of field‐aligned electrons (pitch angle <15°) for differential energy flux obtained by FAST at 1340–1410 UT on 25 July 2004. Horizontal arrow indicates time interval of the BBE event identified in this paper. Vertical arrows indicate times (Figure 2, curves A–C) of electron energy spectra.
satellite showed that the precipitating region of BBEs cov-ered∼10° in latitude and ∼1 h in local time, which included the ionospheric footprint of FAST.
[14] Figure 5 shows the variation of the Dst index on
24–27 July 2004. A large geomagnetic storm started at
0400 UT on 24 July and the Dst index reached a minimum value (∼ −150 nT) at 1000 UT on 25 July. The BBEs reported in this paper were observed around the Dst
min-imum at ∼1400 UT, as indicated by the vertical arrow.
2.3. Magnetic Field Variations
[15] To clarify the relation of the BBE event to the
substorm, we examined the magnetic field data obtained by
the geosynchronous GOES 10 satellite and ground‐based
stations. Figure 6a shows the magnetic field data (time resolution: 1 min) obtained by GOES 10. From the top to bottom in Figure 6a, the X, Y, and Z components of the GSM coordinates at 1200–1500 UT on 25 July 2004 are
plotted. Figure 6b shows geomagnetic H component varia-tions from high‐ to low‐latitude stavaria-tions. The station names and locations are listed in Table 1. As shown in Figure 4, the footprint of GOES 10 and the ground stations was at∼0500–
0600 MLTs when FAST observed the BBEs at∼1355 UT.
[16] GOES 10 observed decreasing Bx and increasing Bz
beginning at∼1347 UT, as indicated by the vertical dotted line in Figure 6a, indicating that dipolarization started at this
time. The By component temporarily increased in
associa-tion with the dipolarizaassocia-tion. Negative and positive H‐bays at higher‐ and lower‐latitude ground stations, respectively, were also observed around this time. We identified starts of positive/negative magnetic field variation as the starts of positive/negative H‐bays, which represent substorm onset signatures. The earliest substorm signatures on the ground were at SIM (MLT = 5.0 h) at∼1349 UT, as indicated by the dotted line in Figure 6b. A few minutes later, the substorm signatures were detected in other latitudinal regions, for
example, at∼1350 UT at MEA.
[17] The geomagnetic H and D variations at low latitudes from∼1000 to 0300 MLTs are plotted in Figures 7a and 7b, respectively. The station names and locations are shown in
Table 1 and Figure 4. At all stations between ∼1000 and
0500 MLTs, positive H‐bays started at ∼1350 UT, as indi-cated by the vertical dotted line in Figure 7a, with the
exception of HON at ∼0300 MLT. In Figure 7b,
geomag-netic D components began to decrease at∼1350 UT between
∼1000 and 0500 MLTs associated with the H‐bays. At HON, however, no notable magnetic field variation was observed at 1350 UT.
2.4. FAST Observation
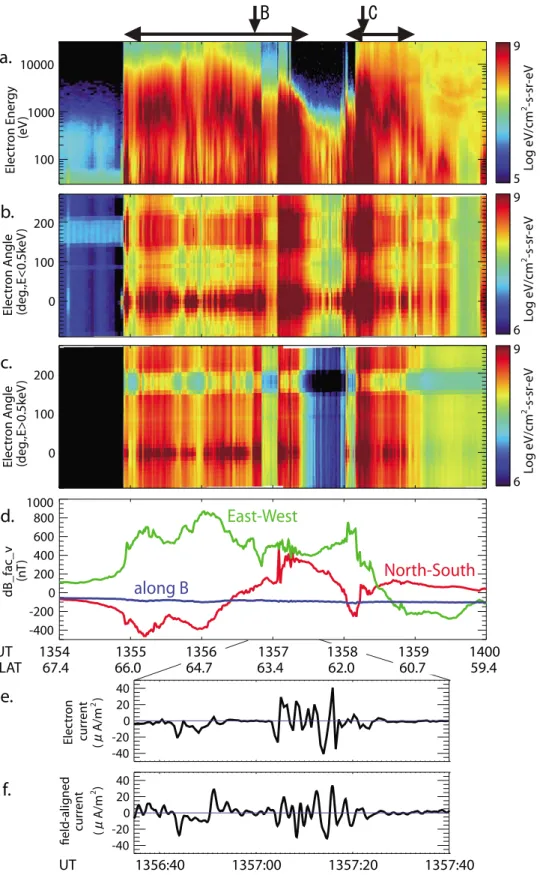
[18] Figures 8a–8d show electron (0.6 s sampling) and magnetic field (8 Hz sampling) data obtained by FAST at 1354–1400 UT. Electron energy fluxes were drastically enhanced over a broad energy range (∼0.03–30 keV) at ∼1355–1359 UT in the omnidirectional E‐T spectrogram (Figure 8a). However, to be exact, the electron fluxes tem-porarily decreased during 1357:30–1358:00 UT. In Figure 8a, the time interval of the BBE event is precisely indicated by the horizontal arrows. Figures 8b and 8c show the pitch angle distributions of electrons at energies below and above 0.5 keV, respectively.
[19] During the BBE event, field‐aligned downward
fluxes (∼0°) were most intense at energies below 0.5 keV, as shown in Figure 8b. Field‐aligned upward fluxes (∼180°)
were sometimes enhanced (e.g., at ∼1357:10 UT). On the
other hand, electron fluxes above 0.5 keV tended to be more isotropic (Figure 8c), although the field‐aligned downward fluxes were slightly larger than the fluxes in other directions. The reduced upward energy flux has features of the loss cone.
[20] Figure 8d shows the three‐component magnetic field variations in the field‐aligned coordinate system. The blue curve indicates the magnetic field variations along the local magnetic field given by the International Geomagnetic Reference Field (IGRF) model. The red and green curves are the magnetic fields along the spacecraft velocity vector (nearly north–south) and in the nearly east–west direction, respectively.
[21] The magnitudes of magnetic field variations during the BBE event are larger than those at the higher‐latitude Figure 3. Locations of FAST, DS TC1, and GOES 10 at
1340–1400 UT on 25 July 2004 in (a) X‐Y and (b) X‐Z planes in SM coordinates. Small solid circles indicate locations of the three satellites at 1340 UT. Asterisk, open diamond, and open circle show the locations of FAST, DS TC1, and GOES 10 at 1400 UT, respectively. At 1356:43 UT, FAST and DS TC1 crossed the magnetic field lines indicated by dashed and dotted lines, respectively. Field lines from ground in the Northern Hemisphere to magnetic equator were calculated using the geomagnetic field model (T96_01) by Tsyganenko [1995, 1996].
region above∼66° ILAT (Figure 8d). Intense fluctuations of the magnetic field were occasionally observed in the north– south and east–west magnetic fields (e.g., ∼1357:10 UT).
[22] We compared the current density of the field‐aligned current (FAC) estimated from the electron and magnetic field data in Figures 8e and 8f, respectively. Both methods of estimating the FAC have uncertainties. The electron ESA can provide a current density estimated from a measurement of the number flux; however, since the energy range of ESA is limited, lower energy electrons that can carry significant current density are not included in the estimated current density. This usually affects the calculation of downward current densities, which are carried by upward flowing electrons. The FAC density is also calculated by taking the gradient of the magnetic field along the spacecraft trajectory. This implicitly assumes that the FAC is an infinite sheet current, oriented perpendicular to the spacecraft trajectory. It is further assumed that the current sheet is stationary in time and space.
[23] Despite the above mentioned observational limits of the ESA and the assumptions made to estimate the FAC, the current densities estimated by the two methods have sig-nificant similarities, as shown in Figures 8e and 8f. The agreement is not perfect, but good agreement can be seen in the variation and intensity of current density between 1357:00 and 1357:20 UT when the electron energy flux is especially intense during the BBE event. These similarities during the time interval plotted in Figures 8e and 8f indicate that precipitating electrons over the measurable energy range of ESA play a major role as carriers of the FAC. The spatial structure of the FAC possibly appears as magnetic field variation. Based on this result, the FAC can be regarded as an almost stationary sheet current in time and space when observed by satellite. This result indicates that BBEs possibly correspond to a complex region of both upward and downward currents rather than a uniform upward current region, although BBEs are an intense precipitation of electrons.
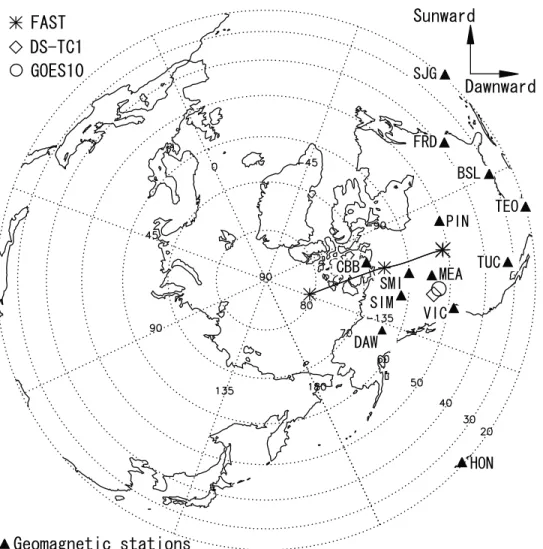
Figure 4. Satellite track of FAST at altitude of 100 km in the Northern Hemisphere in geographical coordinates is shown by a solid line with an asterisk denoting every 10 min during 1340–1400 UT. During this time, footprints of DS TC1 and GOES 10 indicated by the open diamond and open circle, respec-tively, were located at almost the same latitude and longitude. These footprints were calculated using the T96_01 geomagnetic field model [Tsyganenko, 1995, 1996]. Closed triangles indicate ground‐ based magnetometer and riometer stations, which are used in Figures 6 and 7 and section 3.
2.5. DS TC1 Observation
[24] Figure 9 shows magnetic field, electron, ion, and wave data at 1340–1400 UT obtained by the FGM, PEACE, HIA, and STAFF‐DWP onboard DS TC1, respectively. The
Table 1. Ground‐Based Geomagnetic Stations Shown in Figures 6 and 7a
Station Abbreviation GLAT GLONG MLAT Bay St. Louis BSL 30.4°N 270.4°E 41.2°N Cambridge Bay CBB 69.1°N 255.0°E 77.1°N Fort Simpson SIM 61.8°N 238.8°E 67.4°N Fredericksburg FRD 38.2°N 282.6°E 48.9°N Honolulu HON 21.3°N 202.0°E 29.2°N Meanook MEA 54.6°N 246.7°E 62.0°N San Juan SJG 18.1°N 293.9°E 27.5°N Teoloyucan TEO 19.7°N 260.8°E 29.2°N Tucson TUC 32.2°N 249.3°E 39.8°N Victoria VIC 48.5°N 236.6°E 53.7°N
aGLAT, geographic latitude; GLONG, geographic longitude; MLAT,
dipole geomagnetic latitude.
Figure 5. Dst index on 24–27 July 2004. Vertical arrow indicates time when BBEs were observed by FAST.
Figure 6. (a) X, Y, and Z components of magnetic field in GSM coordinates obtained by GOES 10 and (b) H component of magnetic fields at ground‐based stations at 1200–1500 UT on 25 July 2004. In Figure 6b, data are shown from top to bottom in descending order of geomagnetic latitudes. GOES 10 and all stations are around the same local time as BBEs (∼0600 MLT), as shown in Figure 4. Higher‐latitude (CBB, SIM, and MEA) and lower‐latitude (VIC) station data are plotted in 100 and 40 nT/div, respectively. Station names and locations are listed in Table 1. Vertical dotted lines in Figures 6a and 6b denote 1347 and 1349 UT, respectively.
Figure 7. Geomagnetic (a) H and (b) D components observed at ground‐based stations at 1200–1500 UT on 25 July 2004. From top to bottom in Figures 7a and 7b, data
are shown from∼1000 to ∼0300 MLTs, all of which are at
latitudes below 55° MLAT. Data are plotted at 20 nT/div. Station names and locations are shown in Table 1 and Figure 4. Vertical dotted lines indicate 1350 UT.
Figure 8. (a) Omnidirectional E‐T spectrogram and pitch angle distributions (0° is field‐aligned downward) of electrons at energy ranges (b) below and (c) above 0.5 keV, (d) three‐component magnetic field in field‐aligned coordinate system (blue, field‐aligned component; red, nearly north–south
compo-nent; green, nearly east–west component) observed by FAST at 1354–1400 UT on 25 July 2004. Current
densities of FAC estimated from (e) electron number flux and (f) gradient of the magnetic field at 1356:35–1357:40 UT. Horizontal arrows indicate time intervals of the BBE events. Vertical arrows denote times at which pitch angle distributions and energy spectra of FAST in Figures 10 and 11 were obtained.
horizontal arrow in Figure 9a indicates the time period when BBEs were observed by FAST. In Figure 9a, the black, red, and blue curves indicate the X, Y, and Z components of the magnetic field in the GSM coordinates, respectively. The time resolution of the data is∼4 s, which is the spin period of DS TC1. Figures 9b–9d show E‐T spectrograms of field‐ aligned downward, perpendicular, and upward electrons, respectively. The electron‐energy spectra in Figures 9b–9d were calculated once per spin (∼4 s). Figures 9e–9g show omnidirectional E‐T spectrograms of ions, ion density, and ion velocity, respectively. The ion spectra in the E‐T spec-trograms and ion moment data (density and velocity) were
calculated every three spins (∼12 s). In Figure 9g, the black, red, and blue curves indicate the ion velocities in the X, Y, and Z directions in GSM coordinates, respectively. Figure 9h shows the magnetic field wave spectrogram between 10 and 4000 Hz. This spectrogram was obtained by combining the signals from the three axes of the STAFF antenna to sim-ulate a single axis oriented to minimize interference. The time resolution of this spectrogram is ∼4 s. The frequency scale of the spectrogram is linear below 200 Hz and approximately logarithmic above that.
[25] In Figure 9g, we plotted ion velocities perpendicular to the local magnetic field, which were calculated from the Figure 9. (a) Magnetic field, E‐T spectrograms of (b) field‐aligned downward, (c) perpendicular, and
(d) upward electrons, (e) omnidirectional E‐T spectrogram of ions, (f) ion density, (g) perpendicular ion velocities, and (h) wave spectrogram of magnetic field between 10 and 4000 Hz obtained by DS TC1 at 1340–1400 UT on 25 July 2004. For magnetic field and ion velocity in Figures 9a and 9g, X, Y, and Z components in GSM coordinates are indicated by black, red, and blue curves, respectively. Horizontal arrows indicate time periods when BBEs were observed by FAST. Black vertical arrows show times at which pitch angle distributions and energy spectra of DS TC1 in Figures 10 and 11, respectively, were obtained. Times of local dipolarization in Figure 9a and intense tailward ion flux in Figure 9g are indicated by blue and red vertical arrows, respectively.
ization, By temporarily decreased. This dipolarization was observed∼4 min after that observed by GOES 10 at L = 6.6 which was further from the earth than DS TC1 at L = 5.7.
[28] Immediately after ∼1351:30 UT, electron and ion
fluxes nearly simultaneously intensified at all energies monitored with PEACE and HIA (Figures 9b–9e). In asso-ciation with the flux intensification, ion density was
enhanced at∼1351–1400 UT (Figure 9f). Wave power over
a broad frequency range of 10–200 Hz (Figure 9h) and at
lower frequencies of 1–10 Hz (not shown) was enhanced
temporarily at ∼1351:30 UT.
[29] The magnetic reconnection site at substorm expan-sion onset is usually located at −20 > X > −30 RE [e.g., Baumjohann et al., 1989, 1999; Nagai et al., 1998; Miyashita et al., 2000, 2003]. At radial distances earthward of the reconnection site in the tail plasma sheet, earthward ion flow perpendicular to the local magnetic field is usually observed in association with the substorm onset. However, such earthward flow was not observed by DS TC1 during the present event. On the other hand, DS TC1 observed intense perpendicular tailward flow at∼1350:25–1351:40 UT (beginning∼1 min before the local dipolarization) (Figure 9g). At 1350:50 UT, as indicated by the red vertical arrow in Figure 9g, the tailward, duskward, and northward perpen-dicular ion velocity of (Vx, Vy, Vz)∼(−500, 200, 300) km/s was observed by DS TC1 at L =∼5.7, though these absolute values are affected by the noise in the HIA data. However, the fluctuation of the ion velocity is larger than that of the noise. We also confirmed the reliability of ion velocity by monitoring the distribution function around this time inter-val. This perpendicular flow burst at the substorm onset will be discussed in section 3.
2.6. Comparison of Electron Data of FAST
and DS TC1
[30] While the electron flux enhancement was observed
by DS TC1 at∼1351–1400 UT in Figures 9b–9d, the BBEs
were observed by FAST at 1355–1359 UT, as shown in Figure 8a. In Figure 10, we compare the pitch angle dis-tributions of electrons observed by FAST (Figure 10, top) and DS TC1 (Figure 10, bottom) simultaneously at (B) 1356:43 UT (Figure 10, left) and (C) 1358:12 UT (Figure 10, right) on 25 July 2004. These times are indicated by the vertical black arrows in Figures 8 and 9. These pitch angle distributions were obtained by FAST and DS TC1 every ∼1 s and ∼8 s, respectively.
latitude and <1° in longitude for these changes in Dst and IMF‐Bz.
[33] We also examined riometer data (not shown) obtained in the Canadian sector near the footprints of the FAST and DS TC1 satellites during the present BBE event. The absorptions intensified during 1350–1420 UT at Dawson (DAW, 65.9° MLAT, 3.3 MLT), Fort Smith (SMI, 67.5°, 5.7 MLT), and Pinawa (PIN, 60.3°, 7.2 MLT) compared with those at 1330 UT. The locations of these stations are plotted in Figure 4. These results indicate that the footprints of both FAST and DS TC1 were located in the enhanced electron precipitation region. It therefore seems reasonable to assume that, even though the satellite footprints are sep-arated, they lie within the same precipitation region, and so are observing the signatures of the acceleration processes on essentially the same flux tubes.
[34] From FAST data at (B) 1356:43 UT in Figure 10 (top left), field‐aligned electron fluxes were most intense, and perpendicular fluxes were weakest at lower energies below ∼0.5 keV. In contrast, at higher energies above ∼0.5 keV, electron fluxes were isotropically enhanced with an upward loss cone. Similar pitch angle features at lower and higher energies for FAST data were seen also at (C) 1358:12 UT, as shown in Figure 10 (top right), although the flux inten-sities over all energies were more intense at (C) 1358:12 UT than those at (B) 1356:43 UT. In Figure 10 (bottom), the electron fluxes were isotropic at energies above∼0.5 keV at DS TC1 at both (B) 1356:43 UT and (C) 1358:12 UT. Field‐aligned low‐energy electrons observed by FAST were not observed by DS TC1. Similar pitch angle characteristics
were continuously observed during ∼1355–1359 UT at
FAST in Figures 8b and 8c and during∼1353–1400 UT at
DS TC1 in Figures 9b–9d, respectively.
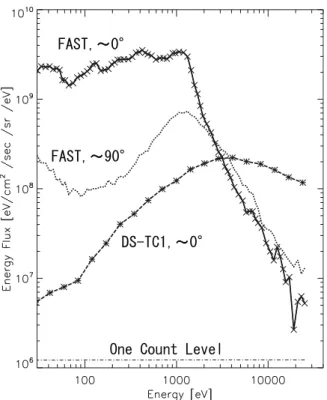
[35] We also compare electron energy spectra obtained by FAST and DS TC1 at (B) 1356:43 UT in Figure 11. The solid and dotted curves show energy spectra of field‐aligned downward and perpendicular electrons obtained by FAST. The energy spectrum of field‐aligned downward electrons obtained by DS TC1 is indicated by the dashed curve. As can be seen in Figure 10, the energy spectrum obtained by DS TC1 exhibited flux enhancement mainly at higher
energies above∼0.1 keV. On the other hand, the spectrum
of field‐aligned electrons obtained by FAST showed flux enhancements at energies not only above∼0.5 keV but also
below∼0.5 keV. The shape of the spectrum obtained by DS
was similar to that of perpendicular electrons obtained by FAST at energies above 0.1 keV.
3.
Discussion
3.1. Relation to Storm Time Substorm
[36] Previous studies have shown that BBEs mostly
appear during substorms in the main phase of geomagnetic storms [e.g., Shiokawa et al., 1997]. Baumjohann et al. [1996] reported a clear difference in the dynamics of the near‐Earth tail for substorms that occur during the main phase of storms and for non–storm time substorms. The magnetic field dipolarization and the earthward convection in the near‐Earth tail are much more pronounced for sub-storms during the main phase of sub-storms than for nonstorm substorms. Schödel et al. [2002] concluded that the transport of plasma and of magnetic flux is greatly enhanced during the main phase of the storm. It is difficult to understand
substorm processes that occur during magnetic storms owing to complex plasma and field evolution in the inner magnetosphere. This study and related researches on BBEs can aid us in understanding the complex plasma dynamics in the inner magnetosphere during storm time substorms.
[37] The BBEs presented in this paper occurred during the
main phase of a large storm at ∼0600 MLT. During the
appearance of BBEs, both DS TC1 and GOES 10 were located near the dawnside magnetic equator. Footprints of FAST, DS TC1, and GOES 10 were mapped to similar latitudes with differences of less than 5° and local time
separation of ∼1 h during the BBE event. At ∼1347 UT,
GOES 10 observed dipolarization on the geosynchronous
orbit (L = ∼6.6). Positive and negative H‐bays were
observed by the ground‐based stations at ∼0500–0600 MLTs
at ∼1349 UT. Around this time, magnetic Pi 2 pulsations
were also observed at low‐latitude stations (e.g., HON at 2.9 MLT) (data not shown). DS TC1 observed a local Figure 10. Pitch angle distributions using differential electron energy flux as functions of energy and
pitch angle obtained by (top) FAST and (bottom) DS TC1 at (left) 1356:43 UT and (right) 1358:12 UT on 25 July 2004. These times are indicated by vertical black arrows in Figures 8 and 9. Upper sides of vertical axes and horizontal axes indicate field‐aligned downward (0°) and perpendicular directions, respectively. Dashed circle in each plot indicates energy of 0.5 keV. Lower‐energy electron data (<30 eV) are hidden by black disks, as these data are not discussed and are possibly affected by variations of satellite potential. Note that units of differential electron energy flux are different between these satellite data.
dipolarization at L =∼5.7 at ∼1351 UT. These facts indicate
that a substorm began at ∼0500–0600 MLTs at 1347–
1349 UT. The BBEs occurred in association with the storm time substorm, which has been reported in previous studies of BBEs using the magnetic field data obtained in the geosyn-chronous orbit and on the ground [Shiokawa et al., 1996; Nakajima et al., 2007, 2008]. In this study, we examined the
by the Cluster satellites between −19 < X < −12 RE and dipolarization events observed by DS TC1 between−13 < X < −6 RE, based on conjunction events in the nightside magnetotail (∣Y∣ < 10 RE) in summer 2004. They found no evidence of a fast flow event associated with dipolarization
when DS TC1 was at X >−8 RE.
[39] For the present event, however, DS TC1 at L =∼5.7 observed intense tailward ion flux at∼1350:25–1351:40 UT, which was just after the substorm onset. Considering the above mentioned previous works, the intense tailward ion flux at L =∼5.7 is somewhat unusual, although the present case is on the dawnside rather than nightside. The only theoretically viable explanation available at this time is that the perpendicular tailward ion flux at the onset was caused by combination of a steep density gradient near the space-craft with the finite gyroradius effect of high‐energy ions, as discussed by Ohtani et al. [2000, Figure 1].
[40] When the most intense tailward ion flow was
detected by DS TC1 at (X, Y, Z) ∼(−1, −5, 2) RE at
1350:50 UT, the perpendicular ion velocity components
were (Vx, Vy, Vz) ∼(−500, 200, 300) km/s. The magnetic
field intensity was (Bx, By, Bz)∼(110, 230, 30) nT. In order to explain the observed tailward perpendicular ion flux, based on the ion motion with finite gyroradius and the direction of the magnetic field observed by DS TC1, we consider that the high ion density region appeared inside DS TC1 as shown in Figure 12. In this situation, due to the equatorward ion density gradient at the dawnside in the inner magnetosphere, the tailward ion flux from the high‐
Figure 12. Schematics of satellite positions, magnetic field configuration, and expected density gradient of ions in the Y‐Z plane of GSM coordinates. Directions of ion gyration are indicated by the circles with the cross (inward) and the dot (outward). Shaded regions indicate areas thought to have high ion popu-lation based on DS TC1 observations.
Figure 11. Solid and dotted curves show energy spectra of field‐aligned downward (pitch angle within 15°) and per-pendicular (pitch angle between 75° and 105°) electrons observed by FAST at 1356:43 UT on 25 July 2004 (Figure 10, top left). Dashed curve indicates spectrum of field‐aligned electrons obtained by DS TC1 at 1356:43 UT (Figure 10, bottom right). Time of Figures 10 (top left) and 10 (bottom right) is indicated by the vertical black arrows in Figures 8 and 9. Crosses on the solid curve and asterisks on the dashed curve denote energy steps for ESAs of FAST and PEACE of DS TC1, respectively.
density region associated with the ion gyration motion was more intense than the earthward flux of the gyration. Similarly, the duskward and northward ion flux could be interpreted in terms of the equatorward and tailward ion density gradients.
[41] We examined the pitch angle distribution of ions to verify the possibility of nonisotropic ion gyration due to the density gradient. During the time interval when the tailward flux was observed at∼1350:25–1351:40 UT, the pitch angle distribution was sometimes not isotropic in the plane per-pendicular to the local magnetic field (e.g., at 1350:55 UT), although such a feature was not continuously observed and the flux decreased below a detectable level (e.g., at 1350:43 UT). Ion density enhancement was observed by DS TC1 just after these perpendicular ion flows, implying that the expected region of high ion population expanded
out-ward to the DS TC1 location. From ∼1352 UT, DS TC1
observed isotropic and drastic enhancements of the elec-tron and ion fluxes at energies above∼0.5 keV, which con-tinued until 1400 UT for the rest of the plotted interval in Figures 9b–9e. We conclude that heating of particles was occurring in the inner magnetosphere just after the substorm onset and possibly generated the high‐population region of ions in the equatorward and tailward region of DS TC1.
[42] Accompanied by the ion density enhancement at
∼1351 UT, DS TC1 temporarily observed an enhancement of the magnetic wave or magnetic field fluctuations over a
broad frequency range of ∼1–200 Hz. Since such an
enhanced wave was not continuously observed during the
particle flux enhancement region from∼1352 UT, the wave
might not contribute to acceleration or heating of the observed high‐energy particles. The waves are perhaps enhanced at the boundary of the expected high‐population region of ions.
[43] Geomagnetic H‐bay was first observed at ground‐
based stations located at∼0500 MLT (SIM) at 1349 UT. At
nearly the same time, positive H‐bays were seen at ground stations at 0500–1000 MLTs. The D components at the stations of 0500–1000 MLTs started to decrease at ∼1350 UT in association with the H‐bays. On the other hand, at ∼0300 MLT station (HON), notable magnetic field variations
of the H and D components were not observed at∼1350 UT.
Furthermore, at ground stations at 2100–0200 MLTs, no pronounced magnetic field variations were observed 10 min before and after 1350 UT, although we investigated ground magnetic field data at other local times including nightside (not shown). From the ground magnetometer data, we speculate that FAST observed a downward field‐aligned current that was generated at substorm onset. On 25 July 2004, an intense negative Y component of IMF between −5 nT and −18 nT lasted 8.5 h from 0620 to 1450 UT. It
would appear that this large negative IMF By was related
to the dawnside onset of the substorm.
3.2. Generation Mechanism
[44] The pitch angle distributions of BBEs at the FAST altitude had isotropic features at high energies above ∼0.5 keV with an upward loss cone, while below ∼0.5 keV field‐aligned electron fluxes were most intense. These observations were consistent with the statistical character-istics of the pitch angle of BBEs reported by Nakajima et al. [2008].
[45] In this study, we compared electron features obtained
by FAST at an altitude of∼3800 km with those by DS TC1
at L =∼5.7. Footprints of FAST and DS TC1 were mapped
to similar latitudes and local times with differences of less than 5° and 1 h. We assumed that the electron acceleration or heating took place on a scale size larger than this dif-ference of satellite footprints from the riometer data.
[46] From ∼1352 UT, DS TC1 observed isotropic flux
enhancements of electrons at energies above∼0.5 keV. The higher‐energy electrons observed by DS TC1 appeared to be heated in the inner magnetosphere in association with the onset of a storm time substorm. The intense waves in the frequency range of 1–200 Hz associated with the electron flux enhancement may not contribute heating of the observed high‐energy electrons, because such enhanced waves were only temporarily observed at∼1352 UT. The field fluctuations of the other frequency range or global change of the geo-magnetic field configuration during the storm time substorm are likely to be the heating source of the higher‐energy electrons.
[47] Based on magnetic field data obtained by FAST and DS TC1, it was found that field‐aligned electrons at pitch angles less than∼10° at the DS TC1 altitude can reach the FAST altitude and extend to pitch angles between−90° and 90° by the mirror force. This result indicates a possibility that the field‐aligned components at the DS TC1 altitude were observed as the isotropic higher‐energy component of the BBEs at the FAST altitude.
[48] The field‐aligned electron fluxes were enhanced at energies of not only∼0.5–30 keV but also ∼0.03–0.5 keV at FAST during the BBE event. The lower‐energy field‐
aligned electrons below∼0.5 keV of BBEs were not
iden-tified in the DS TC1 electron data. As a possible generation mechanisms for the field‐aligned low‐energy electrons, we speculate that they could be accelerated in field‐aligned directions between the FAST and DS TC1 altitudes. A possible acceleration source for the lower‐energy BBEs is electron interaction with Alfvén waves. Chaston et al. [2002] simulated Alfvén wave propagation in the auroral oval to understand field and electron observations by FAST. In their study, the simulation successfully reproduced the observed electron distribution with an enhancement of parallel com-ponent over an energy range of 0.1–2 keV at altitudes where Alfvén wave electron acceleration occurs. Using FAST data, Mende et al. [2003] reported an event of intense field‐ aligned electron fluxes at suprathermal energies, which were probably accelerated by Alfvén waves, one minute after substorm onset. The intense field‐aligned electron fluxes
over energies of∼0.03–1 keV during the BBE event
iden-tified in our study are similar to the electron distributions reported by Chaston et al. [2002] and Mende et al. [2003]. The BBEs were observed shortly after substorm onset, as in the case of Mende et al. [2003]. Alfvén waves generated during the substorm may contribute to the acceleration of the lower‐energy BBEs.
[49] Secondary electrons generated by precipitating elec-trons are the other possible source for the lower‐energy BBEs. Evans [1974] and Pulliam et al. [1981] showed that low‐energy secondary electrons generated in the atmosphere can be backscattered by an upward field‐aligned potential difference to form the low‐energy part of auroral electron spectra. Evans [1974] showed that a majority of high‐energy
66° ILATs, ∼0600 MLT, and an altitude of ∼3800 km at
1355–1359 UT during the main phase of a large storm on
25 July 2004. DS TC1 and GOES 10 were located at ∼0600 MLT in the inner plasma sheet at L = 5.7 and 6.6, respectively. The observations and conclusions in this paper are summarized as follows.
[52] 1. GOES 10 observed the first signature of the
expansion phase noting the onset of substorm as a
dipolar-ization at ∼1347 UT. Two minutes later, ground magnetic
field data showed that positive and negative H‐bays formed at∼1349 UT at ∼0500–1000 MLTs. These facts indicate that substorms during the storm took place just before the BBE event. Perpendicular tailward ion flux was observed by DS
TC1 at L = 5.7 from∼1350 UT for ∼1 min. Then, DS TC1
observed a local dipolarization and ion density enhancement at∼1351 UT. The ion density enhancement lasted until after 1400 UT with isotropically enhanced electron and ion fluxes at energies above∼0.5 keV. We suggest that particle heating is occurring in the inner magnetosphere near DS TC1 associated with the onset of storm time substorm.
[53] 2. The footprints of FAST and DS TC1 were mapped
to similar latitudes with differences of less than 5° and local
time separation of ∼1 h during the BBEs. We compared
electron features observed at different altitudes using FAST and DS TC1 data on the assumption that BBEs were occur-ring over a spatial extent that included both of the satellite footprints. Electron flux enhancement at energies above ∼0.5 keV from 1351 UT was observed by DS TC1. At FAST, electron fluxes were isotropic at higher energies
above ∼0.5 keV with an upward loss cone. On the other
hand, at lower energies below ∼0.5 keV, field‐aligned
electron fluxes were most intense. The field‐aligned enhanced electrons at DS TC1 were probably observed as
the isotropic higher‐energy component of the BBEs at
FAST due to the mirror force. The field‐aligned lower‐ energy component of the BBEs at FAST might be accel-erated in field‐aligned directions through wave‐particle interactions between the FAST and DS TC1 altitudes. From these results, we speculate that the BBEs consist of the two‐ energy components due to acceleration or heating of elec-trons at different altitudes in association with the onset of storm time substorm.
[54] Acknowledgments. We thank Y. Asano at the Tokyo Institute of Technology for providing the PEACE data plot and helpful suggestions and T. Hori from Nagoya University for helpful discussions and suggestions.
the Japan Society for the Promotion of Science.
[55] Amitava Bhattacharjee thanks the reviewers for their assistance in evaluating this paper.
References
Baumjohann, W., G. Paschmann, and C. A. Cattell (1989), Average plasma properties in the central plasma sheet, J. Geophys. Res., 94, 6597–6606. Baumjohann, W., Y. Kamide, and R. Nakamura (1996), Substorms, storms,
and the near‐Earth tail, J. Geomagn. Geoelectr., 48, 177–185. Baumjohann, W., M. Hesse, S. Kokubun, T. Mukai, T. Nagai, and A. A.
Petrukovich (1999), Substorm dipolarization and recovery, J. Geophys. Res., 104, 24,995–25,000.
Bryant, D. A., D. S. Hall, and D. R. Lepine (1978), Electron acceleration in an array of auroral arcs, Planet. Space Sci., 26, 81–92.
Carlson, C. W., R. F. Pfaff, and J. G. Watzin (1998), The Fast Auroral SnapshoT (FAST) mission, Geophys. Res. Lett., 25, 2013–2016. Carlson, C. W., J. P. McFadden, P. Turin, D. W. Curtis, and A. Magoncelli
(2001), The electrons and ion plasma experiment for FAST, Space Sci. Rev., 98, 33–66.
Carr, C., et al. (2005), The Double Star magnetic field investigation: Instrument design, performance and highlights of the first year’s observa-tions, Ann. Geophys., 23, 2713–2732.
Chaston, C. C., J. W. Bonnell, L. M. Peticolas, C. W. Carlson, J. P. McFadden, and R. E. Ergun (2002), Driven Alfvén waves and electron acceleration: A FAST case study, Geophys. Res. Lett., 29(11), 1535, doi:10.1029/ 2001GL013842.
Cornilleau‐Wehrlin, N., et al. (2005), The STAFF‐DWP wave instrument on the DSP equatorial spacecraft: Description and first result, Ann. Geophys., 23, 2785–2801.
Denig, W. F., and F. J. Rich (1986), The ionosphere‐magnetosphere struc-ture during a geomagnetic storm based on measurements in the morning auroral zone, J. Geophys. Res., 91, 165–182.
Dombeck, J., C. Cattell, J. R. Wygant, A. Keiling, and J. Scudder (2005), Alfvén waves and Poynting flux observed simultaneously by Polar and FAST in the plasma sheet boundary layer, J. Geophys. Res., 110, A12S90, doi:10.1029/2005JA011269.
Egeland, A., W. J. Burke, N. C. Maynard, E. M. Basinska, J. D. Winningham, and C. S. Deehr (1994), Ground and satellite observations of postdawn auro-rae near the time of a sudden storm commencement, J. Geophys. Res., 99, 2095–2108.
Elphic, R. C., J. D. Means, R. C. Snare, R. J. Strangeway, L. Kepko, and R. E. Ergun (2001), Magnetic field instruments for the Fast Auroral Snap-shot explorer, Space Sci. Rev., 98, 151–168.
Evans, D. S. (1974), Precipitating electron fluxes formed by a magnetic field aligned potential difference, J. Geophys. Res., 79, 2853–2858. Fazakerley, A. N., et al. (2005), The Double Star Plasma Electron and
Current Experiment, Ann. Geophys., 23, 2733–2756.
Frank, L. A., and K. L. Ackerson (1971), Observations of charged particle precipitation into the auroral zone, J. Geophys. Res., 76, 3612–3643. Liu, Z. X., C. P. Escoubet, Z. Pu, H. Laakso, J. K. Shi, C. Shen, and
M. Hapgood (2005), The Double Star mission, Ann. Geophys., 23, 2707–2712.
Lui, A. T. Y., D. Venkatesan, C. D. Anger, S.‐I. Akasofu, W. J. Heikkila, J. D. Winningham, and J. R. Burrows (1977), Simultaneous observations of particle precipitations and auroral emissions by the ISIS 2 satellite in the 19–24 MLT sector, J. Geophys. Res., 82, 2210–2226.
McEwen, D. J., C. N. Duncan, and R. Montalbetti (1981), Auroral electron energies: Comparisons of in situ measurements with spectroscopically inferred energies, Can. J. Phys., 59, 1116–1123.
Mende, S. B., C. W. Carlson, H. U. Fray, L. M. Peticolas, and N. stgaard (2003), FAST and IMAGE‐FUV observations of a substorm onset, J. Geophys. Res., 108(A9), 1344, doi:10.1029/2002JA009787. Miyashita, Y., S. Machida, T. Mukai, Y. Saito, K. Tsuruda, H. Hayakawa,
and P. R. Sutcliffe (2000), A statistical study of variations in the near and middistant magnetotail associated with substorm onsets: Geotail observa-tions, J. Geophys. Res., 105, 15,913–15,930.
Miyashita, Y., S. Machida, K. Liou, T. Mukai, Y. Saito, H. Hayakawa, C.‐I. Meng, and G. K. Parks (2003), Evolution of the magnetotail asso-ciated with substorm auroral breakups, J. Geophys. Res., 108(A9), 1353, doi:10.1029/2003JA009939.
Miyashita, Y., et al. (2005), Geotail observations of signatures in the near‐ Earth magnetotail for the extremely intense substorms of the 30 October 2 0 0 3 s t o r m , J . G e o p h y s . R e s . , 1 1 0 , A 0 9 S 2 5 , d o i : 1 0 . 1 0 2 9 / 2005JA011070.
Nagai, T., M. Fujimoto, Y. Saito, S. Machida, T. Terasawa, R. Nakamura, T. Yamamoto, T. Mukai, A. Nishida, and S. Kokubun (1998), Structure and dynamics of magnetic reconnection for substorm onsets with Geotail observations, J. Geophys. Res., 103, 4419–4440.
Nakajima, A., K. Shiokawa, K. Seki, R. J. Strangeway, J. P. McFadden, and C. W. Carlson (2007), Particle and field characteristics of broadband electrons observed by the FAST satellite during a geomagnetic storm, J. Geophys. Res., 112, A06220, doi:10.1029/2006JA012184. Nakajima, A., K. Shiokawa, K. Seki, J. P. McFadden, C. W. Carlson,
R. J. Strangeway, and K. Yumoto (2008), Particle and field characteris-tics of broadband electrons observed by the FAST satellite during geo-magnetic storms: A multievent study, J. Geophys. Res., 113, A06221, doi:10.1029/2007JA013001.
Ohtani, S., A. T. Y. Lui, K. Takahashi, D. G. Mitchell, and T. Sarris (2000), Ion dynamics and tail current intensification prior to dipolarization: The June 1, 1985, event, J. Geophys. Res., 105, 25,233–25,246.
Pulliam, D. M., H. R. Anderson, K. Stamnes, and M. H. Rees (1981), Auroral electron acceleration and atmospheric interactions: (1) Rocket‐borne observations and (2) scattering calculations, J. Geophys. Res., 86, 2397–2404.
Rème, H., et al. (2005), The HIA instrument on board the Tan Ce 1 Double Star near‐equatorial spacecraft and its first results, Ann. Geophys., 23, 2757–2774.
Schödel, R., K. Diershke, W. Baumjohann, R. Nakamura, and T. Mukai (2002), The storm time central plasma sheet, Ann. Geophys., 20, 1737–1741.
Sharber, J. R., R. A. Frahm, R. Link, G. Crowley, J. D. Winningham, E. E. Gaines, R. W. Nightingale, D. L. Chenette, B. J. Anderson, and C. A. Gurgiolo (1998), UARS particle environment monitor observations during the November 1993 storm: Auroral morphology, spectral charac-terization, and energy deposition, J. Geophys. Res., 103, 26,307–26,322. Shiokawa, K., K. Yumoto, C.‐I. Meng, and G. Reeves (1996), Broadband electrons observed by the DMSP satellites during storm time substorms, Geophys. Res. Lett., 23, 2529–2532.
Shiokawa, K., C.‐I. Meng, G. D. Reeves, F. J. Rich, and K. Yumoto (1997), A multievent study of broadband electrons observed by the DMSP satellites and their relation to red aurora observed at midlatitude stations, J. Geophys. Res., 102, 14,237–14,253.
Shiokawa, K., R. R. Anderson, I. A. Daglis, W. J. Hughes, and J. R. Wygant (1999), Simultaneous DMSP and CRRES observation of broadband elec-trons during a storm‐time substorm on March 25, 1991, Phys. Chem. Earth, 24, 281–285.
Takada, T., R. Nakamura, W. Baumjohann, Y. Asano, M. Volwerk, T. L. Zhang, B. Klecker, H. Rème, E. A. Lucek, and C. Carr (2006), Do BBFs contribute to inner magnetosphere dipolarizations: Concurrent Cluster and Double Star observations, Geophys. Res. Lett., 33, L21109, doi:10.1029/2006GL027440.
Tsyganenko, N. A. (1995), Modeling the Earth’s magnetospheric magnetic field confined within a realistic magnetopause, J. Geophys. Res., 100, 5599–5612.
Tsyganenko, N. A. (1996), Effects of the solar wind conditions on the global magnetospheric configuration as deduced from data‐based field models, in Third International Conference on Substorms (ICS‐3), Versailles, France, 12–17 May 1996, edited by E. Rolfe and B. Kaldeich, Eur. Space Agency Spec. Publ., ESA SP‐389, 181–185.
W. Baumjohann and R. Nakamura, Space Research Institute, Austrian Academy of Sciences, Schmiedlstr. 6, A‐8042 Graz, Austria. (baumjohann@ oeaw.ac.at; rumi@oeaw.ac.at)
C. W. Carlson and J. P. McFadden, Space Sciences Laboratory, University of California, 7 Gauss Way, Berkeley, CA 94720‐7450, USA. (cwc@apollo.ssl.berkeley.edu; mcfadden@apollo.ssl.berkeley.edu)
N. Cornilleau‐Wehrlin and O. Le Contel, Laboratoire de Physique des Plasmas, Ecole Polytechnique, UPMC, CNRS, F‐91128 Palaiseau CEDEX, France. (nicole.cornilleau@lpp.polytechnique.fr; olivier.lecontel@lpp. polytechnique.fr)
I. Dandouras and H. Rème, Centre d’Etude Spatiale des Rayonnements, Toulouse University, CNRS, BP 44346, 9 Ave. du Colonel Roche, F‐31028 Toulouse CEDEX, France. (iannis.dandouras@cesr.fr; henri.reme@cesr.fr)
A. N. Fazakerley, Mullard Space Science Laboratory, University College London, Dorking RH5 6NT, UK. (anf@mssl.ucl.ac.uk)
K. Keika, Center for Solar‐Terrestrial Research, New Jersey Institute of Technology, 323 Martin Luther King Jr. Blvd., Newark, NJ 07102‐1982, USA. (keika@adm.njit.edu)
A. Nakajima, K. Seki, and K. Shiokawa, Solar‐Terrestrial Environment Laboratory, Nagoya University, Furo‐cho, Chikusa‐ku, Nagoya, Aichi 464‐8601, Japan. (akimitsu@stelab.nagoya‐u.ac.jp; seki@stelab.nagoya‐ u.ac.jp; shiokawa@stelab.nagoya‐u.ac.jp)
R. J. Strangeway, Institute of Geophysics and Planetary Physics, University of California, 405 Hilgard Ave., Los Angeles, CA 90024‐ 1567, USA. (strange@igpp.ucla.edu)
T. Takada, Institute of Space and Astronautical Science, JAXA, Yoshinodai 3‐1‐1, Sagamihara, Kanagawa 229‐8510, Japan. (takada@ stp.isas.jaxa.jp)
K. H. Yearby, Department of ACSE, University of Sheffield, Mappin Street, Sheffield S1 3JD, UK. (h.h.yearby@sheffield.ac.uk)