The hidden side of the Allee effect: correlated demographic traits and extinction risk in experimental populations
15
0
0
Texte intégral
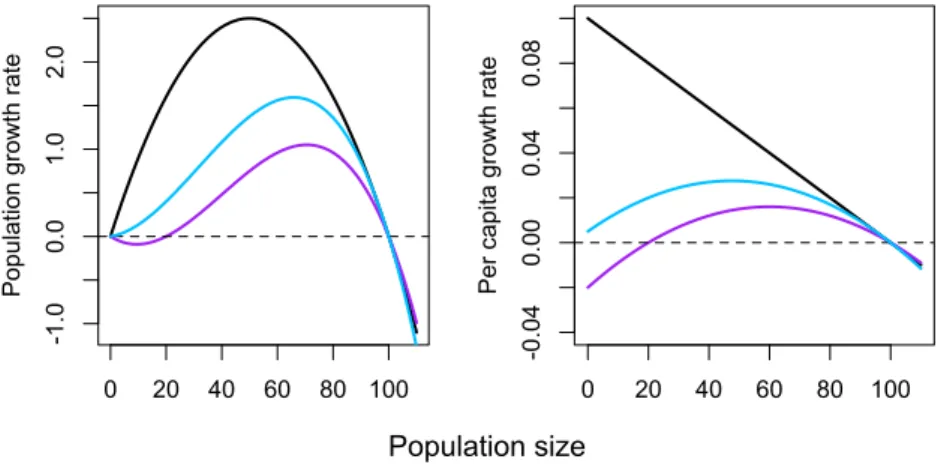
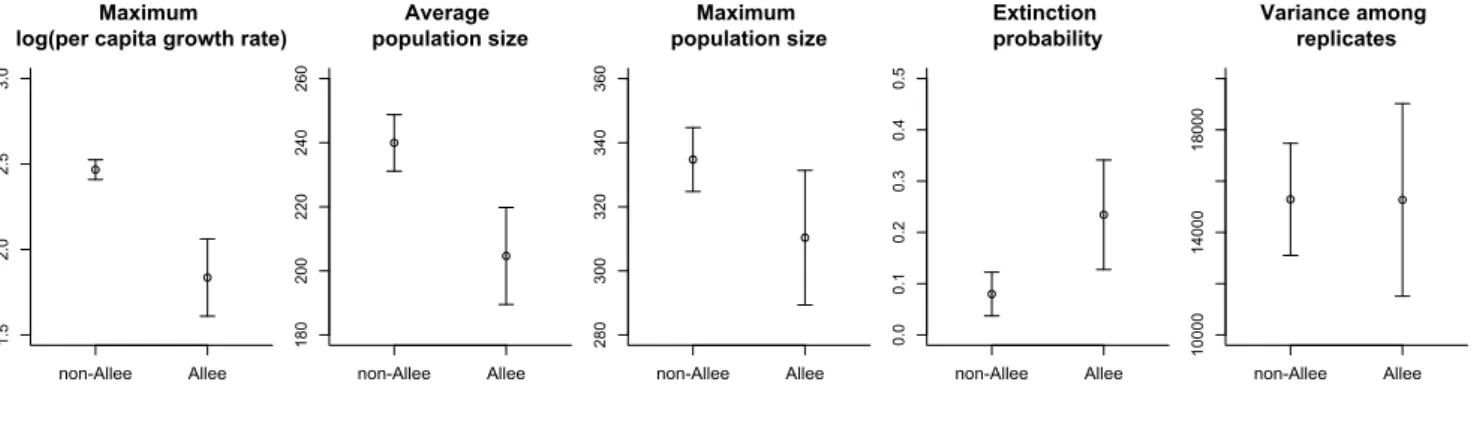
Figure

Documents relatifs