HAL Id: hal-00296159
https://hal.archives-ouvertes.fr/hal-00296159
Submitted on 22 Feb 2007
HAL is a multi-disciplinary open access
archive for the deposit and dissemination of
sci-entific research documents, whether they are
pub-lished or not. The documents may come from
teaching and research institutions in France or
abroad, or from public or private research centers.
L’archive ouverte pluridisciplinaire HAL, est
destinée au dépôt et à la diffusion de documents
scientifiques de niveau recherche, publiés ou non,
émanant des établissements d’enseignement et de
recherche français ou étrangers, des laboratoires
publics ou privés.
Asian mineral dust
R. C. Sullivan, S. A. Guazzotti, D. A. Sodeman, K. A. Prather
To cite this version:
R. C. Sullivan, S. A. Guazzotti, D. A. Sodeman, K. A. Prather. Direct observations of the atmospheric
processing of Asian mineral dust. Atmospheric Chemistry and Physics, European Geosciences Union,
2007, 7 (5), pp.1213-1236. �hal-00296159�
www.atmos-chem-phys.net/7/1213/2007/ © Author(s) 2007. This work is licensed under a Creative Commons License.
Chemistry
and Physics
Direct observations of the atmospheric processing of Asian
mineral dust
R. C. Sullivan1, S. A. Guazzotti1,*, D. A. Sodeman1,**, and K. A. Prather1,2
1Department of Chemistry & Biochemistry, University of California, San Diego, La Jolla, CA 92093-0314, USA
2Scripps Institution of Oceanography, University of California, San Diego, La Jolla, CA 92093, USA
*now at: Nanostream, Inc., 580 Sierra Madre Villa, Pasadena, CA 91107, USA
**now at: Desert Research Institute, Reno, NV 89512, USA
Received: 6 March 2006 – Published in Atmos. Chem. Phys. Discuss.: 23 May 2006 Revised: 6 February 2007 – Accepted: 9 February 2007 – Published: 22 February 2007
Abstract. The accumulation of secondary acids and
am-monium on individual mineral dust particles during ACE-Asia has been measured with an online single-particle mass spectrometer, the ATOFMS. Changes in the amounts of sul-phate, nitrate, and chloride mixed with dust particles cor-relate with air masses from different source regions. The uptake of secondary acids depended on the individual dust particle mineralogy; high amounts of nitrate accumulated on calcium-rich dust while high amounts of sulphate accumu-lated on aluminosilicate-rich dust. Oxidation of S(IV) to S(VI) by iron in the aluminosilicate dust is a possible expla-nation for this enrichment of sulphate, which has important consequences for the fertilization of remote oceans by solu-ble iron. This study shows the segregation of sulphate from nitrate and chloride in individual aged dust particles for the first time. A transport and aging timeline provides an expla-nation for the observed segregation. Our data suggests that sulphate became mixed with the dust first. This implies that the transport pathway is more important than the reaction ki-netics in determining which species accumulate on mineral dust. Early in the study, dust particles in volcanically influ-enced air masses were mixed predominately with sulphate. Dust mixed with chloride then dominated over sulphate and nitrate when a major dust front reached the R. V. Ronald Brown. We hypothesize that the rapid increase in chloride on dust was due to mixing with HCl(g) released from acidi-fied sea salt particles induced by heterogeneous reaction with volcanic SO2(g), prior to the arrival of the dust front. The
amount of ammonium mixed with dust correlated strongly with the total amount of secondary acid reaction products in the dust. Submicron dust and ammonium sulphate were internally mixed, contrary to frequent reports that they ex-ist as external mixtures. The size dex-istribution of the mixing
Correspondence to: K. Prather
(kprather@ucsd.edu)
state of dust with these secondary species validates previ-ous mechanisms of the atmospheric processing of dust and generally agrees with simulated aerosol chemistry from the STEM-2K3 model. This series of novel results has important implications for improving the treatment of dust in global chemistry models and highlights a number of key processes that merit further investigation through laboratory and field studies.
1 Introduction
Major dust storm events typically develop in China in the spring, brought about by cold frontal systems and the Mon-golian cyclonic depression (Sun et al., 2001). The Gobi Deserts in Mongolia and northern China, and the Taklimakan Desert in western China, are the two dominant source regions of dust in east Asia. Once lofted to high altitudes, dust can then become entrained in the jet stream and may be trans-ported long distances over the Pacific Ocean to North Amer-ica (Cahill, 2003; Duce et al., 1980; Jaffe et al., 1999; Thu-lasiraman et al., 2002). The Asian Pacific Regional Aerosol Characterization Experiment (ACE-Asia) in 2001 was de-signed to study the impact these spring dust events have on the physical, chemical and radiative properties of the Asian aerosol as it is transported over the mainland and the Pacific Ocean (Huebert et al., 2003; Seinfeld et al., 2004).
Mineral dust represents the second largest component of primary particle emissions by mass, with an estimated global source strength of 1000 to 3000 Mt/yr (Ginoux et al., 2001; Houghton et al., 2001). Laboratory studies have
demonstrated the uptake of reactive gases including O3
(Chang et al., 2005; Hanisch and Crowley, 2003b;
Sul-livan et al., 2004; Usher et al., 2003b), NOx (Grassian,
N2O5)(Al-Hosney and Grassian, 2005; Hanisch and
Crow-ley, 2001; Karagulian and Rossi, 2005; Krueger et al., 2004; Santschi and Rossi, 2006; Seisel et al., 2005; Underwood et al., 2001; Vlasenko et al., 2006), SO2(Ullerstam et al.,
2003), and organics (Al-Hosney et al., 2005; Carlos-Cuellar et al., 2003) on dust particles (Usher et al., 2003a). Dust particles present a large surface area for heterogeneous re-actions to occur on, and alter radiative transfer and rates of photolysis. Thus dust influences the chemical composition of the troposphere, as demonstrated by numerous field and modeling studies (Bauer et al., 2004; Bian and Zender, 2003; de Reus et al., 2000; Dentener et al., 1996; Seinfeld et al., 2004; Tang et al., 2004a). Mineral dust particles can become internally mixed with secondary species such as ammonium sulphate, ammonium nitrate, hydrochloric acid, sea salt, and biomass burning particles through coagulation, cloud pro-cessing, and heterogeneous reactions (Andreae et al., 1986; Clarke et al., 2004; Guazzotti et al., 2001a; Korhonen et al., 2003; Mamane and Gottlieb, 1989; Mori et al., 1998; Song and Carmichael, 1999; Yin et al., 2002; Zhang and Iwasaka, 2004; Zhang et al., 2003). These processes modify the chem-ical composition of the dust-laden aerosol and this can alter the radiative properties of the dust aerosol. The addition of water-soluble secondary species to a dust particle can affect its ability to act as a cloud or ice nucleus and thus influences the indirect climate forcing of dust (Cziczo et al., 2004; De-Mott et al., 2003; Gibson et al., 2006; Levin et al., 1996; Levin et al., 2005; Matsumoto et al., 2006; Perry et al., 2004; Rudich et al., 2002; Yin et al., 2002). Mineral dust parti-cles have been observed to increase cloudiness by produc-ing more but smaller droplets, with potential reductions in precipitation (Kaufman et al., 2005; Rosenfeld et al., 2001). Photochemical processes and the uptake of secondary acids and organics can also increase the solubility and bioavailabil-ity of iron in dust particles, which is an important pathway for the fertilization of remote oceans with subsequent climate impacts (Bishop et al., 2002; Jickells et al., 2005; Meskhidze et al., 2003). Mineral dust mixed with nitrate is also an im-portant vector for nitrogen fertilization of oceans (Baker et al., 2003; Prospero and Savoie, 1989).
Asian mineral dust particles at their original source loca-tion are primarily composed of mixtures of quartz, clays, mi-cas, feldspars, carbonates (primarily calcite, CaCO3), and
other minor minerals (Gao and Anderson, 2001; Honda et al., 2004; Pye, 1987; Trochkine et al., 2003; Usher et al.,
2003a; Yuan et al., 2004). The mineralogy of PM10collected
during severe Asian dust events in 2000 and 2002 in Bei-jing was determined by Shi et al. (2005) to be primarily clay minerals (>40%), followed by noncrystalline materials and quartz (both around 19%), with smaller amounts of calcite, plagioclase, K-feldspar, pyrite and other trace minerals. Sur-face measurements made in Beijing by Matsuki et al. (2005a) classified 28% of the Asian dust particles as calcite. The high carbonate fraction of Chinese dust is significant and this al-kaline mineral has been shown to react readily with acidic
species such as HNO3to form Ca(NO3)2and liberate CO2(g)
(Hanisch and Crowley, 2001; Johnson et al., 2005; Kelly and Wexler, 2005; Krueger et al., 2004; Laskin et al., 2005; Mat-suki et al., 2005b; Song and Carmichael, 2001).
In April 2001, a major dust storm event transported highly elevated levels of dust particles to the various ground, ship, and aircraft sampling platforms during ACE-Asia. The prin-cipal source regions of the dust during these events were the Taklimakan desert in Xinjiang Province, China and the desert regions in Mongolia, including the Gobi desert (Gong et al., 2003). Previous analyses of the dust storm aerosol produced a number of interesting and unique results. As the mineral dust aerosol was transported over China, Korea, and Japan to the ocean, it became mixed with anthropogenic, volcanic, and natural aerosols and aerosol precursor gases. When sam-pled onboard the R/V Ronald H. Brown in the Sea of Japan, the resulting aerosol was a complex mixture of mineral dust, organic carbon, elemental carbon, sulphates, nitrates, ammo-nium, and sea salt (Arimoto et al., 2006; Bates et al., 2004; Seinfeld et al., 2004). Results obtained with an aerosol time-of-flight mass spectrometer (ATOFMS) revealed that prior to the dust front, the majority of supermicron particulate-nitrate was internally mixed with aged sea salt particles. After the dust front, the particulate-nitrate was found to be predomi-nantly internally mixed with mineral dust particles (Arimoto et al., 2006; Bates et al., 2004; Tang et al., 2004b). ATOFMS results further demonstrated the significant uptake of chlo-rine by mineral dust particles during the dust event (Sullivan et al., 20061).
The results presented here further investigate the chemi-cal aging of the mineral dust particles as mixing occurs with trace gases, and natural and anthropogenic aerosols. Our analysis provides new insights into the competitive uptake of different secondary acids by mineral dust and the role that the varying mineralogy of dust plays in these processes, pro-cesses that are now being incorporated into chemical models (Krueger et al., 2004; Laskin et al., 2005; Matsuki et al., 2005a, b; Tang et al., 2004b).
2 Methods and instrumentation
A transportable aerosol time-of-flight mass spectrometer (ATOFMS) located on the R/V Ronald H. Brown (RHB) was used to characterize the size and chemical composition of individual particles in real-time during the ACE-Asia cam-paign. The RHB left Hawaii on 16 March 2001 (DOY 75) and spent 10 days in transit to Japan. From DOY 90–99 the RHB circled around the southern end of Japan and into the Sea of Japan. On DOY 99 the RHB turned around and headed south out of the Sea of Japan through the Straits
1Sullivan, R. C., Guazzotti, S. A., Sodeman, D. A., Tang, Y. H.,
Carmichael, G. R., and Prather, K. A.: Mineral dust is a sink for chlorine in the marine boundary layer, Atmos. Environ., submitted, 2006.
of Korea, finally docking at Yokosuka, Japan on DOY 110. More details on the RHB’s cruise track and the air masses it sampled are available in Bates et al. (2004).
The aerosol sampled by the ATOFMS was drawn through a 6 m sample mast from ∼18 m above sea level. The bottom 1.5 m of the mast was heated to maintain the relative humid-ity of the aerosol at 55±5%. Air was only sampled when the relative wind speed and direction, and concentrations of particles larger than 15 nm indicated that the sampled air was free of local contamination (Bates et al., 2004).
The design and operation of the ATOFMS is described in detail elsewhere (Gard et al., 1997) and only a brief descrip-tion is given here. The ATOFMS draws the aerosol sam-ple through a converging nozzle into a differentially pumped vacuum chamber, accelerating each particle to its terminal velocity. The velocity of each particle is determined by the time-of-flight between two CW lasers. This velocity is
con-verted to an aerodynamic diameter (Da)using a calibration
curve generated with polystyrene latex spheres of discrete diameters. The particle’s velocity also triggers the firing of a frequency-quadrupled Nd:YAG laser (266 nm) that desorbs and ionizes chemicals from each sized particle. A dual reflec-tron TOFMS records the mass spectra of the resulting posi-tive and negaposi-tive ions simultaneously. The ATOFMS em-ployed during ACE-Asia was capable of efficiently detecting
particles between Da0.2 and 3.0 µm.
A wide variety of mineral dust samples from Asian desert regions were collected in 2001. Mass spectra from each dust sample were obtained after the campaign by placing each dust sample into a flask in a sonicator to create a suspension of dust particles under nitrogen gas flow. The aerosol was then directed into the ATOFMS inlet for analysis and at least 2400 single-particle mass spectra were collected per sample. Analysis of the single-particle mass spectra was performed using the Matlab® based toolkit YAADA (http://www.yaada. org) to perform searches for particular mass spectral features within the dataset. An adaptive resonance theory-based neu-ral network algorithm, ART-2a, was used to group the data into clusters of particles with similar mass spectral features, using a vigilance factor of 0.80 (Song et al., 1999). Measure-ments made by the ATOFMS have previously been used to monitor heterogeneous reactions occurring on sea-salt, min-eral dust, and secondary organic aerosols, as well as in cloud droplets, in real-time (Angelino et al., 2001; Bates et al.,
2004; Gard et al., 1998; Sullivan and Prather, 20051; Tang
et al., 2004b; Whiteaker and Prather, 2003). 2.1 Filtering criteria
The mineral dust particles classified by the ART-2a algo-rithm were further filtered to remove incorrectly classified biomass-burning particles and internal mixtures of dust and sea salt. As dust particles are transported through the tropo-sphere they can become internally mixed with other particle types such as sea salt, particularly via cloud processing if the
0 10 20 30 40 50 60 70 80 90 100 110 120 130 140 0 0.2 0.4 0.6 0.8 1 F ra ct io n o f P a rt ic le s 0 10 20 30 40 50 60 70 80 90 100 110 120 130 140 0 0.2 0.4 0.6 0.8 1 Mass-to-Charge Ratio F ra c ti o n o f P a rt ic le s 250 < Area < 500 500 < Area < 1000 1000 < Area < 2000 2000 < Area < 5000 5000 < Area < 10000 10000 < Area < 15000 15000 < Area < 20000 20000 < Area < 25000 25000 < Area < 35000 Area > 35000 Na+Al+ Li+ K+ 40Ca+ 54Fe+ CaO+/56Fe+ TiO+ (CaO)2H+ 44Ca+ Ca2O+ NH4+ OH -CN -Cl -CNO -NO2- SiO 2 -NO3 -SiO3 -Si2O2 -HSO4 -AlSiO4 -HSi2O5 -S
-–
+
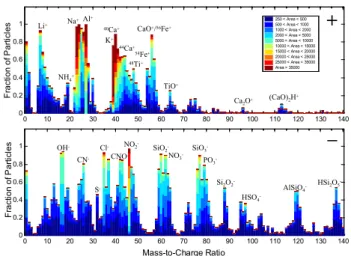
48Ti+ PO3-Fig. 1. Atmospherically processed mineral dust. Average digital
mass spectrum of all 3634 filtered mineral dust particles detected during the dust front’s passage over the RHB from DOY 101–101.3. Peaks are assigned to the most likely ions for dust particles (Ta-ble 1). The digital mass spectrum displays the fraction of particles that produced a peak area for each ion within a specified range. It reflects the range and homogeneity in the ion signal produced for a particular ion by an ensemble of particles.
dust aerosol passes through a cloudy region. The fraction of mineral dust particles internally mixed with sea salt has been reported to be as high as 85% after transport through marine regions (Andreae et al., 1986; Fan et al., 1996; Niimura et al., 1998; Zhang et al., 2003). To focus only on the mixing of secondary acid products with mineral dust particles, the contributions of chloride, nitrate, and sulphate from internal mixing of dust with sea salt were excluded by removing dust
particles containing the 81[Na235Cl]+ ion. The Appendix
provides further details on the filtering criteria. The ensem-ble of dust particles filtered to exclude biomass and mixtures with sea salt, are referred to herein as “filtered mineral dust particles”.
3 Results and discussion
3.1 Mineral dust mass spectra
A total of 731 309 single-particle mass spectra were collected over the course of the campaign. Out of all of these particles, 220 806 were classified as mineral dust upon sorting the par-ticles into chemically similar groups using the ART-2a clus-tering algorithm (Song et al., 1999). The assignment as dust is based on similarities to source dust mass spectra discussed below, as well as those presented in Silva et al. (2000) and Guazzotti et al. (2001a). The average mass spectrum for fil-tered mineral dust particles detected during the dust storm frontal passage (DOY 100.8–101.3) is shown in Fig. 1. The height of each peak indicates the fraction of particles for
Table 1. Ion assignments for commonly observed peaks from
min-eral dust particles and secondary species.
Mass-to-charge ratio Most probable ion assignment Mineral dust +7 Li+ +23 Na+ +24 Mg+ +27 Al+ +39 39K+ +40 Ca+ +41 41K+or [Na(H2O)]+ +48 Ti+ +54 54Fe+ +56 56Fe+or [CaO]+ +64 [TiO]+ +96 [Ca2O]+ +112 [(CaO)2] +113 [(CaO)2H] −16 O− −17 [OH]− −26 [CN]− −42 [CNO]− −43 [AlO]− −60 [AlO(OH)]−or [SiO2]− −63 [PO2]−
−76 [AlO2(OH)]−or [28SiO3]−
−77 [29SiO3]−or [H28SiO3]− −79 [PO3]− −88 [Si2O2] or [FeO2] Secondary species +18* [NH4]+ +30 NO+ −32 S− −35* 35Cl− −37 37Cl− −46 [NO2]− −48 [SO]− −62* [NO3]− −64 [SO2]− −80 [SO3]− −97* [HSO4]−
* indicates the principle ions used to measure ammonium, chloride, nitrate, or sulphate in mineral dust particles
which each ion was detected, while the colour corresponds to the peak area range measured for that fraction of parti-cles. Metals and metal oxides from minerals typical of dust particles are clearly evident in both the positive and negative ion spectra and their peak assignments are listed in Table 1, based on previous ATOFMS measurements (Guazzotti et al., 2001a, b; Pastor et al., 2003; Silva et al., 2000). The ART-2a sorting algorithm split the dust particles into 23 particle
clusters out of the 60 largest clusters, further evidence for the wide range of dust mineralogy at the single particle level. These Asian dust particles represent a complex mixture of numerous different minerals, as reported by previous studies (Andronova et al., 1993; Clarke et al., 2004; Gao and Ander-son, 2001; Krueger et al., 2004; Pye, 1987; Trochkine et al., 2003; Yuan et al., 2004).
The large fraction (>80%) of particles containing cal-cium marker ions (m/z +40, +56, +96) agrees with the high calcium carbonate fraction typical of Asian mineral
dust (Jeong and Chun, 2006). Krueger et al. (2004)
re-ported the chemical composition of China Loess determined by EDX to be 39% Ca, 31% Si, 13% Mg, 7% Al, 4%
Na, 3% Fe, and 1% K (atomic percent). Ca was
deter-mined to be mostly from carbonate minerals including calcite (CaCO3)and dolomite (CaMg(CO3)2). The fraction of
car-bonate in Asian dust has been reported to range from 1–12% by mass (Andronova et al., 1993; Derbyshire et al., 1998; Honda et al., 2004; Nishikawa et al., 2000). The carbon-ate anion, CO3−2, generally occurs in low abundance in the
mass spectrum and is obscured by the more abundant
iso-bars [SiO2]− and [AlO2H]− at m/z −60 in mineral
parti-cles. Thus, carbonate from calcite and dolomite cannot be
directly determined using m/z −60. The presence of CaCO3
can be reliably inferred from Ca-containing cations includ-ing40Ca+,56[CaO]+,96[Ca2O]+, and113[(CaO)2H]+. The
56[CaO]+cation is likely formed via [CaCO
3]+→[CaO]++
CO2(Bruynseels and Van Grieken, 1983).
The mass spectra contain ions corresponding to ammo-nium, chloride, nitrate, or sulphate ions referred to as “sec-ondary species”. The principal ions used throughout this paper to study each of these four secondary species are in-dicated by an asterisk (*) in Table 1. These peaks provide evidence of the accumulation of secondary species by min-eral dust, as discussed below. Some of these species could be present in the dust at the source as minerals such as
halite (NaCl) and gypsum (CaSO4). Falkovich et al. (2001)
found sulphate (not from gypsum) in Saharan dust particles which they determined was not due to atmospheric process-ing. Thus, they concluded that other sources of sulphate such as deposition by rain or runoff added sulphate to the dust’s surface. These processes could also be adding sulphate to the Asian dust described herein. As shown later, the ambi-ent aged dust particles had very large ion signals and tempo-ral variations for sulphate, indicating that the vast majority of the sulphate accumulated on the dust during atmospheric transport.
Asian dust samples from various source regions were col-lected during ACE-Asia and analyzed using an ATOFMS to create reference spectra of unprocessed mineral dust. The mass spectra of source dust particles from regions such as Zhenbettai (Shaanxi Province, China), Dunhuang (Gansu Province, China), and the CJ13 Certified Reference Asian Mineral Dust (Gansu Province, China) (Nishikawa et al., 2000) were collected (not shown) and compared to those
of ambient mineral dust sampled during ACE-Asia. These represent likely sources of the mineral dust particles car-ried aloft from mainland China to the Sea of Japan during ACE-Asia (Gong et al., 2003). Similarities between mineral cations and anions for both source and ambient dust particles, as listed in Table 1, are readily apparent. However, when compared to the ambient dust spectra, the source dust par-ticles have much lower frequencies and ion intensities from the secondary species ammonium, chloride, nitrate, and sul-phate. Typical ranges of peak areas for secondary species measured in the source and aged dust are given in Appendix A. Thus, the source dust spectra provide a benchmark for the very low background amounts of these secondary species in Asian dust, a threshold above which peak areas and detection frequencies can serve as indications of atmospheric process-ing durprocess-ing transport.
3.2 Campaign timeline and air mass history
Over the course of the campaign, the RHB sampled air ar-riving from a wide variety of source regions, as identified by Bates et al. (2004). We use time periods corresponding to the same source regions herein. Mineral dust particles were com-monly detected during the pre-frontal Marine and Polluted Korea & Japan periods in low concentrations. From DOY 99.3–100.5 (UTC) the RHB sampled air that had passed over the Miyakejima volcano and Japan and a distinct dust layer was observed at an altitude of 5 km (Polluted Volcano pe-riod). A major dust storm reached the RHB on DOY 100.8 in the western Sea of Japan (Dust Front period). Upper level trajectories were from the north China/Mongolia desert re-gion, while low-level trajectories extended across Korea and China. The passage of the front brought elevated levels of dust to the ship. The sub-10 µm dust concentrations reached
140 µg m−3 on DOY 102. From DOY 100 to 104 mineral
dust composed 8–31% of submicron and up to 80% of super-micron mass (Arimoto et al., 2006). Dust continued to dom-inate the aerosol behind the front. From DOY 101.8–103.4, both upper and lower level trajectories crossed Korea and north China/Mongolia (Dust & Korea period). From DOY 103.4–104.5 the RHB was in the Korean Strait and sampling air that came out of north China/Mongolia and had passed over Shanghai (Dust & Shanghai period).
3.3 Detection of secondary inorganic species in dust
parti-cles
Nitrate, sulphate, and chloride were the most commonly ob-served anions in the mineral dust and correspond to the prod-ucts expected from mineral dust particles that have mixed with secondary acids, as well as acid anhydrides including N2O5, SO2, NOx, etc. Although the exact mechanism that
leads to the accumulation of these secondary species cannot be determined from this study, the presence of chloride, ni-trate, and sulphate on dust is most likely due to the
forma-tion of hydrochloric, nitric, and sulphuric acids on the dust. This could be the result of reactive gases (e.g. SO2, NO2)
adsorbing on the dust and then being oxidised to their acidic forms, or from the direct uptake of acidic gases (e.g. HCl,
HNO3, H2SO4) or their ammonium salts (e.g. NH4NO3,
(NH4)2SO4). After the acids formed/adsorbed on the dust,
they can be fully or partially neutralised by alkaline species in the dust (e.g CaCO3)or by alkaline gases (e.g. NH3). The
ions formed from these secondary species by the ATOFMS cannot directly indicate if the species are acidic (i.e. proto-nated) or not. Therefore, we will refer to them as “secondary acid products” or simply “secondary acids” throughout our discussion, indicating that the chloride, nitrate, and sulphate found on the dust were most likely initially due to the for-mation/accumulation of secondary acids on the dust. The products of secondary species that reacted with mineral dust and other particle types are evaluated using the ions listed in Table 1. For this analysis chloride, nitrate, and sulphate were primarily determined using peaks at m/z −35, −62,
and −97, respectively. The peak at 62[NO3]− is used
in-stead of the46[NO2]−nitrate fragment because m/z −62 is
not detected in the Asian dust source spectra. Thus, by using
m/z −62 to detect nitrate in dust, we preclude any significant
contribution from nitrate (or nitrite) that is already present in the dust before it is injected into the atmosphere. Recall that mixed dust-sea salt particles have been filtered out of the analysis.
The average mass spectrum for filtered mineral dust par-ticles detected during the dust storm frontal passage (DOY 100.8–101.3) is shown in Fig. 1. Peaks typical of mineral dust particles discussed above and listed in Table 1 are clearly evident, and a large increase is observed in the fraction of particles producing ions indicative of secondary acid prod-ucts including m/z +30, −35, −46, −62, −80, and −97. These peaks were not significant in the source dust spectra. Changes in the relative amounts of four secondary inorganic species in the mineral dust particles are evaluated by aver-aging the peak area ratio for each species from all filtered dust particles detected in one hour, as shown in Fig. 2 for DOY 98–105, encompassing the prefrontal and postfrontal time periods. The peak area for a particular m/z is divided by that particle’s peak area at m/z 27 (Al+)to account for shot-to-shot variations in the LDI laser power and the amount of laser energy absorbed by each particle. The peak area ra-tio is evaluated for each individual particle before the hourly average is calculated. Al was chosen as an internal standard because it is the most commonly detected species in mineral dust by ATOFMS and has been shown to remain stable as a function of particle size during atmospheric transport (Ari-moto et al., 2006; Guazzotti et al., 2001a; Mori et al., 2003; Silva et al., 2000). The relative sensitivities of the ATOFMS to different compounds in mineral dust and other matrices have not been thoroughly evaluated. If, however, the parti-cle matrix is not changing significantly, as is the case for the Asian mineral dust particles discussed in this paper, then it is
98 99 100 101 102 103 104 105 0.00 0.05 0.10 0.15 0.20 0.25 0.30 0.35 0.40
0.45 Polluted-JapanVolcano-Polluted Dust Front Dust-Korea Dust-Shanghai
H o u rl y Pe a k Are a R a ti o DOY NH 4 / Al Cl / Al NO 3 / Al HSO4 / Al 0 200 400 600 800 1000 AT O F MS H o u rl y F ilt e re d D u st C o u n ts
Fig. 2. Temporal evolution of secondary species in Asian
min-eral dust sampled aboard the RHB. Hourly averaged single-particle peak area ratios (lines) from all filtered dust parti-cles for four major secondary species: NH+4 (m/z=18/m/z=27), Cl− (m/z=−35/m/z=27), NO−3 (m/z=−62/m/z=27), and HSO−4 (m/z=−97/m/z=27). Total hourly ATOFMS dust particle counts (bars) are also displayed. Time periods corresponding to different air mass source regions as described by Bates et al. (2004) are indi-cated. All times are in UTC.
valid to compare the intensity of a particular peak from one particle to another and draw conclusions about the relative amounts of that specific species present in each particle.
3.4 Temporal evolution of secondary species in Asian dust
The principal peak area ratios for four major secondary species, ammonium, chloride, nitrate, and sulphate are plot-ted in Fig. 2. Gaps in the data occurred when aerosol sam-pling was suspended due to instrument maintenance or when the aerosol inlet was shut off during ship exhaust
contam-ination periods. The total hourly ATOFMS dust particle
counts are also displayed and indicate when the first dust front reached the RHB on DOY 100.8. To estimate the frac-tion of mineral dust particles internally mixed with chloride, nitrate, or sulphate, a peak area criterion >5000 units for ei-ther 35Cl−, 62[NO3]− or 97[HSO4]− was used to define a
mineral dust particle as significantly mixed with one of these secondary species. This subset will be referred to as “reacted dust particles”. This peak area criterion was chosen because it is much larger than peak areas for these ions in the original Asian source dust and ensures that only mineral dust par-ticles that have become significantly aged during transport will be selected. The mass fraction of each acid correspond-ing to a peak area of 5000 has not yet been determined and is the subject of ongoing laboratory studies. This peak area is relatively large (see Appendix) and thus these results rep-resent a conservative estimate of the degree to which mineral dust particles were processed and mixed with nitrate, chlo-ride, and/or sulphate. Figure 3 shows the results of this
clas-98 99 100 101 102 103 104 105 0.0 0.1 0.2 0.3 0.4 0.5 0.6 0.7
Fraction of Dust Mixed
DOY Nitrate-Dust Sulphate-Dust Chloride-Dust 0 200 400 600 800 1000 (a)
Hourly ATOFMS Filtered Dust Counts
0 100 200 300 400 500 600 700 800 900 0 50 100 150 200 250 300 350 400 (b) Chloride-Dust: y = 0.305x - 17.3, R2 = 0.757 Nitrate-Dust: y = 0.258x + 1.56, R2 = 0.812 Sulphate-Dust: y = 0.0718x + 12.6, R2 = 0.331 H o u rl y Mi xe d D u st C o u n ts
Total Hourly ATOFMS Filtered Dust Counts
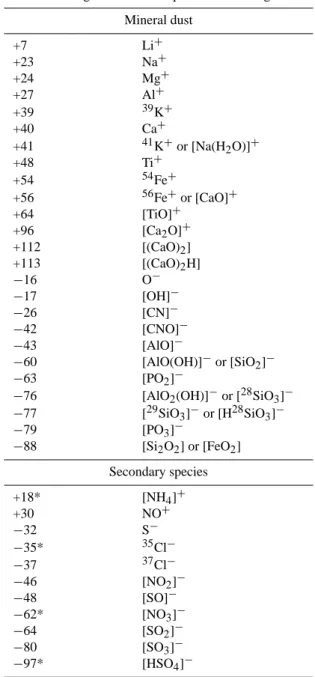
Fig. 3. Percentage of dust particles mixed with secondary acids. (a) Average hourly fraction (lines) of filtered dust particles defined
as mixed with the indicated secondary acid product using the peak area >5000 criteria for35Cl−,62[NO3]−or97[HSO4]−. The total
filtered dust particle hourly counts are also displayed for reference (bars). (b) Scatter plot of the hourly counts of dust mixed with one of the three secondary acid products versus the total hourly ATOFMS dust counts, and their least-squares fits.
sification for the prefrontal and postfrontal periods. From DOY 98–105, the average (±1σ ) fractions of dust particles mixed with nitrate, sulphate, or chloride were 25.9±9.6%, 17.5±8.5%, and 18.4±10.5%, respectively.
The fraction of dust particles classified as mixed with each of the four secondary species is shown for each time period in Fig. 4. The hatched portion of the column indicates the fraction of dust particles that contained both a secondary acid product (e.g. nitrate) and ammonium. These mixing state statistics differ from the preliminary results presented in Arimoto et al. (2006). In that paper, the same criteria were used, but dust mixed with sea salt was not excluded from the analysis in order to present a picture of the fraction of dust mixed with acid products regardless of their source. Here
we exclude dust internally mixed with sea salt to focus only on the role of secondary species produced in the atmosphere through chemical reactions.
Previous analyses of Asian mineral dust particles near their source show they typically have low concentrations of nitrate, sulphate and chloride (Andronova et al., 1993; Ari-moto et al., 2004; Matsuki et al., 2005a; Mori et al., 2003; Nishikawa et al., 1991; Trochkine et al., 2003; Yuan et al., 2004; Zhang and Iwasaka, 1999). Thus, we conclude that these mineral dust particles accumulated secondary acids as they were transported from the desert regions over the pol-luted mainland and marine regions to the RHB, by either direct heterogeneous uptake, cloud processing, or coagula-tion with other secondary-containing aerosols such as ammo-nium nitrate/sulphate particles. From DOY 98 to 105, a sub-stantial, though highly variable fraction of mineral dust was mixed with the secondary species chloride, nitrate, or sul-phate (Figs. 3 and 4). Just before the dust front, from DOY 100–100.8, there were elevated levels of both sulphate and ammonium corresponding to the Polluted Volcano air mass. From approximately DOY 100.8–102, the relative amount of chloride in the mineral dust increased dramatically, coincid-ing with the arrival of the dust front, while the amount of ammonium simultaneously decreased. The amount of nitrate and ammonium both increased noticeably from DOY 102– 103.5. Dividing the peak areas of these species by a sta-ble dust component, aluminium, provides further evidence for a secondary source of these four species. If these com-pounds were present in the dust particles at the source, we would expect their peak area ratios to remain constant as long as the dust source regions were not changing over short time periods. Clear temporal changes in the relative amounts of the secondary species associated with the dust are evi-dent. Similar changes were also observed for these same species in the bulk mass concentration measurements of the dust-impacted air masses reported by Bates et al. (2004) and Quinn et al. (2004).
The presence of chloride in dust not due to mixtures with sea salt has only recently been reported (Zhang and Iwasaka, 2001). A very large increase in the chloride area ratio in dust (Fig. 2) was observed during the dust front’s arrival, along with an increase in the total chloride mass concentra-tion by a factor of nine (Arimoto et al., 2006; Bates et al., 2004). As discussed in detail by Sullivan et al. (2006)1, the availability of HCl(g) for reaction with the mineral dust was likely strongly influenced by the release of SO2(g) from the
nearby Miyakejima volcano. The sea salt particles in the pre-frontal air mass were highly aged and resulted in a depletion of 77±12% of the total chloride in the sea salt (Bates et al., 2004; Sullivan et al., 2006)1. Thus, there were likely ele-vated levels of HCl(g) in the marine boundary layer just prior to the dust front’s arrival. This liberated HCl(g) then mixed with the incoming dust front as it subsided while there were depleted levels of HNO3(g) and SO2/H2SO4(g), due to their
prior reaction with sea salt, permitting substantial chloride
Nitrate SulphateChloride
Ammonium Nitrate & ChlorideNitrate & Sulphate
Chloride & Sulphate Nitrate
SulphateChloride Ammonium Nitrate & ChlorideNitrate & Sulphate
Chloride & Sulphate Nitrate
SulphateChloride Ammonium Nitrate & ChlorideNitrate & Sulphate
Chloride & Sulphate Nitrate
SulphateChloride Ammonium Nitrate & ChlorideNitrate & Sulphate
Chloride & Sulphate Nitrate
SulphateChloride Ammonium Nitrate & ChlorideNitrate & Sulphate
Chloride & Sulphate
0.00 0.05 0.10 0.15 0.20 0.25 0.30 0.35 0.40
Dust & Shang Dust & Korea
Dust Front Volc Poll
Poll Japan
Fraction of Dust Particles
Ammonium
Fig. 4. Fractions of mineral dust particles internally mixed with
ma-jor secondary inorganic species in different air masses. A peak area >5000 was used to define dust particles as mixed with chloride, ni-trate, and sulphate, and a peak area >1000 for ammonium. Dust particles mixed with sea salt have been excluded. The hatched por-tion of the column represents the fracpor-tion of dust particles mixed with a particular secondary acid that also contained ammonium (peak area >1000).
uptake onto the mineral dust. Figures 2 and 3 clearly show an increase in the amount of chloride in dust and a simultaneous decrease in the amount of nitrate and sulphate in dust during the Dust Front period. Had nitrate and/or sulphate formed on the dust particles during the dust front, this would have dis-placed much of the chloride to the gas-phase, or prevented its uptake in the first place. Thus, we hypothesize that the significant uptake of chloride by dust during the dust front
occurred due to both the reduced mixing ratios of NOyand
SOx, caused by their prior reaction with sea salt in the
pre-frontal air mass, and the subsequent release of HCl(g) from the highly aged sea salt particles (Sullivan et al., 2006)1.
In Fig. 3b the hourly counts of dust mixed with one of the secondary species are plotted versus the total hourly dust counts measured by ATOFMS. Sulphate-dust has a very weak dependence on the total dust counts while nitrate-dust and chloride-dust have much stronger correlations over the DOY 98–105 time period. Thus, the mixing of dust with sulphate does not appear to be controlled by the total dust concentrations available, while the number of dust particles mixed with nitrate or chloride increases with increasing to-tal dust concentrations. An explanation for this behaviour is that sulphate becomes preferentially mixed with dust. This could be the result of dust reacting with SO2/H2SO4more
ef-ficiently, and/or because the dust plume encounters elevated sulphate precursors before encountering nitrate and chloride precursors. If dust mixes with sulphate first and becomes acidified then, in general, nitrate and chloride will only be able to become significantly mixed with dust if there is an
0 10000 20000 30000 40000 0 10000 20000 30000 40000 C h lo ri d e Pe a k Are a (m/ z = -3 5 )
Sulphate Peak Area (m/z = -97)
0 10000 20000 30000 40000 0 10000 20000 30000 40000 C h lo ri d e Pe a k Are a (m/ z = -3 5 )
Nitrate Peak Area (m/z = -62)
0 10000 20000 30000 40000 0 10000 20000 30000 40000 Su lp h a te Pe a k Are a (m/ z = -9 7 )
Nitrate Peak Area (m/z = -62)
0.0 0.2 0.4 0.6 0.8 1.0 0.0 0.2 0.4 0.6 0.8 1.0 0.0 0.2 0.4 0.6 0.8 1.0 100% Cl -100% NO3 -100% HSO4 -Ammonium Peak Area Ch lori de Pe ak Are a (m/ z = -35 ) Sulp ha te Pe ak Are a (m/ z = -9 7)
Nitrate Peak Area (m/z = -62) 100.0 250.0 500.0 1000 2500 5000
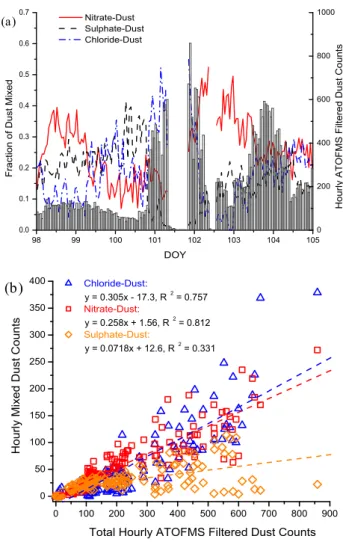
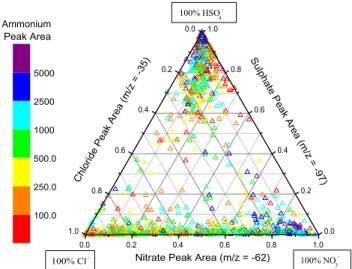
Fig. 5a. The ternary plot (top) shows the relative distribution of peak areas for secondary chloride, nitrate, and sulphate in filtered mineral
dust particles defined as “mixed” with either of the three acid products and detected during the Dust Front period (DOY 101–101.3). Each point is produced from a single dust particle’s mass spectrum, 1768 in total are plotted. The symbol colour corresponds to the absolute peak area of ammonium for each dust particle. The scatter plots (below) for pairs of secondary acid products are taken from the same data set and show the same trends as the ternary plot but on an absolute peak area scale.
abundance of additional, mostly unreacted dust surface area available for reaction with nitrate and chloride precursors. There would therefore be a dependence on total dust load-ings for nitrate- and chloride-dust, as shown in Fig. 3b. The degree to which the mineral dust becomes internally mixed with a particular acid is likely predominantly controlled by the history of the air mass.
3.5 Mixing state of secondary acids in mineral dust
Nitrate- and sulphate-dust together accounted for 13 754 par-ticles from DOY 98–105, yet only 142 (1.03%) of these dust particles satisfied the peak area >5000 criterion for both
62[NO
3]−and97[HSO4]−. Thus, significant amounts of both
nitrate and sulphate did not accumulate on the same min-eral dust particles. Similarly, only 98 out of 12 272 (0.80%) chloride-dust and sulphate-dust particles satisfied the peak area criteria for both35Cl−and97HSO4−, demonstrating that
secondary chloride and sulphate were also externally mixed
in the mineral dust. Nitrate and chloride, however, were present in the same mineral dust particles to a large extent; 14.8% of chloride-dust and nitrate-dust particles had peak areas >5000 for both35Cl−and62NO3−. Recall that dust
mixed with sea salt was excluded from this analysis and thus cannot account for this result. Further mixing state statis-tics for prefrontal and postfrontal air masses are provided in Fig. 4, demonstrating the very low fractions of dust particles that contained significant amounts of both sulphate and ni-trate or chloride in several different air masses.
The relative amounts of the three secondary species on all reacted dust particles during two time periods are shown in Fig. 5. In the ternary plot, a dust particle containing primar-ily sulphate would appear at the top vertex, primarprimar-ily nitrate at the right vertex, and primarily chloride at the left vertex. For both the Dust Front period (Fig. 5a) and the pre-frontal Polluted Volcano period (Fig. 5b), two broad groups of ticles are evident in the ternary plots. The majority of par-ticles lie along the bottom nitrate-chloride axis, indicating a
wide range of internal mixing between nitrate and chloride in individual dust particles. A smaller but still substantial group of particles is found at the top sulphate vertex, in-dicating that these dust particles contain primarily sulphate and relatively little nitrate or chloride. The lack of a signif-icant number of particles lying along the sulphate-chloride or sulphate-nitrate axes, or found in the centre of the ternary plot, further demonstrates that sulphate in aged mineral dust particles is externally mixed from both nitrate and chloride. This is true for dust particles that contain significant amounts of secondary acid products. Nitrate and sulphate are found in the same dust particle but with peak areas much lower than the 5000 threshold, representing less chemically aged dust. The colour of each point reflects that dust particle’s am-monium absolute peak area. The largest amam-monium signals were found in dust particles also containing nitrate or sul-phate while chloride-dust particles had lower but still signif-icant amounts of ammonium. The ternary plots of dust parti-cles detected during the Polluted Volcano and Dust Front pe-riods share these general features but there are more particles from the sulphate-only group in the Polluted Volcano period and more in the nitrate-chloride group during the Dust Front period. This agrees with the temporal changes displayed in Figs. 2 and 3 that show a larger fraction of sulphate-dust be-fore the dust front and a larger nitrate-dust and chloride-dust fraction during the dust storm. The PMEL filter mass mea-surements show similar temporal behaviour for these species (Bates et al., 2004).
This segregation of sulphate from nitrate and chloride is further demonstrated by the scatter plots (bottom) in Fig. 5a for the Dust Front period. The ternary plots show the relative partitioning of the absolute peak area signals for dust parti-cles between the three major secondary acid peaks (with eas >5000). The scatter plots, however, show the absolute ar-eas for a set of two secondary acids for the same set of reacted dust particles used to generate the ternary plot. The large number of particles found along either axis in the sulphate-nitrate and sulphate-chloride scatter plots agrees with the segregation of sulphate from nitrate and chloride shown in the ternary plot. The large number of particles found near the centre of the nitrate-chloride scatter plot, however, fur-ther supports the substantial and variable internal mixing of these two secondary acids in the mineral dust. The reduced number of particles around the origin is caused by the peak area >5000 criterion for35Cl−,62NO3−, or97HSO4−. Very
similar results were also found for the Polluted Volcano pe-riod (not shown).
3.6 Uptake of ammonia by acidified dust
In general, mineral dust shifts ammonia from the particle to gas phase by changing the aerosol from a cation- to anion-limited state due to the presence of alkaline species such as calcium carbonate (Song and Carmichael, 1999; Tang et al., 2004b). Mineral dust that has accumulated secondary
0.0 0.2 0.4 0.6 0.8 1.0 0.0 0.2 0.4 0.6 0.8 1.0 0.0 0.2 0.4 0.6 0.8 1.0 100% Cl- 100% NO3 -100% HSO4 -Ammonium Peak Area Ch lori de Pe ak Are a (m/ z = -35 ) Su lph a te Pe ak Are a (m/ z = -9 7)
Nitrate Peak Area (m/z = -62)
100.0 250.0 500.0 1000 2500 5000
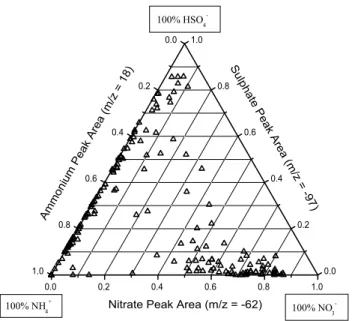
Fig. 5b. As for Fig. 5a above but for dust particles detected during
the Polluted Volcano period (DOY 99.3–100.5). Each point is pro-duced from a single dust particle’s mass spectrum, 1361 in total are plotted.
acids can be a sink for ammonia, as a result of either di-rect uptake from the gas-phase, coagulation with ammonium sulphate/nitrate-containing particles (Mori et al., 1998), or heterogeneous nucleation (Korhonen et al., 2003). The acid can be present after reacting with and neutralising the alka-line carbonates in the dust, or also by physisorption to the dust surface without chemical reaction. In the case of ph-ysisorption, ammonia can react with the acid on the surface without the prior consumption of alkalinity. The contribu-tions of both processes should be explored, though likely reaction with alkaline carbonates accelerates the uptake of acids over simple physisorption.
The presence of ammonium nitrate and/or ammonium sul-phate in individual mineral dust particles is demonstrated
in Fig. 6. The large cluster of particles lying along the
ammonium-sulphate axis on the left indicates the presence of ammonium sulphate in mineral dust particles, while the smaller cluster of particles along the bottom ammonium-nitrate axis represents ammonium ammonium-nitrate in dust. The fact that these particles appear primarily along one of these two axes indicates that the ammonium sulphate- or ammonium nitrate-dust particles do not also contain a significant nitrate or sulphate signal, respectively. This is expected based on the external mixing of nitrate and sulphate in dust presented above. The much larger spread in the ammonium sulphate dust particles along the ammonium-sulphate axis compared to the ammonium nitrate cluster may be due to the
vari-able NH4:SO4 molar ratio caused by partitioning between
(NH4)2SO4, NH4HSO4, and H2SO4.
Dust mixed with ammonium was queried using a peak area >1000 for18[NH4]+criterion. Further details on this
analy-sis are provided in the Appendix. Since a particle should first contain some acidic species in order for ammonia to
parti-0.0 0.2 0.4 0.6 0.8 1.0 0.0 0.2 0.4 0.6 0.8 1.0 0.0 0.2 0.4 0.6 0.8 1.0 100% NH 4 + 100% NO 3 -100% HSO 4 -Ammo niu m Pe ak Are a (m/ z = 18) Su lph a te Pe a k Are a (m/ z = -9 7 )
Nitrate Peak Area (m/z = -62)
Fig. 6. Relative distribution of absolute peak areas for nitrate,
sul-phate, and ammonium in nitrate-dust or sulphate-dust satisfying a peak area for m/z 18>1000, detected during the Polluted Volcano period. 364 dust particles are displayed.
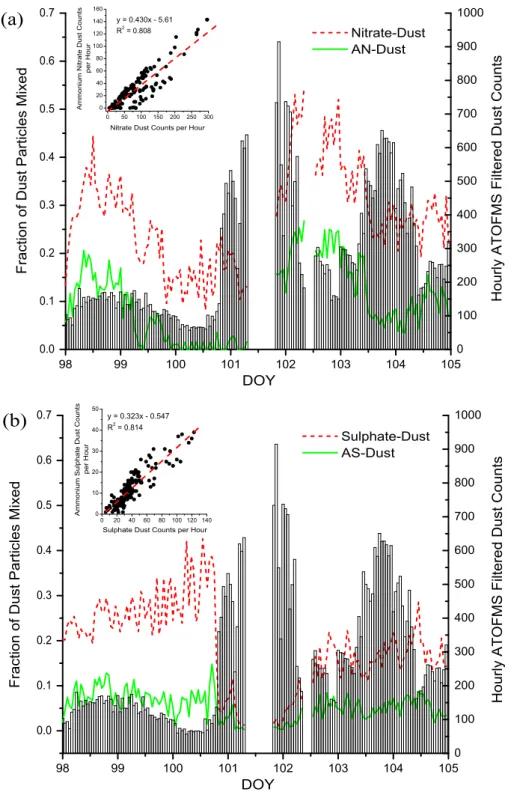
tion to it, we would predict that the number of dust particles that contained ammonium would increase when the number of particles containing nitrate or sulphate increased. This would also be true if the mixing of dust with ammonium was caused by coagulation with or heterogeneous nucleation by ammonium nitrate/sulphate particles. Figure 7 shows how the fraction of reacted dust particles that contained ammo-nium tracked the temporal changes in the fractions of dust particles mixed with either nitrate or sulphate. The linear correlations between the hourly counts of dust that contained ammonium nitrate/sulphate and those that were mixed with
nitrate/sulphate showed excellent agreement with R2=0.808
and 0.814, respectively (Fig. 7 insets). This is an impres-sive degree of correlation considering that these queries were performed on all reacted dust particles, regardless of miner-alogy, for seven days of ambient sampling which included several changes in the air mass source regions. The slopes of these correlations indicate the average fraction of nitrate-dust or sulphate-nitrate-dust particles which also contained ammo-nium over this time period were 43% and 32%, respectively. More detailed mixing state statistics for dust containing am-monium and secondary acids are given in Fig. 4.
We are not able to directly determine the degree to which available alkalinity in the dust has been neutralised by the secondary acids. However, we do find that ammonium was only in dust particles that also contained secondary acids in the form of nitrate, sulphate or, to a lesser extent, chloride (see Appendix for details). Taking the sum of the nitrate (m/z=−62/27) and sulphate (m/z=−97/27) hourly peak area ratios as a measure of the available acid in the dust and
plot-ting this versus ammonium (m/z=18/27) in Fig. 8 reveals a strong temporal trend between the amount of acid in the dust and the amount of ammonium, as expected. Note the strong anti-correlation of ammonium and the two other acids with chloride (m/z=−35/27) in the dust, particularly on DOY 101. However, on DOY 104 the peak area ratios for chloride, and the two acids all stabilize. The degree of correlation be-tween the hourly peak area ratios for nitrate + sulphate, and
ammonium has a R2=0.574.
In the troposphere, ammonium sulphate is the most sta-ble and thus preferred ammonium salt, followed by ammo-nium nitrate. Ammoammo-nium chloride, while the least preferred, is also a realistic ammonium salt in the troposphere. Dust containing ammonium chloride was detected during two dis-tinct time periods (DOY 108.88–102.38 and 103.0–105.0, see Appendix for details). Thus, the amount of ammonium in dust should track the amount of chloride, in addition to sulphate and nitrate on dust. This should be especially true when the stronger sulphuric and nitric acids are not avail-able to neutralise ammonia first, as was the case for the Dust Front period. If chloride is also included in the sum of the
peak area ratios (Fig. 8), the R2 is greatly improved from
0.574 to 0.881. This result was found despite the strong anti-correlation between the peak area ratio of chloride and am-monium. This could reflect the fact that ammonium chloride-dust was only detected in two periods and at low concentra-tions, the first of which occurred when both sulphate-dust and nitrate-dust were greatly reduced. Thus, by including chloride, this time period of ammonium mixed with dust that would not be explained by sulphate or nitrate was cap-tured. The overall anti-correlation of chloride and ammo-nium on dust may simply be a reflection of an anti-correlation
of HCl(g) and NH3(g) mixing ratios, as the two likely have
very different sources for this area. It does not necessarily reflect an inefficient process for ammonia to react with dust acidified by HCl.
The internal mixing of (NH4)2SO4, NH4NO3, and NH4Cl
with dust is a significant finding that has previously been re-ported from ATOFMS ambient measurements in Riverside, California (Noble and Prather, 1996), but not for dust storm
events. Heterogeneous nucleation of (NH4)2SO4 on dust
can produce ammonium sulphate coatings around dust and suppress the growth of ammonium sulphate particles to de-tectable sizes (Korhonen et al., 2003). Several researchers have frequently stated that ammonium sulphate measured in submicron particles during dust storms are due to ammonium sulphate particles externally mixed from dust (Jordan et al., 2003; Mori et al., 2003; Song et al., 2005; Tang et al., 2004b). We have clearly demonstrated that ammonium sulphate was internally mixed with dust particles during ACE-Asia, partic-ularly in the submicron dust (Fig. 6). Thus, the assumption of externally mixed ammonium sulphate and dust particles during ACE-Asia at sea level should be re-evaluated. In the future, single particle measurements can be used to unam-biguously determine the exact aerosol mixing state.
98 99 100 101 102 103 104 105 0.0 0.1 0.2 0.3 0.4 0.5 0.6 0.7 0 50 100 150 200 250 300 0 20 40 60 80 100 120 140 160 Ammo n iu m N it ra te D u st C o u n ts p e r H o u r
Nitrate Dust Counts per Hour
y = 0.430x - 5.61 R2 = 0.808
(a)
F ra ct io n o f D u st Pa rt icl e s Mi xe d DOY Nitrate-Dust AN-Dust 0 100 200 300 400 500 600 700 800 900 1000 H o u rl y AT O F MS F ilt e re d D u st C o u n ts 98 99 100 101 102 103 104 105 0.0 0.1 0.2 0.3 0.4 0.5 0.6 0.7 F ra ct io n o f D u st Pa rt icl e s Mi xe d DOY Sulphate-Dust AS-Dust 0 100 200 300 400 500 600 700 800 900 1000(b)
0 20 40 60 80 100 120 140 0 10 20 30 40 50 Ammo n iu m Su lp h a te D u st C o u n ts p e r H o u rSulphate Dust Counts per Hour
y = 0.323x - 0.547 R2 = 0.814 H o u rl y AT O F MS F ilt e re d D u st C o u n ts
Fig. 7. The fractions of filtered dust particles (lines) classified as mixed with (a) nitrate or ammonium nitrate (AN); (b) sulphate or
am-monium sulphate (AS); and the total hourly filtered dust counts (bars). Scatter plots (insets) show the correlation between hourly counts of nitrate/sulphate dust and ammonium nitrate/sulphate dust. The slope of the linear fit indicates the average hourly fraction of nitrate- or sulphate-dust that was also mixed with ammonium.
3.7 Effect of dust mineralogy on chemical processing
The role that dust particle mineralogy plays in its interac-tions with secondary acids and their precursors was
investi-gated by comparing dust particles with high amounts of Ca to dust with high amounts of Al. These types broadly repre-sent dust particles rich in calcite or aluminosilicates, respec-tively. This was achieved by searching within the filtered
0.0 0.1 0.2 0.3 0.4 0.5 0.0 0.1 0.2 0.3 0.4 0.5 y = -0.754x + 0.340 R2 = 0.545 C h lo ri d e Pe a k Are a R a ti o
Ammonium Peak Area Ratio
0.0 0.1 0.2 0.3 0.4 0.5 0.0 0.2 0.4 0.6 0.8 1.0 y = 1.74x + 0.219 R2 = 0.881 Aci d s Su m Pe a k Are a R a ti o
Ammonium Peak Area Ratio
98 99 100 101 102 103 104 105 0.00 0.05 0.10 0.15 0.20 0.25 0.30 0.35 0.40 0.45 0.50 0.55 NH 4 / Al (NO 3 / Al + HSO4 / Al) Cl / Al H o u rl y Pe a k Are a R a ti o DOY
Fig. 8. Correlation between ammonium and acids in dust. Top: Hourly peak area ratios for ammonium (18/27), chloride (−35/27) and the
sum of nitrate (−62/27) plus sulphate (−97/27) for all filtered dust particles from DOY 98–105. Bottom: Scatter plots of the correlation between ammonium and sum of chloride + nitrate + sulphate hourly peak area ratios for this time period (left), the hourly peak area ratios of chloride and ammonium (right), and the corresponding least-squares linear fits.
dust for particles with a relative peak area >10% for either
27Al+or 40Ca+. Together these two types of dust account for 55.2±5.7% of the total filtered dust counts. Clear dif-ferences between these two types of dust are shown in the temporal changes of the hourly peak area ratios for the three major secondary acid reaction products in Fig. 9. Most no-table is a large spike in the sulphate area ratio at DOY 100.5 in the high-Al dust that does not occur in the high-Ca dust. The sulphate peak area ratio also increases from DOY 103.5– 105 in the high-Al dust but remains mostly unchanged in the high-Ca dust. There are also noticeable differences in the in-creases in the chloride area ratio from DOY 101–102 for the
two types of dust. The majority of chloride uptake during the Dust Front period, beginning on DOY 100.8, took place on the high-Ca dust particles, suggesting reaction with calcite in the dust.
These results imply that sulphate is more strongly associ-ated with aluminosilicate-rich dust particles while nitrate and chloride are more associated with calcite-rich dust. Figure 10 provides further evidence for this mineralogy dependence. The ternary plot displays the relative distribution of three ma-jor dust mineral components: aluminium, calcium, and iron. The54Fe isotope was selected for iron to avoid interference
98 99 100 101 102 103 104 105 0.00 0.02 0.04 0.06 0.08 0.10 0.12 0.14 0.16 0.18 0.20 (a) H o u rl y Pe a k Are a R a ti o DOY Cl / Al NO 3 / Al HSO4/ Al 98 99 100 101 102 103 104 105 0.0 0.1 0.2 0.3 0.4 0.5 0.6 0.7 (b) H o u rl y Pe a k Are a R a ti o DOY Cl / Al NO3 / Al HSO4 / Al
Fig. 9. Hourly peak area ratios of the three major secondary acid
reaction products: chloride, nitrate and sulphate, for filtered dust particles with large ion signals for Al (a) or Ca (b).
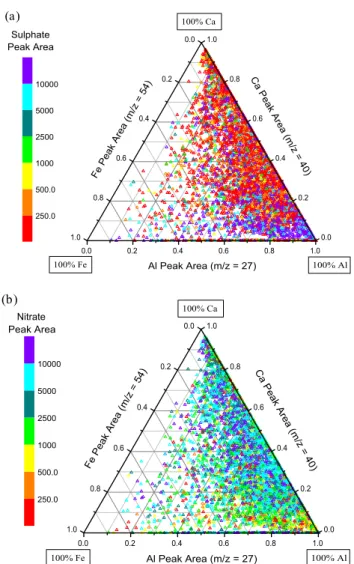
Dust & Shanghai period are displayed in both Figs. 10a and b. In Fig. 10a, the symbol colour corresponds to the sulphate absolute peak area while in Fig. 10b, the colour corresponds to the nitrate absolute peak area. Only dust particles con-taining relatively large amounts of nitrate or sulphate (peak area >5000) are displayed. These two figures show dramat-ically different mixing behaviour for nitrate versus sulphate and are virtually complete opposites of one and other. This reflects the segregation of large amounts of nitrate and sul-phate in dust particles, as discussed above. The sulsul-phate- sulphate-rich dust particles predominantly lie near the aluminium ver-tex and extend towards the iron verver-tex, indicating an asso-ciation with aluminosilicate-dust particles and their associ-ated enriched iron content (Jickells and Spokes, 2001). The nitrate-dust particles are mostly located towards the calcium vertex, being associated with calcite- and dolomite-rich dust. An analogous ternary plot using the chloride peak area (not shown) displays very similar behaviour to the nitrate ternary
0.0 0.2 0.4 0.6 0.8 1.0 0.0 0.2 0.4 0.6 0.8 1.0 0.0 0.2 0.4 0.6 0.8 1.0 (a) 100% Al 100% Fe 100% Ca Sulphate Peak Area Fe Peak Area (m/z = 54) Ca Peak Area (m/z = 40) Al Peak Area (m/z = 27) 250.0 500.0 1000 2500 5000 10000 0.0 0.2 0.4 0.6 0.8 1.0 0.0 0.2 0.4 0.6 0.8 1.0 0.0 0.2 0.4 0.6 0.8 1.0 (b) 100% Fe 100% Al 100% Ca Nitrate Peak Area Fe Peak Area (m/z = 54) Ca Peak Area (m/z = 40) Al Peak Area (m/z = 27) 250.0 500.0 1000 2500 5000 10000
Fig. 10. Relative distribution of peak areas for three major
min-eral components, Fe, Ca, and Al, for reacted dust particles detected during the Dust & Shanghai period. The same 5812 dust particles are displayed in both figures with the symbol colour corresponding to the sulphate absolute peak area (a), or the nitrate absolute peak area (b).
plot (Fig. 10b), with the largest chloride peak areas being found on Ca-rich dust particles, while Al-rich particles con-tain much lower chloride signals. The processes that cause this behaviour are discussed below.
The carbonate portion of Asian mineral dust is typically considered to be the principle component controlling the up-take of acidic vapours by dust due to its alkalinity (Song and Carmichael, 1999; Song and Carmichael, 2001; Tang
et al., 2004b). Both HNO3and HCl are mineral acids with
an acidic proton that can be readily neutralised upon
reac-tion with alkaline species such as carbonate. SO2however,
is an acid anhydride and does not contain acidic protons until it is hydrated and oxidized to S(VI). The strong association of nitrate and chloride with calcium-rich dust could be due
0.2 0.4 0.6 0.8 1.0 1.2 1.4 1.6 1.8 2.0 2.2 2.4 2.6 2.8 3.0 0.00 0.05 0.10 0.15 0.20 0.25 0.30 0.35 0.40 0.45 NH4 / Al HSO4 / Al NO3 / Al Cl / Al Ave ra g e Pe a k Are a R a ti o s
Aerodynamic Diameter (microns)
0 1000 2000 3000 4000 5000 6000 (a) AT O F MS F ilt e re d D u st C o u n ts 0.2 0.4 0.6 0.8 1.0 1.2 1.4 1.6 1.8 2.0 2.2 2.4 2.6 2.8 3.0 0.00 0.05 0.10 0.15 0.20 0.25 0.30 0.35 0.40 0.45 (b)
Fraction of Dust Particles Mixed
Aerodynamic Diameter (microns)
Ammonium-Dust Sulphate-Dust Nitrate-Dust Chloride-Dust 0 1000 2000 3000 4000 5000 6000
ATOFMS Filtered Dust Counts
Fig. 11. Size distributions of secondary species in mineral dust
par-ticles. (a) Average single-particle peak area ratios (lines) for four major secondary species from all filtered dust particles detected from DOY 98–105. (b) Fraction of filtered dust particles (lines) classified as mixed with one of the four major secondary species. The size distribution of the set of particles used to generate both figures is also displayed (columns) and reflects the inlet efficiency of the ATOFMS, and not the actual size distribution of the aerosol population.
with carbonates through simple acid-base chemistry. SO2,
not initially containing any acidic protons, is unable to react with calcium carbonates in this direct manner. This would explain why sulphate is not enriched in calcium-rich dust. Since our data suggest that sulphate accumulates in the dust first, it appears sulphate will react with the mineral compo-nent for which it has the highest affinity. We propose that the association of sulphate with Al- and Fe-rich dust is due to the iron-catalyzed oxidation of SO2to H2SO4(Brandt and
Vaneldik, 1995; Qi et al., 2006; Rani et al., 1992; Yermakov and Purmal, 2003). The majority of the oxidation by this process is thought to occur in the aqueous phase containing dissolved metal ions (i.e. a homogeneous reaction), but the
role of surface-catalyzed heterogeneous reactions involving metals may also play an important role (Brandt and Vaneldik, 1995; Rani et al., 1992). The solubility of the metal ions is a key factor controlled by the aerosol’s pH and the presence of organic compounds that could chelate the metals. The solu-bility of iron in dust aerosols is an important but poorly un-derstood factor at present (Jickells et al., 2005; Luo et al., 2005). The rate of this reaction is accelerated at higher pH and thus this sulphate formation pathway is self-quenching. The alkaline nature of Asian mineral dust could enhance the role of iron in the oxidation of sulphur by buffering the pH and increasing this pathway’s reaction rate compared to other
major pathways such as oxidation by H2O2. Relativity
hu-midity has been found to be an important factor for the up-take of acids by dust in both lab and recent field studies (Al-Hosney and Grassian, 2005; Goodman et al., 2001; Krueger et al., 2003; Laskin et al., 2005; Matsuki et al., 2005b; Uller-stam et al., 2002), however our data set does not allow us to directly investigate this important issue.
3.8 Mechanism of secondary acid uptake: size dependence
The distribution of secondary species as a function of dust particle size provides important insights into the mechanisms for the accumulation of acids in dust. The mechanism that is outlined here is based on that of Bassett and Seinfeld (1984) and Song and Carmichael (1999). In general, the accumulation of sulphate by particles through reaction with SO2/H2SO4 is diffusion limited. Thus, it occurs
preferen-tially in the particle size mode with the greatest surface area,
which is typically the accumulation mode (Da=0.1–1.0 µm).
As sulphuric acid is essentially non-volatile and a stronger acid than both nitric or hydrochloric acid, the accumulation of sulphuric acid in a particle will prevent additional uptake of HCl, HNO3, NO2, etc. These gases will instead react with
the less-acidic supermicron dust that represents a larger al-kaline sink by mass for these acids. The accumulation of sulphuric acid in submicron dust will also displace any pre-existing nitrate or chloride back to the gas-phase as these are weaker acids and more volatile than H2SO4. Nitric acid and
hydrochloric acid in the gas-phase can then re-partition to su-permicron dust particles that have not already been acidified (Song and Carmichael, 2001). Thus, the irreversible uptake of SO2and H2SO4is kinetically limited while the uptake of
the more-volatile HCl and HNO3is thermodynamically
con-trolled. Therefore, sulphate will accumulate in submicron dust while nitrate and chloride will accumulate in supermi-cron dust particles. The uptake of ammonia is typically de-termined by the preceding SO2/H2SO4uptake, and thus
am-monium predominantly accumulates in submicron dust. Evidence for this uptake mechanism occurring in the aged mineral dust detected during ACE-Asia is presented by the distribution of the peak area ratios for these secondary species as a function of particle size in Fig. 11a. The aver-age peak area ratios for sulphate and ammonium clearly peak
in the submicron filtered dust particles. Nitrate and chloride both peak in the supermicron dust particle mode. Despite the high loading of supermicron dust during the dust front, the largest aerosol surface area mode was still in the accumula-tion mode (Bates et al., 2004; Quinn et al., 2004). Similar results are shown in Fig. 11b, this time plotting the fraction of filtered dust particles previously classified as mixed with chloride, nitrate, sulphate (peak area >5000), or ammonium (peak area >1000) as a function of size. Again, sulphate-dust peaks in the submicron mode while nitrate- and chloride-dust peak in the supermicron. Ammonium-dust has two modes, the largest in the submicron mode along with sulphate-dust and a smaller one in the supermicron mode along with ni-trate and chloride-dust. Taken together, these size plots in-dicate that ammonium accumulates in both the submicron sulphate-dust and the supermicron nitrate/chloride-dust, but the relative amount of ammonium per dust particle is greater in the submicron sulphate-dust mode.
The results suggest that the submicron dust particles were very acidic due to mixing with sulphuric acid early during transport. This prevented the substantial mixing of nitrate and chloride in the submicron dust particles when the dust
plume later encountered elevated NOyand HCl. This also
suggests that there was not enough ammonia to neutralise all of the sulphuric acid in the dust. The bulk mass con-centration of ammonium was relatively constant from DOY 98–105 while that of nitrate and sulphate varied significantly and were elevated in the post-frontal dust air masses, exceed-ing ammonium (Bates et al., 2004). The internal mixexceed-ing of nitrate and chloride (Fig. 5) is a result of the greater alka-line mass in the supermicron dust that can neutralize both acids and allow them to exist internally mixed to some de-gree in the same dust particle. The volatile nature of these two inorganic species allows them both to be displaced to the gas-phase, if displacement is occurring, and then re-partition back to the supermicron dust particles where they are less volatile.
Similar size-distributions of secondary species in Asian mineral dust have been reported previously from the analysis of collected filter samples and in modeling studies (Bates et al., 2004; Mori et al., 2003; Nishikawa et al., 1991; Ooki and Uematsu, 2005; Tang et al., 2004b; Wu and Okada, 1994; Zhang et al., 2000). However, our results are the first to show the size distribution of secondary species exclusively for individual aged mineral dust particles. We also have the ability to exclude the influence of internally mixed dust and sea salt particles. The 0.10 µm size resolution provided by the ATOFMS measurements is another significant advantage over filter-based methods. Together these factors result in a unique and important set of results that directly confirm aerosol model predictions of mineral dust aging mechanisms.
3.9 Segregation of sulphate from nitrate and chloride
To the best of our knowledge, this is the first report of the segregation of sulphate from nitrate and chloride in individ-ual mineral dust particles that have experienced extensive at-mospheric aging and transport (Figs. 5 and 10), along with the preliminary results summarized in Arimoto et al. (2006). Murphy and Thomson (1997) reported the external mixture of chloride and sulphate in individual ambient particles (not limited to dust) detected at Idaho Hill and also found that sul-phate and nitrate were usually, but not always, found in sep-arate particles. Zhang et al. (2000) detected coarse and fine mode single particles collected on filters in coastal China that were internally mixed with sulphate and nitrate. These par-ticles also typically contained mineral elements indicative of dust. Using similar methods, significant fractions of Asian dust particles collected in Japan were also found to contain both nitrate and sulphate (Zhang et al., 2003). In both these reports, the detection of nitrate and sulphate in each particle was purely qualitative and the detection limits for nitrate and sulphate on the coated collection substrates were 10−14 and 10−17g, respectively. Thus, a mineral dust particle contain-ing even a small amount of nitrate and/or sulphate would be reported as internally mixed with nitrate and sulphate.
The aging mechanism presented in Sect. 3.8 can be used to explain the segregation of sulphate from nitrate and chloride in dust. As sulphate is non-volatile and the strongest acid, it will prevent the accumulation of other weaker acids once it has formed in the mineral dust. The segregation therefore indicates that sulphate accumulated in the dust first. This could be the result of a faster kinetic rate for the formation of sulphate in dust compared to nitrate and chloride, and/or the dust plume encountering sulphate precursors prior to those of nitrate and chloride.
Numerous laboratories studies have measured reaction probabilities for various acidic gases with mineral dust sur-faces. Most of these have involved reacting the dust with one gas at a time, though Ooki and Uematsu (2005) reacted Asian dust particles with ambient Tokyo air containing acidic gases (e.g. SO2, NO2, HNO3, and HCl). In general, the
reac-tion probabilities for HNO3with dust are found to be several
orders of magnitude higher than for NO2 or SO2(Hanisch
and Crowley, 2001; Ullerstam et al., 2003; Underwood et al., 2001; Usher et al., 2003a; Vlasenko et al., 2006). The study of Ooki and Uematsu (2005) is the only one we are aware of that has studied the reaction of HCl(g) with dust parti-cles. They found that the dust predominantly reacted with
HNO3(48%) and HCl (40%), and not with SO2 (12%); no
reaction probabilities were determined. Santschi and Rossi (2006) measured the reaction probability for HCl(g) on cal-cite to be 0.1, which was the same value they found for HNO3
and SO2. They stressed the role that adsorbed water plays in
the kinetics.
While HNO3and HCl exhibit much higher reaction


![[PDF] Cours PDF complet avec exemples sur le langage JavaScript méthodes et applications - Cours Javascript](data:image/gif;base64,R0lGODlhAQABAIAAAP///wAAACH5BAEAAAAALAAAAAABAAEAAAICRAEAOw==)