HAL Id: inserm-00645015
https://www.hal.inserm.fr/inserm-00645015
Submitted on 25 Nov 2011
HAL is a multi-disciplinary open access
archive for the deposit and dissemination of
sci-entific research documents, whether they are
pub-lished or not. The documents may come from
teaching and research institutions in France or
abroad, or from public or private research centers.
L’archive ouverte pluridisciplinaire HAL, est
destinée au dépôt et à la diffusion de documents
scientifiques de niveau recherche, publiés ou non,
émanant des établissements d’enseignement et de
recherche français ou étrangers, des laboratoires
publics ou privés.
Population pharmacodynamic model of bicarbonate
response to acetazolamide in mechanically ventilated
COPD patients.
Nicholas Heming, Christophe Faisy, Saïk Urien
To cite this version:
Nicholas Heming, Christophe Faisy, Saïk Urien. Population pharmacodynamic model of bicarbonate
response to acetazolamide in mechanically ventilated COPD patients.. Critical Care, BioMed Central,
2011, 15 (5), pp.R213. �10.1186/cc10448�. �inserm-00645015�
R E S E A R C H
Open Access
Population pharmacodynamic model of
bicarbonate response to acetazolamide in
mechanically ventilated chronic obstructive
pulmonary disease patients
Nicholas Heming
1*, Christophe Faisy
1and Saïk Urien
2Abstract
Introduction: Acetazolamide is commonly given to chronic obstructive pulmonary disease (COPD) patients with metabolic alkalosis. Little is known of the pharmacodynamics of acetazolamide in the critically ill. We undertook the pharmacodynamic modeling of bicarbonate response to acetazolamide in COPD patients under mechanical ventilation. Methods: This observational, retrospective study included 68 invasively ventilated COPD patients who received one or multiple doses of 250 or 500 mg of acetazolamide during the weaning period. Among the 68 investigated patients, 207 time-serum bicarbonate observations were available for analysis. Population pharmacodynamics was modeled using a nonlinear mixedeffect model. The main covariates of interest were baseline demographic data, Simplified Acute Physiology Score II (SAPS II) at ICU admission, cause of respiratory failure, co-prescription of drugs interfering with the acid-base equilibrium, and serum concentrations of protein, creatinin, potassium and chloride. The effect of
acetazolamide on serum bicarbonate levels at different doses and in different clinical conditions was subsequently simulated in silico.
Results: The main covariates interacting with acetazolamide pharmacodynamics were SAPS II at ICU admission (P = 0.01), serum chloride (P < 0.001) and concomitant administration of corticosteroids (P = 0.02).
Co-administration of furosemide significantly decreased bicarbonate elimination. Acetazolamide induced a decrease in serum bicarbonate with a dose-response relationship. The amount of acetazolamide inducing 50% of the putative maximum effect was 117 ± 21 mg. According to our model, an acetazolamide dosage > 500 mg twice daily is required to reduce serum bicarbonate concentrations > 5 mmol/L in the presence of high serum chloride levels or coadministration of systemic corticosteroids or furosemide.
Conclusions: This study identified several covariates that influenced acetazolamide pharmacodynamics and could allow a better individualization of acetazolamide dosing when treating COPD patients with metabolic alkalosis. Keywords: COPD, mechanical ventilation, weaning, metabolic alkalosis
Introduction
Chronic obstructive pulmonary disease (COPD) is a lead-ing cause of morbidity and mortality [1]. The natural his-tory of the disease is marked by exacerbations that affect the prognosis of patients with COPD [2]. Noninvasive
mechanical ventilation in the clinical setting of COPD exacerbations reduces mortality [3]. However, initiation of invasive mechanical ventilation may be necessary, for instance, after the failure of an initial trial of noninvasive mechanical ventilation. Weaning from mechanical ventila-tion can be particularly difficult and prolonged in COPD patients with severe preexisting airflow limitation [4].
Metabolic alkalosis is an acid-base disorder that occurs frequently in the critically ill [5]. Metabolic alkalosis leads to hypoventilation, which may cause difficulty in
* Correspondence: nicholas.heming@orange.fr
1Medical Intensive Care Unit, European Georges Pompidou Hospital (AP-HP),
Université Paris Descartes, Sorbonne Paris Cité, 20 rue Leblanc, 75908 Paris, France
Full list of author information is available at the end of the article
© 2011 Heming et al.; licensee BioMed Central Ltd. This is an open access article distributed under the terms of the Creative Commons Attribution License (http://creativecommons.org/licenses/by/2.0), which permits unrestricted use, distribution, and reproduction in any medium, provided the original work is properly cited.
the weaning process. Metabolic alkalosis is characterized by an elevated serum pH level secondary to increased plasma bicarbonate (HCO3-) retention. Correction of
this acid-base disorder increases both minute ventilation and partial pressure of oxygen (PaO2), potentially
allow-ing COPD patients to be weaned more rapidly from mechanical ventilation [6,7]. Acetazolamide (ACET), when administered after proper fluid loading and potas-sium supplementation, is one of the most common drugs used to treat metabolic alkalosis. ACET decreases proxi-mal tubular HCO3-reabsorption through carbonic
anhy-drase (CA) inhibition in the luminal borders of renal proximal tubule cells [8]. In addition, ACET (1) induces CO2retention by inhibiting CA isoenzymes in red cells
and tissue and (2) improves cardiac function and gas exchange in cor pulmonale by stimulating diuresis [8].
There is a paucity of literature to support only one ACET dosing strategy during the weaning period for mechanically ventilated COPD patients. It has been estab-lished that a single 500-mg daily dose of ACET reverses metabolic alkalosis over 72 hours in intubated patients with COPD or asthma as effectively as multiple doses of 250 mg [9]. However, a recent study has shown that ACET administration at a daily dose of 500 mg during the wean-ing period of COPD patients with mixed or pure metabolic alkalosis only moderately diminishes serum HCO3-levels,
without changing either partial pressure of carbon dioxide (PaCO2) levels or minute ventilation [10]. The lack of
effec-tiveness of ACET on respiratory mechanics could be due to alterations in ACET pharmacodynamics [10]. Indeed, ACET pharmacodynamics in ICU patients has received lit-tle attention, especially in mechanically ventilated COPD patients.
The objectives of our present study were to develop a population pharmacodynamic model for ACET in mechanically ventilated COPD patients using nonlinear mixed-effects modeling and to examine the possible effect of covariates on a pharmacodynamic parameter, the observed serum HCO3-level.
Materials and methods
Data for COPD patients admitted to the medical ICU of a tertiary care teaching hospital with the diagnosis of acute respiratory failure were retrospectively examined over a 10-year period (2000 to 2010). In accordance with French law, no local institutional review board authorization was needed, owing to the study’s observational design, and the Commission Nationale de l’Informatique et des Libertés approved the use of computerized medical data with pro-tection of patient confidentiality. COPD patients intubated for acute respiratory failure who had received ACET during the weaning period were eligible for analysis. COPD was diagnosed according to the Global Initiative for Chronic Obstructive Lung Disease criteria [11]. The
weaning period was defined as the time between readiness to wean and extubation. Readiness to wean was defined according to the criteria of the Sixth International Confer-ence Consensus in Intensive Care Medicine held in 2005 on the subject of weaning from mechanical ventilation [12]. Five hundred and thirty-six files of COPD patients admitted to our ICU were examined.
ACET administration
Acetazolamide (Diamox; Sanofi-Aventis, Paris, France) administration (250 to 500 mg delivered two times per day via nasogastric tube or intravenously) was monitored by physicians in charge of the patient according to arterial blood gas analyses routinely performed. ACET was not administered to patients with liver or kidney failure.
Patient data
Baseline demographic data at the time of ICU admission included patient age, sex, body weight, smoking history, use of long-term systemic corticosteroids or diuretics (including ACET), home oxygen therapy or home nonin-vasive ventilation, left ventricular ejection fraction assessed by echocardiography and prior pulmonary function tests performed while the patient was in stable condition, the Simplified Acute Physiology Score II (SAPS II) [13] and the cause of respiratory failure. Serum HCO3-level was
obtained by arterial blood gas analysis (ABL series; Radio-meter Copenhagen, Copenhagen, Denmark) before and up to 24 hours after ACET administration. Serum levels of protein, creatinine, potassium and chloride were recorded during the three hours preceding ACET administration and up to 24 hours afterward. Throughout ACET treat-ment, data regarding the mode of mechanical ventilation and additional treatments which could alter acid-base equilibrium (furosemide, corticosteroids, b2-agonists and
fluid loading) were collected from charts prospectively completed by physicians and nurses. We also collected length of invasive mechanical ventilation, length of ICU stay and ICU outcome. Among the parameters appraised, serum HCO3-concentration was used in this
pharmacody-namic analysis for direct relationship with ACET dosage.
Weaning from mechanical ventilation
The weaning process was standardized by implementing a written protocol according to the recommendations of the Consensus Conference of the Société de Réanimation de Langue Française held in October 2001. The weaning strategy (1) consisted of a progressive decrease in pressure support ventilation or volume-assisted ventilation with the use of progressively increased time on a T-piece and (2) was chosen by physicians in charge according to the diffi-culty of the weaning process [12]. External positive end-expiratory pressure (PEEP) was applied to counterbalance intrinsic PEEP, typically 4 to 6 cmH2O, in COPD patients.
Heming et al. Critical Care 2011, 15:R213 http://ccforum.com/content/15/5/R213
During the weaning process, b2-agonists or furosemide
was administered by attending physicians as indicated. In our ICU, the criteria for extubation were also standardized in a written protocol detailed elsewhere [10].
Pharmacodynamic modeling
The pharmacokinetics of ACET were ascribed to a one-compartment open model with linear elimination [14,15]. Elimination half-life was fixed at six hours (0.25 hours/ day) [14]. The corresponding differential equations used were for the intravenous or enteral route, respectively:
dA(t)/dt = −kelim× A(t)
or
dG(t)/dt = −ka× G(t), with dA(t)/dt = ka× G(t) − kelim× A(t),
where A(t) and kelim, respectively, denote the ACET
amount in the body at a given time and the constant rate of elimination (half-life = 0.693/kelim), and G(t) and
ka represent the ACET amount in the gut at a given time and the first-order absorption rate, respectively. Serum HCO3- concentration (Bicar(t), in mmol/L) was
ascribed to a turnover model as follows:
dBicar(t)/dt = kin− kout× Bicar(t),
where kin (mmol/L/day) and kout (day-1) are the
HCO3-rate formation and the first-order constant rate
of HCO3-elimination, respectively. At equilibrium,
dBi-car/dt = 0 and the HCO3-baseline level was Bicar0 =
kin/kout. The effect of ACET (EACET) on HCO3- equili-brium was assumed to increase the elimination process:
dBicar(t)/dt = kin− EACET × kout× Bicar(t),
with EACET= 1 + Emax× A(t)/[A(t) + A50],
where A50 is ACET dosage that induces 50% of the
maximal effect (Emax).
Data analysis
Data was analyzed using the nonlinear mixed-effect mod-eling software program Monolix version 3.1S Release 2 http://wfn.software.monolix.org/. The main covariates of interest were baseline demographic data, SAPS II at ICU admission, cause of respiratory failure, coprescription of drugs interfering with the acid-base equilibrium and serum concentrations of protein, creatinine, potassium and chloride. Parameters were estimated by computing the maximum likelihood estimation of the parameters without any approximation of the model (that is, no line-arization) using the stochastic approximation expectation maximization algorithm combined with a Markov chain Monte Carlo procedure. A proportional error model was
used to describe residual variability (εPROPand εADD), and
between-subject variability (BSV, or h) was ascribed to an exponential error model. Parameter shrinkage was calcu-lated as [1 - sd(h)/ω], where sd(h) and ω are the standard deviation of individual h parameters and the population model estimate of the BSV, respectively. Standard errors were computed by stochastic approximation, not by line-arization. The likelihood ratio test, including the log-likeli-hood, the Akaike information criterion (AIC) and the Bayesian information criterion (BIC), were used to test dif-ferent hypotheses regarding the final model, the covariate effects on pharmacokinetic parameters, the residual varia-bility model (proportional versus proportional plus addi-tive error model) and the structure of the variance-covariance matrix for the BSV parameters. Residuals are presented as normalized prediction distribution errors (NPDEs), based on the estimates of unbiased means and variances of the predictions by using 500 Monte Carlo simulations of the final model. (The calculation includes a decorrelation step of the prediction errors.) The mean values and variance of these normalized residues must not be different from 0 and 1, respectively. Diagnostic graphics and other statistics were derived using the R software pro-gram [16]. The results are expressed as raw numbers (%), means ± SD or medians (ranges) for data with nonnormal distributions. P < 0.05 was considered significant.
Results
Of the 536 COPD patients identified, 446 patients received neither invasive mechanical ventilation nor ACET during their ICU stay. The files of 22 patients were incomplete and therefore were excluded. Sixty-eight patients were eligible for analysis. Patients’ charac-teristics upon entry into the study are summarized in Table 1. None of the included patients received ventila-tion through a tracheostomy tube. Among the 68 inves-tigated patients, 207 time-serum HCO3- observations
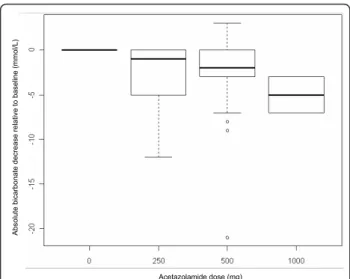
were available for analysis, with a median of three obser-vations per patient (range, 1 to 6). Differences between the pre-ACET dose HCO3- and HCO3- levels at 24
hours in all patients, plotted according to the total dosage of ACET administered (Figure 1), showed a dose-response relationship. Additionally, the scale of observed differences was similar to what has previously been reported [9,10].
Pharmacodynamic modeling
The turnover model satisfactorily described the data. The parameters of the model were Bicar0 (baseline), koutand
A50. BSVs could be estimated for Bicar0and koutonly. It
was not possible to simultaneously determine the Emax
and A50parameters. We therefore decided to assign Emax
a value of 1. Residual variability was described by a pro-portional error model. Using the enteral route of ACET
administration to predict serum HCO3-concentration did
not improve the model or the precision of the other para-meters. Since the biodisponibility of ACET is excellent, the simplest pharmacokinetic (intravenous) model was therefore used for all patients. The main covariate effects on Bicar0 were SAPS II at ICU admission (P = 0.01),
serum chloride concentration (P < 0.001) and concomitant glucocorticoid administration (P = 0.02). Coadministration
of furosemide significantly decreased HCO3-elimination
(effect on kout). The final covariate submodel was then:
Bicar0= TV(Bicar0)×(SAPS II/50)−0.11×(chloride/100)−1.17×(1.1 if glucocorticoids)
and
kout= TV(kout) × [1 − furosemie dosage/(furosemide dosage + Fur50)],
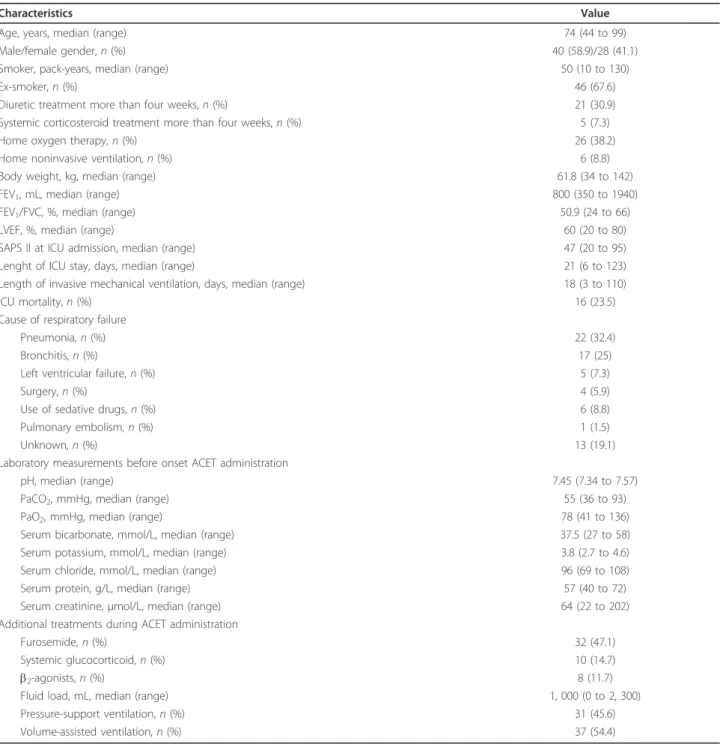
Table 1 Main characteristics of the study population (N = 68)a
Characteristics Value
Age, years, median (range) 74 (44 to 99)
Male/female gender, n (%) 40 (58.9)/28 (41.1)
Smoker, pack-years, median (range) 50 (10 to 130)
Ex-smoker, n (%) 46 (67.6)
Diuretic treatment more than four weeks, n (%) 21 (30.9)
Systemic corticosteroid treatment more than four weeks, n (%) 5 (7.3)
Home oxygen therapy, n (%) 26 (38.2)
Home noninvasive ventilation, n (%) 6 (8.8)
Body weight, kg, median (range) 61.8 (34 to 142)
FEV1, mL, median (range) 800 (350 to 1940)
FEV1/FVC, %, median (range) 50.9 (24 to 66)
LVEF, %, median (range) 60 (20 to 80)
SAPS II at ICU admission, median (range) 47 (20 to 95)
Lenght of ICU stay, days, median (range) 21 (6 to 123)
Length of invasive mechanical ventilation, days, median (range) 18 (3 to 110)
ICU mortality, n (%) 16 (23.5)
Cause of respiratory failure
Pneumonia, n (%) 22 (32.4)
Bronchitis, n (%) 17 (25)
Left ventricular failure, n (%) 5 (7.3)
Surgery, n (%) 4 (5.9)
Use of sedative drugs, n (%) 6 (8.8)
Pulmonary embolism, n (%) 1 (1.5)
Unknown, n (%) 13 (19.1)
Laboratory measurements before onset ACET administration
pH, median (range) 7.45 (7.34 to 7.57)
PaCO2, mmHg, median (range) 55 (36 to 93)
PaO2, mmHg, median (range) 78 (41 to 136)
Serum bicarbonate, mmol/L, median (range) 37.5 (27 to 58)
Serum potassium, mmol/L, median (range) 3.8 (2.7 to 4.6)
Serum chloride, mmol/L, median (range) 96 (69 to 108)
Serum protein, g/L, median (range) 57 (40 to 72)
Serum creatinine, μmol/L, median (range) 64 (22 to 202)
Additional treatments during ACET administration
Furosemide, n (%) 32 (47.1)
Systemic glucocorticoid, n (%) 10 (14.7)
b2-agonists, n (%) 8 (11.7)
Fluid load, mL, median (range) 1, 000 (0 to 2, 300)
Pressure-support ventilation, n (%) 31 (45.6)
Volume-assisted ventilation, n (%) 37 (54.4)
aACET, acetazolamide; COPD, chronic obstructive pulmonary disease; FEV
1, forced expiratory volume in one second; FVC, forced vital capacity; LVEF, left
ventricular ejection fraction; PaCO2, partial pressure of carbon dioxide; PaO2, partial pressure of oxygen; SAPS II, Simplified Acute Physiology Score II.
Heming et al. Critical Care 2011, 15:R213 http://ccforum.com/content/15/5/R213
where TV is typical value and Fur50 denotes the dose
of furosemide that induces a 50% decrease of kout. The
AIC/BIC ratio was 1, 044/1, 066. When parameters were standardized to a SAPS II of 50 and a serum chlor-ide level of 100 mmol/L, the dose of ACET provoking 50% of the putative maximal effect on serum HCO3
-(A50) was 117 +/- 21 mg. Additionally, we checked the
likelihood profile of A50, confirming that the value of
A50was not 0 (data not shown). Table 2 summarizes
the final population pharmacokinetic estimates. The
predicted versus observed serum HCO3-concentrations
are depicted in Figures 2A, B and 2C, which show the corresponding normalized prediction distribution error tests for these data. The normalized prediction distribu-tion error test plotted against the covariates of interest was also satisfactory, illustrating the robustness of the model (data not shown). A graph of the model errors over time was created by plotting measured model pre-dicted values and measured individual prepre-dicted values over time for each subject. No systematic deviation of error was obvious over time (data not shown).
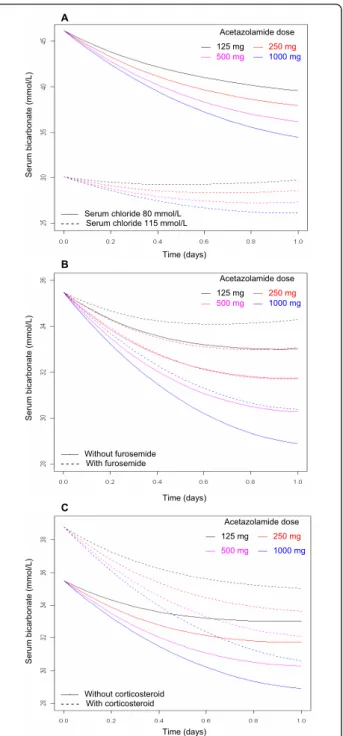
ACET dosing in COPD patients
Using this pharmacodynamic model, we assessed the effect of ACET administered once daily on serum HCO3-levels under various conditions of serum
chlor-ide level and coprescription of furosemchlor-ide or glucocorti-coids (Figures 3A, B and 3C). According to our model, a higher ACET dosage is required to reduce serum HCO3
-concentration > 5 mmol/L in the presence of high levels of serum chloride or coprescription of systemic corticos-teroids or furosemide.
Discussion
Little is known about the pharmacokinetics or pharmaco-dynamics of ACET in acutely ill patients, especially COPD patients during the weaning process [17]. At low doses (4 mg/kg), ACET preferentially and fully inhibits renal and endothelial cell CA [18,19], whereas at higher doses (7 to 12 mg/kg), ACET inhibits the activity of CA in red blood cells, chemoreceptors and respiratory muscles [19]. These findings underline the complexity of the response to ACET [8,20]. Morover, ACET administration is associated with almost no severe side effects. ACET administered at the usual dosage to COPD patients during the weaning process is known to induce a modest but significant
Table 2 Parameter estimates of the final acetazolamide population model in patients with chronic obstructive pulmonary disease (N = 68)a
Parameter Estimate (%rse) BSV (%rse) [shrinkage]
Half-life, day 0.25 (fixed) NA
Bicar0, mmol/L 35.5 (2) 0.101 (9) [0.04]
× SAPS II effect (SAPS II/50)-0.11 -0.112 (39)
× Corticosteroid effect, if present 1.092 (41) × Serum chloride effect (chloride/100)-1.17 -1.18 (17)
kout, mmol/day 0.395 (17) 0.792 (15) [0.27]
Fur50 187 (21)
A50 117 (18) NA
Residual variability 0.04 (8) NA
a%rse, percentage relative standard error; ACET, acetazolamide; A
50, ACET dosage that provokes 50% of putative maximal effect on serum bicarbonate; BSV,
between-subject variability; Bicar0, bicarbonate baseline level; Fur50: furosemide dose that induces a 50% decrease of kout; kout, first-order constant rate of
bicarbonate elimination; NA, not applicable; SAPS II, Simplified Acute Physiology Score II; TV: typical value. When COPD patients received ACET, the effect of covariates on observed serum bicarbonate levels was Bicar0= TV(Bicar0) × (SAPS II/50)-0.11× (chloride/100)-1.17× (1.1 if glucocorticoids) and kout= TV(kout) × [1
-furosemide dosage/(-furosemide dosage + Fur50)]. Shrinkage was calculated as [1 - sd(h)/ω], where sd(h) and ω are the standard deviation of individual h
parameters and the population model estimate of the BSV, respectively.
Ab so lu te b ica rb o n a te d e cre a se re la ti ve to b a se lin e (mmo l/ L ) Acetazolamide dose (mg)
Figure 1 Differences between pre-acetazolamide dose bicarbonate level and bicarbonate level at 24 hours in all patients, plotted according to the total dosage of
acetazolamide administered. Boxplots show the medians, first and third quartiles and 10th and 90th percentiles. The zero level at predose indicates that these values are based on intrapatient differences (repeated measures). Predose values: median 37.5; 25th and 75th percentiles 34 and 41, respectively; and 10th and 90th percentiles 30 and 45 mmol/L, respectively.
O b se rve d se ru m b ica rb o n a te (mmo l/ L ) A
Model predicted serum bicarbonate (mmol/L)
O b se rve d se ru m b ica rb o n a te (mmo l/ L ) B
Individual predicted serum bicarbonate (mmol/L) C
n
p
d
e
Predicted serum bicarbonate (mmol/L)
Figure 2 Goodnees-of-fit plots for the final model of acetazolamide pharmacodynamics. Shown are the results for 68 weaning chronic obstructive pulmonary disease patients. Observed versus model-predicted serum bicarbonate concentrations for (A) mean and (B) individual predictions and (C) normalized prediction distribution errors (NPDEs) versus predicted serum bicarbonate concentrations. The solid lines represent the identity lines and the dotted lines represent the regression lines. The mean and variance of the NPDE distribution were not significantly different from 0 and 1, respectively (P = 0.66 and P = 0.60, respectively; Wilcoxon signed-rank test and Fisher variance test, respectively) and from normality (P = 0.052, Shapiro-Wilks test), illustrating the robusteness of serum bicarbonate prediction after acetazolamide administration.
A Acetazolamide dose ́ 125 mg ́ 250 mg ́ 500 mg ́ 1000 mg Se ru m b ica rb o n a te (mmo l/ L )
́́ Serum chloride 80 mmol/L - - - - Serum chloride 115 mmol/L
Time (days) B Acetazolamide dose ́ 125 mg ́ 250 mg ́ 500 mg ́ 1000 mg Se ru m b ica rb o n a te (mmo l/ L ) ́́ Without furosemide - - - - With furosemide Time (days) C Acetazolamide dose ́ 125 mg ́ 250 mg ́ 500 mg ́ 1000 mg Se ru m b ica rb o n a te (mmo l/ L ) ́́ Without corticosteroid - - - - With corticosteroid Time (days)
Figure 3 Model-predicted effect of 125 mg, 250 mg, 500 mg or 1, 000 mg of acetazolamide. Shown are the effects of
acetazolamide (ACET) administered once daily on serum bicarbonate in the presence of (A) low or high levels of serum chloride, (B) coprescription or not of 20 to 160 mg/day furosemide or (C) coprescription or no coprescription of 1 mg/kg/day systemic cortocosteroids. Modelization of ACET pharmacodynamics was derived from 68 chronic obstructive pulmonary disease patients during the weaning period with metabolic alkalosis (Simplified Acute Physiology Score II at ICU admission was standardized at 50 and is shown in all parts of the figure). A higher ACET dosage is required to reduce serum bicarbonate concentrations > 5 mmol/L when high chloride or coprescription of systemic corticosteroids or furosemide occurs.
Heming et al. Critical Care 2011, 15:R213 http://ccforum.com/content/15/5/R213
decrease in serum HCO3-concentration [10]. Higher
doses of the drug could therefore be given to mechanically ventilated COPD patients to improve clinical respiratory variables. Our study is the first, to the best of our knowl-edge, to use population pharmacodynamic modeling to characterize the dose-response relationship associated with ACET response in invasively ventilated COPD patients. None of the patients included in this study experienced undesirable side effects after ACET adminis-tration, confirming the relative safety of the drug.
ACET is commonly used to treat metabolic alkalosis. ACET inhibits the CA enzyme and induces metabolic acidosis [8]. Metabolic acidosis in turn induces an increase in both minute ventilation and PaO2, potentially
allowing COPD patients to be weaned more rapidly from mechanical ventilation [6,7]. We therefore decided to use serum HCO3-concentration as a substitute for the effect
of ACET, taking into account parameters that might influence HCO3-concentration over time.
In our model, the Emaxparameter could not be
esti-mated, probably because of a lack of data with high enough concentrations. With a 117-mg dose of ACET that produces a putative half-maximal effect, this model predicts that a dosage of ACET > 500 mg twice daily could decrease serum HCO3-concentration > 5 mmol/L
in the presence of high serum chloride concentration or coadministration of furosemide or corticosteroids. The main covariates that had an effect on ACET pharmacody-namics were SAPS II at ICU admission, serum concen-tration of chloride and the coadminisconcen-tration of corticosteroids or furosemide. The dosage based on these parameters is expected to improve the benefits of ACET in COPD patients with metabolic alkalosis.
We showed that few covariates affected ACET pharma-codynamics in mechanically ventilated COPD patients. Both furosemide and corticosteroids induce metabolic alkalosis by stimulation (by different mechanisms) of distal tubular H+secretion [21]. Higher doses of ACET may be needed to counterbalance the effect of these drugs. Addi-tionally, ACET and furosemide are transported by the same carrier-mediated mechanism from plasma to their site of action localized at the luminal side of renal tubules [22]. Furosemide may therefore decrease the cotransport of ACET by a competitive mechanism. Our results are of import, since many COPD patients are treated by corticos-teroids or furosemide. Indeed, half the population in our study received furosemide during the weaning period. Chloride and HCO3-are the two major anions in the
serum. Physicochemical principles of conservation of mass and electroneutrality imply that a high serum chloride concentration is likely to be associated with a relatively low HCO3-concentration. In the presence of a higher
chloride concentration (and thus a lower HCO3-
concen-tration), non-CA-dependent mechanisms of HCO3
-reabsorption becomes activated and contributes to a greater extent in HCO3-reclamation when the total
fil-tered HCO3-falls [23-25].
The role of SAPS II on ACET pharmacodynamics remains speculative. The SAPS II includes the serum level of HCO3-at ICU admission. We hypothesize that the
most severely ill COPD patients at ICU admission may have a higher respiratory acidotic component of alkalosis at readiness to wean, limiting the effect of 500 mg of ACET [10].
The single biggest factor affecting ACET elimination is renal clearance. In our model, serum creatinine was not a significant covariate, probably because none of our patients had severe renal impairment. However, renal function is embedded in the SAPS II, which is a covariate of interest in our model. Additionally, the ACET dosage derived from our model are only valid if an elimination half-life of ACET of six hours is assumed. Our model therefore cannot be used to describe the pharmacody-namics of ACET in patients with kidney failure. Lastly, the volume of distribution of HCO3-is approximately that of
total body water. Body weight as a substitute for total body water was not found to affect the response to ACET in our model.
In a recent case-control study, we showed that ACET given at the dosage of 500 mg/day significantly but moder-ately diminished serum HCO3-without otherwise effecting
arterial blood gases (except for the PaO2/fraction of
inspired O2 ratio) or respiratory parameters in weaning
COPD patients [10]. Taken together, these findings indi-cate that, during the weaning period, COPD patients could benefit from a higher ACET dosage for effective reversal of metabolic alkalosis.
We show here that in mechanically ventilated COPD patients there is a dose-response relationship after administration of ACET to decrease serum HCO3-, with
a putative half-maximal effective dose of 117 mg. Berthel-sen and colleagues [17], in a study of heavily sedated alkalotic patients, showed that increasing doses of ACET were associated with increased excretion of urinary HCO3- over a short period of time. Our results differ
from those reported in several previous studies. Mazur and colleagues [9] showed that ACET administered as a single 500-mg dose reversed metabolic alkalosis in mechanically ventilated patients as effectively as four administrations of 250 mg, suggesting that there is no dose-response relationship when using ACET. Similarly, we did not find a relationship between preexisting respiratory function (including baseline forced expiratory volume in one second) and response to ACET adminis-tration in acutelly ill COPD patients, contrary to pre-viously published data derived from more stable COPD patients [8,26]. The discrepancy between our results and those reported in previous studies are likely due to
differences in illness severity at admission, serum chlor-ide levels at admission and coprescription of corticoster-oids or furosemide.
One of the limitations of this study is that patients at a single center were included. Our patient population was nonetheless comparable to similar COPD patients treated with invasive mechanical ventilation [27]. Another possible limitation is that some patients pre-sented compensated respiratory acidosis without real overlapping metabolic alkalosis, reflecting the variety of acid-base disorders present in mechanically venti-lated COPD patients [10]. To the best of our knowl-edge, the pH range observed in the present study has not yet been reported to influence CA inhibition by ACET.
Conclusions
In conclusion, an increased ACET dosage could be ben-eficial in the treatment of COPD patients receiving cor-ticosteroids or furosemide or presenting with high serum chloride concentrations. These assumptions should be prospectively confirmed, since our conclu-sions are drawn on the basis of studying only 68 patients. Unanswered questions remain, such as the effect of ACET administration on PaCO2 levels and
minute ventilation in these patients. Finally, the effect of ACET administration on COPD patients in terms of mortality and length of mechanical ventilation remains to be determined.
Key messages
• Little is known about the pharmacodynamics of ACET in the critically ill.
• We used a population pharmacodynamic model to characterize the dose-response relationship associated with ACET response in invasively ventilated COPD patients.
• According to our model, an ACET dosage > 500 mg twice daily is required to reduce serum HCO3-
concen-trations by > 5 mmol/L in the presence of high serum chloride concentrations or coadministration of furose-mide or corticosteroids.
Abbreviations
%rse: percentage relative standard error; A50: ACET dosage that induces 50%
of the maximal effect; ACET: acetazolamide; AIC: Akaike information criterion; A(t): ACET amount in the body; BIC: Bayesian information criterion; Bicar(t): serum bicarbonate level; Bicar0, bicarbonate baseline level; BSV:
between-subject variability; CA: carbonic anhydrase; COPD: chronic obstructive pulmonary disease; EACET: ACET effect; Emax: maximal effect of ACET; FEV1:
forced expiratory volume in one second; Fur50: dose of furosemide that
induces a 50% decrease of kout; FVC: forced vital capacity; G(t): ACET amount
in gut; HCO3-: bicarbonate; ka: first-order absorption rate; kelim: constant rate
of elimination; kin: bicarbonate rate formation; kout: first-order constant rate
of bicarbonate elimination; LVEF: left ventricular ejection fraction; NA, not applicable; SAPS II: Simplified Acute Physiology Score II; TV: typical value.
Acknowledgements
The authors thank Virginie Fulda and Agnès Lillo-Le Louët for their help in collecting data.
The funding sources were the Medical Intensive Care Unit, Hôpital Européen Georges Pompidou, and the Centre d’Investigation Clinique-0991, Institut national de la santé et de la recherche médicale (Inserm), Assistance Publique, Hôpitaux de Paris, University Paris Descartes, Paris, France. Author details
1
Medical Intensive Care Unit, European Georges Pompidou Hospital (AP-HP), Université Paris Descartes, Sorbonne Paris Cité, 20 rue Leblanc, 75908 Paris, France.2CIC-0109 Cochin-Necker Inserm, Unité de Recherche Clinique,
Tarnier Hospital, (AP-HP) and E.A. 3620 Université Paris Descartes, Sorbonne Paris Cité, 27 Rue du Faubourg Saint-Jacques 75014 Paris, France. Authors’ contributions
NH collected data and drafted the manuscript. CF conceived of the study, participated in its design and coordinated and drafted the manuscript. SU analyzed the data and drafted the manuscript. All authors read and approved the final manuscript.
Competing interests
The authors declare that they have no competing interests. Received: 15 May 2011 Revised: 6 July 2011
Accepted: 14 September 2011 Published: 14 September 2011 References
1. Lopez AD, Shibuya K, Rao C, Mathers CD, Hansell AL, Held LS, Schmid V, Buist S: Chronic obstructive pulmonary disease: current burden and future projections. Eur Respir J 2006, 27:397-412.
2. Gunen H, Hacievliyagil SS, Kosar F, Mutlu LC, Gulbas G, Pehlivan E, Sahin I, Kizkin O: Factors affecting survival of hospitalised patients with COPD. Eur Respir J2005, 26:234-241.
3. Lightowler JV, Wedzicha JA, Elliott MW, Ram FS: Non-invasive positive pressure ventilation to treat respiratory failure resulting from exacerbations of chronic obstructive pulmonary disease: Cochrane systematic review and meta-analysis. BMJ 2003, 326:185. 4. Gursel G: Determinants of the length of mechanical ventilation in
patients with COPD in the intensive care unit. Respiration 2005, 72:61-67. 5. Khanna A, Kurtzman NA: Metabolic alkalosis. Respir Care 2001, 46:354-365. 6. Berthelsen P, Gøthgen I, Husum B, Jacobsen E: Oxygen uptake and carbon
dioxide elimination after acetazolamide in the critically ill. Intensive Care Med1985, 11:26-29.
7. Brimioulle S, Berre J, Dufaye P, Vincent JL, Degaute JP, Kahn RJ: Hydrochloric acid infusion for treatment of metabolic alkalosis associated with respiratory acidosis. Crit Care Med 1989, 17:232-236. 8. Swenson ER: Carbonic anhydrase inhibitors and ventilation: a complex
interplay of stimulation and suppression. Eur Respir J 1998, 12:1242-1247. 9. Mazur JE, Devlin JW, Peters MJ, Jankowski MA, Iannuzzi MC, Zarowitz BJ:
Single versus multiple doses of acetazolamide for metabolic alkalosis in critically ill medical patients: a randomized, double-blind trial. Crit Care Med1999, 27:1257-1261.
10. Faisy C, Mokline A, Sanchez O, Tadié JM, Fagon JY: Effectiveness of acetazolamide for reversal of metabolic alkalosis in weaning COPD patients from mechanical ventilation. Intensive Care Med 2010, 36:859-863. 11. Rabe KF, Hurd S, Anzueto A, Barnes PJ, Buist SA, Calverley P, Fukuchi Y,
Jenkins C, Rodriguez-Roisin R, van Weel C, Zielinski J, Global Initiative for Chronic Obstructive Pulmonary Disease: Global strategy for the diagnosis, management, and prevention of chronic obstructive pulmonary disease: GOLD executive summary. Am J Respir Crit Care Med 2007, 176:532-555. 12. Boles JM, Bion J, Connors A, Herridge M, Marsh B, Melot C, Pearl R,
Silverman H, Stanchina M, Vieillard-Baron A, Welte T: Weaning from mechanical ventilation. Eur Respir J 2007, 29:1033-1056.
13. Le Gall JR, Lemeshow S, Saulnier F: A new Simplified Acute Physiology Score (SAPS II) based on a European/North American multicenter study. JAMA1993, 270:2957-2963.
14. Yano I, Takayama A, Takano M, Inatani M, Tanihara H, Ogura Y, Honda Y, Inui K: Pharmacokinetics and pharmacodynamics of acetazolamide in patients with transient intraocular pressure elevation. Eur J Clin Pharmacol1998, 54:63-68.
Heming et al. Critical Care 2011, 15:R213 http://ccforum.com/content/15/5/R213
15. Ritschel WA, Paulos C, Arancibia A, Agrawal MA, Wetzelsberger KM, Lücker PW: Pharmacokinetics of acetazolamide in healthy volunteers after short- and long-term exposure to high altitude. J Clin Pharmacol 1998, 38:533-539.
16. Ihaka R, Gentleman R: R: a language for data analysis and graphics. J Comput Graphic Stat1996, 5:299-314.
17. Berthelsen P, Gøthgen I, Husum B, Jacobsen E: Dissociation of renal and respiratory effects of acetazolamide in the critically ill. Br J Anaesth 1986, 58:512-516.
18. Teppema L, Dahan A: Acetazolamide and breathing: Does a clinical dose alter peripheral and central CO2sensitivity? Am J Resp Crit Care Med 1999,
160:1592-1597.
19. Kiwull-Schöne HF, Teppema LJ, Kiwull PJ: Low-dose acetazolamide does affect respiratory muscle function in spontaneously breathing anesthetized rabbits. Am J Respir Crit Care Med 2001, 163:478-483. 20. Wagenaar M, Teppema L, Berkenbosch A, Olievier C, Folgering H: The
effect of low-dose acetazolamide on the ventilatory CO2response curve
in the anaesthetized cat. J Physiol 1996, 495:227-237.
21. Webster NR, Kulkarni V: Metabolic alkalosis in the critically ill. Crit Rev Clin Lab Sci1999, 36:497-510.
22. Uway Y, Saito H, Hashimoto Y, Inui KI: Interaction and transport of thiazide diuretics, loop diuretics, and acetazolamide via rat renal organic anion transporter rOAT1. J Pharmacol Exp Ther 2000, 295:261-265. 23. Maren TH: Chemistry of the renal reabsorption of bicarbonate. Can J
Physiol Pharmacol1974, 52:1041-1050.
24. Maren TH: Carbonic anhydrase: chemistry, physiology, and inhibition. Physiol Rev1967, 47:595-781.
25. Preisig PA, Toto RD, Alpern RJ: Carbonic anhydrase inhibitors. Ren Physiol 1987, 10:136-159.
26. Skatrud JB, Dempsey JA: Relative effectiveness of acetazolamide versus medroxyprogesterone acetate in correction of chronic carbon dioxide retention. Am Rev Respir Dis 1983, 127:405-412.
27. Groenewegen KH, Scholas AM, Wouters EF: Mortality and mortality-related factors after hospitalization for acute exacerbation of COPD. Chest 2003, 124:459-467.
doi:10.1186/cc10448
Cite this article as: Heming et al.: Population pharmacodynamic model of bicarbonate response to acetazolamide in mechanically ventilated chronic obstructive pulmonary disease patients. Critical Care 2011 15: R213.
Submit your next manuscript to BioMed Central and take full advantage of:
• Convenient online submission
• Thorough peer review
• No space constraints or color figure charges
• Immediate publication on acceptance
• Inclusion in PubMed, CAS, Scopus and Google Scholar
• Research which is freely available for redistribution
Submit your manuscript at www.biomedcentral.com/submit