HAL Id: insu-01130275
https://hal-insu.archives-ouvertes.fr/insu-01130275
Submitted on 11 Mar 2015
HAL is a multi-disciplinary open access
archive for the deposit and dissemination of
sci-entific research documents, whether they are
pub-lished or not. The documents may come from
teaching and research institutions in France or
abroad, or from public or private research centers.
L’archive ouverte pluridisciplinaire HAL, est
destinée au dépôt et à la diffusion de documents
scientifiques de niveau recherche, publiés ou non,
émanant des établissements d’enseignement et de
recherche français ou étrangers, des laboratoires
publics ou privés.
Assessment for Decision-Makers Scientiic Assessment of
Ozone Depletion: 2014 World Meteorological
Organization United Nations Environment Programme
National Oceanic and Atmospheric Administration
National Aeronautics and Space Administration
European Commission
Nathalie Huret, Bernard Legras
To cite this version:
Nathalie Huret, Bernard Legras. Assessment for Decision-Makers Scientiic Assessment of Ozone
De-pletion: 2014 World Meteorological Organization United Nations Environment Programme National
Oceanic and Atmospheric Administration National Aeronautics and Space Administration European
Commission. [Research Report] 56, Assessment for Decision-Makers WMO Global Ozone Research
and Monitoring Project – Report No. 56 Scientic Assessment of Ozone Depletion: 2014. 2014, 92 p.
�insu-01130275�
Assessment for Decision-Makers
WMO Global Ozone Research and
Monitoring Project – Report No. 56
Scientific Assessment of Ozone Depletion: 2014
World Meteorological Organization
United Nations Environment Programme
National Oceanic and Atmospheric Administration
National Aeronautics and Space Administration
European Commission
World Meteorological Organization
7bis, avenue de la Paix
Case postale 2300
CH-1211, Geneva 2
Switzerland
United Nations Environment Programme
Ozone Secretariat
P.O. Box 30552
Nairobi, 00100
Kenya
U.S. Department of Commerce
National Oceanic and Atmospheric Administration
14
thStreet and Constitution Avenue NW
Herbert C. Hoover Building, Room 5128
Washington, D.C. 20230
National Aeronautics and Space Administration
Earth Science Division
NASA Headquarters
300 E Street SW
Washington, D.C. 20546-0001
European Commission
Directorate-General for Research and Innovation
B-1049 Bruxelles
Belgium
Published online September 2014
Published in print December 2014
ISBN: 978-9966-076-00-7
Hardcopies of this report are available from WMO (address above; GBraathen@wmo.int).
This report and other components of the 2014 Ozone Assessment are available at the following locations:
http://www.wmo.int/pages/prog/arep/gaw/ozone_2014/ozone_asst_report.html
http://ozone.unep.org/en/assessment_panels_bodies.php?committee_id=7
http://ozone.unep.org/Assessment_Panels/SAP/SAP2014_Assessment_for_Decision-Makers.pdf
http://esrl.noaa.gov/csd/assessments/ozone/
Note: Figures from this report are in the public domain and may be used with proper attribution to source.
This document should be cited as:
WMO (World Meteorological Organization), Assessment for Decision-Makers: Scientific Assessment of Ozone Depletion:
2014, 88 pp., Global Ozone Research and Monitoring Project—Report No. 56, Geneva, Switzerland, 2014.
Cover design: Christine A. Ennis, Debra A. Dailey-Fisher, and Albert Romero
Cover photo adapted from: ©iStock.com/sharply_done
World Meteorological Organization
Global Ozone Research and Monitoring Project—Report No. 56
National Oceanic and Atmospheric Administration
National Aeronautics and Space Administration
United Nations Environment Programme
World Meteorological Organization
European Commission
Assessment for Decision-Makers
Scientific Assessment of Ozone Depletion: 2014
Actions taken under the Montreal Protocol have led to decreases in the atmospheric abundance of controlled
ozone-depleting substances (ODSs), and are enabling the return of the ozone layer toward 1980 levels.
• The sum of the measured tropospheric abundances of substances controlled under the Montreal Protocol continues to decrease. Most of the major controlled ODSs are decreasing largely as projected, and
hydrochlorofluorocarbons (HCFCs) and halon-1301 are still increasing. Unknown or unreported sources of carbon tetrachloride are needed to explain its abundance.
• Measured stratospheric abundances of chlorine- and bromine-containing substances originating from the degradation of ODSs are decreasing. By 2012, combined chlorine and bromine levels (as estimated by Equivalent
Effective Stratospheric Chlorine, EESC) had declined by about 10–15% from the peak values of ten to fifteen years ago. Decreases in atmospheric abundances of methyl chloroform (CH3CCl3), methyl bromide (CH3Br), and chlorofluorocarbons
(CFCs) contributed approximately equally to these reductions.
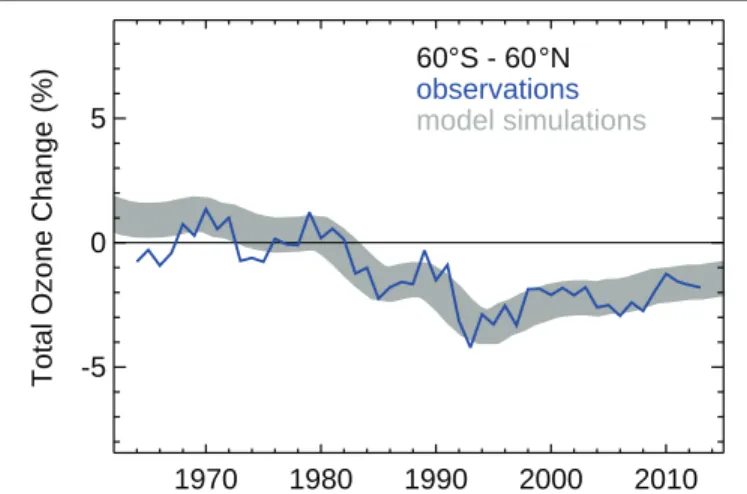
• Total column ozone declined over most of the globe during the 1980s and early 1990s (by about 2.5% averaged over 60°S to 60°N). It has remained relatively unchanged since 2000, with indications of a small increase in total
column ozone in recent years, as expected. In the upper stratosphere there is a clear recent ozone increase, which climate models suggest can be explained by comparable contributions from declining ODS abundances and upper stratospheric cooling caused by carbon dioxide increases.
• The Antarctic ozone hole continues to occur each spring, as expected for the current ODS abundances. The Arctic
stratosphere in winter/spring 2011 was particularly cold, which led to large ozone depletion as expected under these conditions.
• Total column ozone will recover toward the 1980 benchmark levels over most of the globe under full compliance
with the Montreal Protocol. This recovery is expected to occur before midcentury in midlatitudes and the Arctic, and somewhat later for the Antarctic ozone hole.
The Antarctic ozone hole has caused significant changes in Southern Hemisphere
surface climate in the summer.
• Antarctic lower stratospheric cooling due to ozone depletion is very likely the dominant cause of observed changes in Southern Hemisphere tropospheric summertime circulation over recent decades, with associated
impacts on surface temperature, precipitation, and the oceans. In the Northern Hemisphere, no robust link has been found between stratospheric ozone depletion and tropospheric climate.
Changes in CO
2, N
2O, and CH
4will have an increasing influence on the ozone layer as ODSs decline.
• As controlled ozone-depleting substances decline, the evolution of the ozone layer in the second half of the 21st century will largely depend on the atmospheric abundances of CO
2, N2O, and CH4. Overall, increasing carbon
dioxide (CO2 ) and methane (CH4 ) elevate global ozone, while increasing nitrous oxide (N2O) further depletes global
ozone. The Antarctic ozone hole is less sensitive to CO2, N2O, and CH4 abundances.
• In the tropics, significant decreases in column ozone are projected during the 21st century. Tropical ozone levels
are only weakly affected by ODS decline; they are sensitive to circulation changes driven by CO2 , N2O, and CH4 increases.
The climate benefits of the Montreal Protocol could be significantly offset by projected
emissions of HFCs used to replace ODSs.
The Montreal Protocol and its Amendments and adjustments have made large contributions toward reducing global greenhouse gas emissions. In 2010, the decrease of annual ODS emissions under the Montreal Protocol is estimated to be about 10 gigatonnes of avoided CO2-equivalent emissions per year, which is about five times larger than the annual emissions reduction target for the first commitment
period (2008–2012) of the Kyoto Protocol (from the Executive Summary of the Scientific Assessment of Ozone Depletion: 2010).1 1 GWP-weighted emissions, also known as CO
2-equivalent emissions, are defined as the amount of gas emitted multiplied by its 100-year Global Warming Potential (GWP). Part of the effect of ODSs as greenhouse gases is offset by the cooling due to changes in ozone.
ES-2
• The sum of the hydrofluorocarbons (HFCs) currently used as ODS replacements makes a small contribution of about 0.5 gigatonnes CO2-equivalent emissions per year. These emissions are currently growing at a rate of about 7% per year and
are projected to continue to grow.
• If the current mix of these substances is unchanged, increasing demand could result in HFC emissions of up to 8.8 gigatonnes CO2-equivalent per year by 2050, nearly as high as the peak emission of CFCs of about 9.5 gigatonnes CO2
-equivalent per year in the late 1980s.2
• Replacements of the current mix of high-Global Warming Potential (GWP) HFCs with low-GWP compounds or not-in-kind technologies would essentially avoid these CO2-equivalent emissions.
• Some of these candidate low-GWP compounds are hydrofluoro-olefins (HFOs), one of which (HFO-1234yf) yields the persistent degradation product trifluoroacetic acid (TFA) upon atmospheric oxidation. While the environmental effects of TFA are considered to be negligible over the next few decades, potential longer-term impacts could require future evaluations due to the environmental persistence of TFA and uncertainty in future uses of HFOs.
• By 2050, HFC banks are estimated to grow to as much as 65 gigatonnes CO2-equivalent. The climate change impact of
the HFC banks could be reduced by limiting future use of high-GWP HFCs to avoid the accumulation of the bank, or by destruction of the banks.
Additional important issues relevant to the Parties to the Montreal Protocol and other
decision-makers have been assessed.
• Derived emissions of carbon tetrachloride (CCl4), based on its estimated lifetime and its accurately measured atmospheric
abundances, have become much larger than those from reported production and usage over the last decade.
• As of 2009, the controlled consumption of methyl bromide declined below the reported consumption for quarantine and pre-shipment (QPS) uses, which are not controlled by the Montreal Protocol.
• Increased anthropogenic emissions of very short-lived substances (VSLS) containing chlorine and bromine, particularly from tropical sources, are an emerging issue for stratospheric ozone. The relative contribution of these emissions could become important as levels of ODSs controlled under the Montreal Protocol decline.
• As the atmospheric abundances of ODSs continue to decrease over the coming decades, N2O, as the primary source of
nitrogen oxides in the stratosphere, will become more important in future ozone depletion.
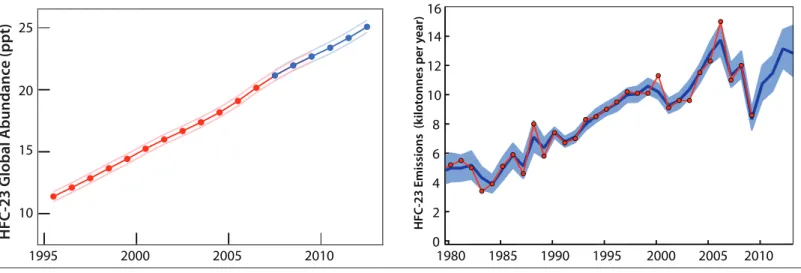
• Emissions of HFC-23, a by-product of HCFC-22 production, have continued despite mitigation efforts.
• While ODS levels remain high, a large stratospheric sulfuric aerosol enhancement due to a major volcanic eruption or geoengineering activities would result in a substantial chemical depletion of ozone over much of the globe.
While past actions taken under the Montreal Protocol have substantially reduced ODS production and
consumption, additional, but limited, options are available to reduce future ozone depletion.
Emissions from the current banks are projected to contribute more to future ozone depletion than those caused by future ODS production, assuming compliance with the Protocol.
• Possible options to advance the return of the ozone layer
to the 1980 level (analyses based on midlatitude EESC) are shown graphically. The cumulative effect of elimination of emissions from all banks and production advances this return by 11 years.
2 This is equivalent to about 45% of the fossil fuel and cement emissions of CO
The present document will be part of the information upon which the Parties to the United Nations Montreal Protocol will base their future decisions regarding ozone-depleting substances, their alternatives, and protection of the ozone layer. It is the latest in a long series of scientific assessments that have informed the Parties.
The Charge to the Assessment Panels
Specifically, the Montreal Protocol on Substances that Deplete the Ozone Layer 3 states (Article 6): “…the Parties shall assess the control
measures…on the basis of available scientific, environmental, technical, and economic information. ” To provide the mechanisms whereby these assessments are conducted, the Protocol further states: “…the Parties shall convene appropriate panels of experts” and “the panels will report their conclusions…to the Parties.”
To meet this request, the Scientific Assessment Panel (SAP), the Environmental Effects Assessment Panel (EEAP), and the Technology and Economic Assessment Panel (TEAP) have each prepared, about every 3–4 years, major assessment reports that updated the state of understanding in their purviews. These reports have been scheduled so as to be available to the Parties in advance of their meetings at which they consider the need to amend or adjust the Protocol.
The Sequence of Scientific Assessments
The present 2014 report is the latest in a series of twelve scientific Assessments (shown below) prepared by the world’s leading experts in the atmospheric sciences and under the international auspices of the World Meteorological Organization (WMO) and/or the United Nations Environment Programme (UNEP). This report is the eighth in the set of major Assessments that have been prepared by the Scientific Assessment Panel directly as input to the Montreal Protocol process. The chronology of all the scientific Assessments on the understanding of ozone depletion and their relation to the international policy process is summarized as follows:
Year Policy Process Scientific Assessment
1981 The Stratosphere 1981: Theory and Measurements. WMO No. 11
1985 Vienna Convention Atmospheric Ozone 1985. Three volumes. WMO No. 16
1987 Montreal Protocol
1988 International Ozone Trends Panel Report 1988. Two volumes. WMO No. 18
1989 Scientific Assessment of Stratospheric Ozone: 1989. Two volumes. WMO No. 20
1990 London Amendment and adjustments
1991 Scientific Assessment of Ozone Depletion: 1991. WMO No. 25
1992 Methyl Bromide: Its Atmospheric Science, Technology, and Economics (Assessment
Supplement). UNEP (1992). 1992 Copenhagen Amendment
and adjustments
1994 Scientific Assessment of Ozone Depletion: 1994. WMO No. 37
1995 Vienna adjustments 1997 Montreal Amendment and
adjustments
1998 Scientific Assessment of Ozone Depletion: 1998. WMO No. 44
1999 Beijing Amendment and adjustments
2002 Scientific Assessment of Ozone Depletion: 2002. WMO No. 47
2006 Scientific Assessment of Ozone Depletion: 2006. WMO No. 50
2007 Montreal adjustments
2010 Scientific Assessment of Ozone Depletion: 2010. WMO No. 52
2014 Scientific Assessment of Ozone Depletion: 2014. WMO No. 55
Preface
3 In this report, ozone-depleting substances (ODSs) refer to the gases listed in the Annexes to the Montreal Protocol. In addition to these gases, other chemicals also influence the ozone layer, and they are referred to as ozone-relevant gases.
ii
The Current Information Needs of the Parties
The genesis of Scientific Assessment of Ozone Depletion: 2014 was the 23rd Meeting of the Parties to the Montreal Protocol held during 21–25
November 2011 in Bali, Indonesia, at which the scope of the scientific needs of the Parties was defined in their Decision XXIII/13 (4), which stated that “...for the 2014 report, the Scientific Assessment Panel should consider issues including:
• Assessment of the state of the ozone layer and its future evolution, including in respect of atmospheric changes from, for example, sudden stratospheric warming or accelerated Brewer-Dobson circulation;
• Evaluation of the Antarctic ozone hole and Arctic winter/spring ozone depletion and the predicted changes in these phenomena, with a particular focus on temperatures in the polar stratosphere;
• Evaluation of trends in the concentration in the atmosphere of ozone-depleting substances and their consistency with reported production and consumption of those substances and the likely implications for the state of the ozone layer and the atmosphere; • Assessment of the interaction between the ozone layer and the atmosphere; including: (i) The effect of polar ozone depletion on
tropospheric climate and (ii) The effects of atmosphere-ocean coupling;
• Description and interpretation of observed ozone changes and ultraviolet radiation, along with future projections and scenarios for those variables, taking into account among other things the expected impacts to the atmosphere;
• Assessment of the effects of ozone-depleting substances and other ozone-relevant substances, if any, with stratospheric influences, and their degradation products, the identification of such substances, their ozone-depletion potential and other properties; • Identification of any other threats to the ozone layer.”
The 2014 SAP Assessment has addressed all the issues that were feasible to address to the best possible extent. Further, given the change in the structure of the report and the evolution of science, the UV changes will be addressed by the Environmental Effects Assessment Panel (EEAP) of the Montreal Protocol. The SAP has provided the necessary information on ozone levels, now and in the future, to EEAP as input to their assessments.
The 2014 Assessment Process
The formal planning of the current Assessment was started early in 2013. The Cochairs considered suggestions from the Parties regarding experts from their countries who could participate in the process. Two key changes were incorporated for the 2014 Assessment: (1) creation of a Scientific Steering Committee consisting of the Cochairs and four other prominent scientists; and (2) instituting Chapter Editors for each chapter to ensure that the reviews were adequately and appropriately handled by the authors and key messages were clearly enunciated to take them to the next level. For this reason, the Chapter Editors are also Coauthors of the Assessment for Decision Makers (ADM) of the
Scientific Assessment of Ozone Depletion: 2014. The plan for this Assessment was vetted by an ad hoc international scientific advisory group. This
group also suggested participants from the world scientific community to serve as authors of the science chapters, reviewers, and other roles. In addition, this advisory group contributed to crafting the outline of this Assessment report. As in previous Assessments, the participants represented experts from the developed and developing world. The developing country experts bring a special perspective to the process, and their involvement in the process has also contributed to capacity building in those regions and countries.
The 2014 Scientific Assessment Panel (SAP) Report
The 2014 report of the Scientific Assessment Panel differs from the past seven reports in its structure and mode of publication. However, as in the past, it is a thorough examination and assessment of the science. The process by which this report was generated, as in the past, was also thorough; the documents underwent multiple reviews by international experts.
The Structure of the 2014 Report
The previous SAP reports have served well the Parties to the Montreal Protocol, the scientific community, and the managers who deal with the research activities. However, the Montreal Protocol process has matured significantly and its needs have evolved. It was clear from the discussions between the Cochairs and both the Party representatives and the people involved in decision making that the previous very lengthy assessment reports would not meet the current needs of the Parties for a short, pithy, document that is written for them and not for the scientific community. Yet, it was also clear that the integrity of and the trust in the SAP reports come from the very thorough assessment of the science. Therefore, this 2014 Assessment was restructured to serve both purposes. The new structure is shown schematically below. First, as in the past, a major scientific assessment process was carried out and the findings from these discussions and reviews constitute the five major chapters of the assessment foundation from the scientific community. This is shown on the left hand side of the diagram. The five scientific chapters are published only on the web but are an integral part of the 2014 SAP report to the Parties. Also, as discussed earlier, the assessment of the surface UV changes due to past ozone depletion or to projected future ozone levels is not included in this document. Readers are referred to the 2014 Environmental Effects Assessment Panel report for the UV discussion.
Second, the findings from the SAP’s five scientific chapters were then synthesized and written in a language that is accessible to the Parties to the Protocol. The contents of the Assessment for Decision-Makers document—an Executive Summary and three sections—are shown on the right hand side. This short document, which contains all the major scientific summary points written in a clear and accessible language, is available in print and on the web. It is hoped that this new document will be useful to and usable by the Parties to the Protocol, countries, and high-level policymakers and managers. If more scientific details are needed, the complete document can be accessed via the web. Third, for this Assessment, the Twenty Questions and Answers About the Ozone Layer has been only updated. This is because the overarching scientific understanding has not changed significantly from the previous Assessment. The update will ensure that the answers include the most current data and are consistent with the 2014 Assessment. These updated questions and answers are published separately (both in print and on the web) in a companion booklet to this report.
It is hoped that these steps will enhance the usefulness of the document to the Parties, meet the needs of the multiple user communities for the information, minimize the workload of the scientific community, and reduce costs.
The Process of Preparing the 2014 Assessment
The initial plans for the scientific chapters of the 2014 Scientific Assessment Panel’s report were examined at a meeting that occurred on 10–11 June 2013 in Cambridge, UK. The Lead Authors, the Scientific Steering Committee, and Chapter Editors—along with a few representatives of other assessment panels and organizations—focused on the planned content of the chapters and on the need for coordination among the chapters.
The first drafts of the scientific chapters were mailed to 213 experts for written reviews. The chapters were revised to take into account the comments of the reviewers. The revised drafts were subsequently sent to 65 reviewers who either attended a review meeting in Boulder or communicated their comments back to the group. These second drafts were reviewed by 63 experts in person in Boulder, CO, USA during 8–10 April 2014. Final changes to the chapters were decided upon at this meeting, and the final chapter summary points were agreed. Subsequently, the chapters were revised for clarity and to address specific points that were agreed to at the Boulder meeting. Final drafts of the scientific chapters were completed in May 2014.
Subsequent to the finalization of the five chapters, an author team consisting of the Scientific Steering Committee, Chapter Lead Authors, and Chapter Editors wrote a draft of the Assessment for Decision-Makers (ADM). This document was based on the science findings of the five chapters. The draft ADM was made available on June 13 to the attendees of a Panel Review Meeting that took place in Les Diablerets, Switzerland, on 23–27 June 2014. The overall ADM was reviewed, discussed, and agreed to by the 59 participants. The Executive Summary of the ADM, contained herein (and posted on the UNEP and WMO websites on 10 September 2014), was prepared and completed by the attendees of the Les Diablerets meeting.
The final result of this two-year endeavor is the present assessment report. As the accompanying list indicates (Appendix A), the Scientific
Assessment of Ozone Depletion: 2014 is the product of 285 scientists from 36 countries4 of the developed and developing world who
contributed to its preparation and review (130 scientists prepared the report and 220 scientists participated in the peer review process).
4 Argentina, Australia, Austria, Belgium, Botswana, Brazil, Canada, People’s Republic of China, Comoros, Costa Rica, Cuba, Czech Republic, Denmark, Finland, France, Germany, Greece, India, Israel, Italy, Japan, Korea, Malaysia, New Zealand, Norway, Poland, Russia, South Africa, Spain, Sweden, Switzerland, The Netherlands, Togo, United Kingdom, United States of America, Zimbabwe.
Contents
Executive Summary
ES-1
Preface
i
Introduction
1
Policy-Relevant Highlights from the 2014 Ozone Assessment
3
1.
Current State of Ozone-Depleting Substances, Their Substitutes, and the Ozone Layer
5
2.
Future Issues Regarding Ozone-Depleting Substances and Their Substitutes
15
3.
Evolution of the Global Ozone Layer
19
4.
Evolution of Polar Ozone
23
5.
Past Stratospheric Ozone Changes and Climate
27
6.
The Future of the Ozone Layer
29
Additional Information of Interest to Decision-Makers
33
Metrics for Changes in Ozone and Climate
35
Scenarios and Sensitivity Analyses
41
Appendices
A-1
A.
Authors, Contributors, Reviewers, and Other Participants in the 2014 Ozone Assessment
A-3
B.
Chapter Scientific Summaries
A-9
C.
Atmospheric Lifetimes for Selected Long-Lived Halocarbons
A-21
D.
Ozone Depletion Potentials (ODPs) for Long-Lived Halocarbons
A-22
E.
Estimated Ozone Depletion Potentials (ODPs) for Short-Lived Halocarbons as a
Function of Their Emissions Location
A-23
F.
Global Warming Potentials (GWPs) and Global Temperature change Potentials (GTPs)
of Various Halocarbons
A-24
G.
Lifetime and Full Uncertainty Estimates of Global Warming Potentials (GWPs) of
Selected Hydrofluorocarbons (HFCs)
A-25
H.
Indirect Global Warming Potentials (GWPs) from Ozone Depletion
A-26
I.
Mixing Ratios of the ODSs Considered in the Baseline (A1) Scenario
A-27
J. Acronyms
A-29
The science of the stratospheric ozone layer and the ability to forecast its future have greatly advanced over the past few decades. In concert with this scientific development, the policy to avoid and mitigate ozone layer depletion has been successfully developed and implemented by the Montreal Protocol and its many Amendments and adjustments. The Protocol mandated periodic reports on the state of the ozone layer, ozone-depleting substances, and the future of the ozone layer. The Scientific Assessment Panel (SAP) was charged to prepare the reports under the auspices of the United Nations Environment Programme and the World Meteorological Organization. This quadrennial assessment of the science of the ozone layer has been one of the key components of the architecture of this science-policy enterprise. The SAP has also produced interim reports over the past decades on specific topics requested by the Parties. In addition, reports produced prior to the adoption of the Montreal Protocol helped pave the way for the Protocol and the SAP.
Findings of the Previous (2010) SAP Report
This 2014 report is the eighth full report by the SAP. To place the current Assessment in context, we briefly recap the major conclusions of the previous (2010) report:
• By successfully controlling the emissions of ozone-depleting substances (ODSs), the Montreal Protocol has protected the ozone layer from much higher levels of depletion. The Montreal Protocol also has had co-benefits for climate, because many ODSs are also greenhouse gases.
• The abundances of ODSs in the atmosphere are responding as expected to the controls of the Montreal Protocol. • Atmospheric observations of ozone continue to show that the ozone layer is not depleting further, but it is too soon to
determine if the recovery has started.
• The ozone layer and climate change are intricately coupled, and climate change will become increasingly more important to the future of the ozone layer.
• The impact of the Antarctic ozone hole on surface climate is becoming evident.
• The ozone layer and surface ultraviolet (UV) radiation are responding as expected to the ODS reductions achieved under the Montreal Protocol.
• Options for further limiting future emissions of ODSs could advance recovery dates by a few years; however, the impact on future ozone levels would be less than what has already been accomplished by the Montreal Protocol.
The 2014 SAP Report and Its Assessment for Decision-Makers
The five scientific chapters of the 2014 report build on the findings of the 2010 report and its predecessors. The information from the 2014 scientific chapters has been synthesized in this Assessment for Decision-Makers (ADM). All the findings of the ADM are traceable to the five scientific chapters.
The ADM has a high-level Executive Summary and policy-relevant highlights from the scientific chapters, presented in three levels of detail. Addtional information that is useful for decision-makers is also included. Appendices contain the key findings of all the scientific chapters, as well as additional tables.
This section of the Assessment for Decision-Makers presents policy-relevant highlights from the five scientific chapters of the 2014 Assessment. A high-level overarching finding appears in a light blue box at the start of each of the six topics shown above. Each of the six topics then presents major highlights in yellow boxes, with some additional information following the yellow highlights. This format allows the document to be viewed at various levels—a quick read of the six overarching findings (blue boxes) to get an overview of the state of the ozone layer issue, as well as a more detailed read of the highlights relevant to decision-makers (yellow boxes and their supporting detail). The underlying chapter material for the major highlights is indicated in [blue brackets]. See the relevant chapter for any cited references, figures, tables, and sections.
1. Current State of Ozone-Depleting Substances, Their Substitutes,
and the
Ozone Layer
2. Future Issues Regarding Ozone-Depleting Substances and Their
Substitutes
3. Evolution of the Global Ozone Layer
4. Evolution of Polar Ozone
5. Past Stratospheric Ozone Changes and Climate
6. The Future of the Ozone Layer
POLICY-RELEVANT HIGHLIGHTS FROM
THE 2014 OZONE ASSESSMENT
Compliance with the Montreal Protocol is assessed in this report based on the measured abundances of controlled ozone-depleting substances (ODSs) in the troposphere from ground-based networks. Observations of atmospheric abundances of these chemicals and their degradation products also come from: episodic airborne and ground-based “snapshot” measurements; ground-based overhead column and profile measurements of tropospheric and stratospheric abundances; stratospheric balloon-borne and airborne measurements; and satellite-based measurements that provide global coverage. The tropospheric abundances of ODSs are used with modeling calculations to estimate stratospheric abundances of chlorine- and bromine-containing chemicals, which are checked against measurements from satellite, ground-based, and episodic aircraft and balloon-borne instruments. Fluorinated chemicals produced from the degradation of ODSs and their substitutes do not deplete ozone. They are also measured and tracked, as they provide another consistency check on the measured abundances of the ODSs. Reconciliation of the observed tropospheric abundances of the ODSs with their known emission inventory requires values of their atmospheric lifetimes. The lifetimes are, in general, quantified using laboratory data, atmospheric observations, and atmospheric model calculations. If the lifetime of an individual species is known, the observed atmospheric abundance can be used to derive its historical global emission.
The data sets obtained are used to calculate the effects of ODSs, ODS substitutes, and related chemicals on stratospheric ozone (via the Equivalent Effective Stratospheric Chlorine (EESC) and Ozone Depletion Potential (ODP)-weighted emissions; see Box ADM 1-1) and Earth’s climate (via changes in radiative forcing (RF) and Global Warming Potential (GWP)-weighted emissions; see Box ADM 1-2). The tropospheric abundances are also used as key input to chemistry-climate models to calculate past, present, and future levels of stratospheric ozone abundances.
Future ODS levels depend on future production, emissions from existing banks (which are ODSs that have already been manufactured but not yet released to the atmosphere), and how quickly the atmosphere is cleansed of ODSs already there. The last factor requires knowledge of the atmospheric lifetimes of the individual ODSs. The baseline scenario assumes that controlled ODS emissions will be limited to future production allowed by the Montreal Protocol (complete compliance with the current agreement), and that there are no further Amendments and adjustments (e.g., the uncontrollable emissions from banks are left as they are). Clearly, future ODS levels could be further reduced by reducing or eliminating future production and/or recovering existing banks. The potential gains from such actions are quantified by comparing the changes in EESC, ODP-weighted emissions, RF, and GWP-weighted emissions for the different scenarios.
Total tropospheric organic chlorine from methyl chloride (CH3Cl) and controlled ODSs 5 continued to decrease between 1996
and 2012, reaching 3210 parts per trillion (ppt) in 2012. The observed abundances of various classes of compounds and individual
compounds that contributed to the total tropospheric chlorine between the two years are shown in Figure ADM 1-1.
During the period 2008–2012, the decline in tropospheric chlorine from controlled substances was 13.4 ± 0.9 ppt per year 6, with
major contributions from ODSs listed in Table ADM 1-1. The annual rate of decrease in the sum of chlorine during this period is about
50% smaller than the maximum annual decrease rate observed between 1996 and 2001, the period when the atmospheric abundance of methyl chloroform was declining more rapidly.
Increasing hydrochlorofluorocarbon (HCFC) abundances partially offset the tropospheric chlorine decline from decreasing levels of CFCs, carbon tetrachloride (CCl4), and methyl chloroform (CH3CCl3). HCFCs accounted for 286 ± 4 ppt of the total current
1. Current State of Ozone-Depleting Substances, Their Substitutes,
and the Ozone Layer
Actions taken under the Montreal Protocol led to decreases in the atmospheric abundance of controlled
substances, mitigating climate change and enabling the projected return of the ozone layer to the 1980 levels.
Highlight 1-1
The sum of the abundances of substances controlled under the Montreal Protocol continues to decrease. Measured atmospheric abundances of the main controlled ODSs are changing largely as projected, although gaps in understanding remain, particularly for carbon tetrachloride (see Highlight 2-1). Most of the major controlled ODSs are decreasing, while hydrochlorofluorocarbons and halon-1301 are still increasing (see Tables ADM 1-1 and 1-2). [Chapter 1: Sections 1.2, 1.4]
5 Organic chlorine refers to the chlorine atoms contained in the ODSs. 6 All uncertainties are one standard deviation unless otherwise specified.
6
atmospheric chlorine. The combined abundance of HCFCs is increasing at roughly 3.2% per year, which is roughly 25% slower than the rate reported in the last Assessment. The recent usage of HCFCs has been smaller than what would be allowed by the 2007 adjustments to the Montreal Protocol. The slower growth may be due to national controls and various market factors.
Total organic bromine from controlled ODSs continued to decrease in the troposphere and by 2012 was 15.1 ± 0.2 ppt (Figure ADM 1-2); the current value is approximately 2 ppt below the observed 1998 peak level. The observed abundances of various classes
of compounds and individual compounds that contributed to the total tropospheric bromine-containing chemicals for 1998 and 2012 are shown in Figure ADM 1-2. The decrease in total tropospheric bromine was primarily due to the decrease in methyl bromide (CH3Br)
emissions, with some recent contributions from an overall decrease in halons in the atmosphere.
Total organic bromine from halons had stopped increasing in the 2005–2008 period, and is now decreasing. During the period
2008–2012, the decline in tropospheric bromine from controlled substances was 0.13 ppt Br per year, with major contributions from ODSs listed in Table ADM 1-2.
Table ADM 1-1. Contributions of various ozone-depleting substances to tropospheric organic chlorine
in 2012 and the average annual trend between 2008–2012. Units are parts per trillion (ppt).
Source Abundance in 2012(ppt Cl)* Contribution to Trend(ppt Cl/yr)
Controlled under the Montreal Protocol
chlorofluorocarbons (CFCs) 2024 ± 5 −13.5 ± 0.5 methyl chloroform (CH3CCl3) 16 ± 1 −4.1 ± 0.2 carbon tetrachloride (CCl4) 339 ± 5 −4.9 ± 0.7 hydrochlorofluorocarbons (HCFCs) 286 ± 4 +9.2 ± 0.3 Not controlled** methyl chloride (CH3Cl) 540 ± 5 −1.7 ± 1.3
* A few other chemicals (e.g., halon-1211) that together make a minor contribution are not shown.
** CH3Cl is almost exclusively of natural origin. A few very short-lived anthropogenic chlorine-containing compounds, which are not controlled under the Montreal Protocol, also contribute to stratospheric chlorine. The estimated contribution was 91 ppt Cl in 2012, which is mostly due to dichloromethane (CH2Cl2) and chloroform (CHCl3).
CFC-11 CFC-12 CH3Cl CFC-113 CCl4 HCFCs CH3CCl3
Tropospheric Chlorine Source Gases
1996 3522 ppt Totals CFC-11 CFC-12 CH3Cl CFC-113 CCl4 HCFCs CH3CCl3 Anthropogenic Sources Natural Sources 3210 ppt 2012
Figure ADM 1-1. Total tropospheric chlorine from tropospheric
abundances of various chlorine-containing ODSs and methyl chloride in 1996 and 2012 (in units of parts per trillion). It is important to note that methyl chloride is mostly natural with a minor (~1%) anthropogenic contribution. The minor contributions from halon-1211 and chloro-fluorocarbons (CFCs) other than CFC-11, -12, and -113 are shown as an unlabeled component (the thin red bar below CCl4). The abundances
shown provide a measure of the contributions by the various ODSs to chlorine in the stratosphere. Very short-lived chlorine-containing substances are estimated to contribute 91 ppt of stratospheric chlorine; they are not included in this figure.
The EESC for midlatitudes and the polar regions calculated from observed tropospheric abundances of the long-lived ODSs reached their maximum value during the years 1997 and 2001, respectively (see Box ADM 1-1). The decrease from the peak values
to the 2012 values represents about 40% of the decrease required for EESC in midlatitudes to return to the 1980 benchmark level, and about 20% of the decrease required for EESC in the Antarctic to return to the 1980 benchmark level. The EESC is calculated from observed abundances of well-mixed source gases in the troposphere and does not include the contribution from very short-lived substances (VSLS).
Three CFCs (-112, -112a, -113a) and one HCFC (-133a) that have recently been detected in the atmosphere make a small (~0.1%) contribution to the current EESC. These chlorine-containing compounds are already listed in the Montreal Protocol. Abundances of
CFC-112 and CFC-112a are declining, while those of CFC-113a and HCFC-133a are increasing. Combined, they have increased at less than 0.5 ppt of Cl per year. The sources of these chemicals are not known.
Hydrogen chloride (HCl), a good proxy for reactive chlorine in the mid- to upper stratosphere, is decreasing. Its decline is roughly consistent with the observed changes in the tropospheric abundances of the chlorine-containing ozone-depleting substances. Satellite-derived measurements of HCl (50°N–50°S) in the mid- to upper stratosphere show a decline of 0.6% ± 0.1%/yr,
on average, between its maximum value in 1997 and that in 2012. The column amounts of HCl in the stratosphere measured at ground stations have also shown the same long-term decline. However, some recent observations also showed small increases in the column over shorter time periods of four to seven years. These are likely due to variability of transport in the lower stratosphere.
Table ADM 1-2. Contributions of various bromine-containing ODSs to
the total tropospheric organic bromine in 2012*, along with the average annual trend between 2008 and 2012. Units are parts per trillion (ppt).
Source Abundances in 2012 (ppt Br) Contribution to Decline# (ppt Br/yr) CH3Br 7.01 ± 0.08 −0.08 ± 0.02 halon-1211 3.97 ± 0.06 −0.07 halon-1301 3.26 ± 0.06 +0.03 halon-2402 0.9 −0.01
* Several very short-lived bromine compounds also contribute to stratospheric bromine at ~ 5 ppt.
# Uncertainties in some quantities are very small and they are not shown.
Highlight 1-2
By 2012, Equivalent Effective Stratospheric Chlorine (EESC) had declined by about 10% in the Antarctic and about 15% in midlatitudes from their peak values of ten to fifteen years ago. Decreases in atmospheric abundances of CH3CCl3, CH3Br, and
CFCs contributed approximately equally to these reductions. [Chapter 1: Sections 1.2.1, 1.4.4]
Highlight 1-3
Measured stratospheric abundances of chlorine- and bromine-containing substances originating from the degradation of ODSs in the stratosphere are decreasing, consistent with the control measures of the Montreal Protocol. [Chapter 1: Section 1.4]
Natural Sources Anthropogenic Sources CH3Br CH3Br halon-1301 halon-1211 halon-1211 halon-1301 Other Other
Tropospheric Bromine Source Gases
Totals
1998
2012
17.1 ppt 15.1 ppt
Figure ADM 1-2. Total bromine from tropospheric abundances of various
bromine-containing ODSs that contribute to bromine in the stratosphere in 1998 and 2012 (in units of parts per trillion). It is important to note that methyl bromide has both natural and anthropogenic sources and they are shown together, but demarcated by a line. Contributions of very short-lived bromine compounds are not included. The rounding-off errors lead to the small differences between the values shown in this figure and those listed in Table ADM 1-2.
8
Box ADM 1-1: Ozone Depletion Metrics
Equivalent Effective Stratospheric Chlorine (EESC)
On a per-atom basis, the effectiveness of bromine is about sixty times that of chlorine for destroying stratospheric ozone. Bromine and chlorine that are contained in the ODSs are released from their parent molecules to different extents in various parts of the stratosphere. Further, the time it takes for the ODSs released at the surface to reach different parts of the stratosphere varies. For example, it takes longer for an air parcel to reach the polar stratosphere than the midlatitude stratosphere. To account for these three factors that influence the fraction of the active chlorine and bromine available from the ODSs to destroy stratospheric ozone, a metric called Equivalent Effective Stratospheric Chlorine (or EESC) is used.
EESC is the sum of chlorine and bromine in the stratosphere derived from ODS tropospheric abundances, weighted to reflect their ability to deplete stratospheric ozone. Its value at any location in the stratosphere depends on the time it took (on the order of years) for the air
from the troposphere with given tropospheric abundance to reach that location. Therefore how the EESC changes with time (its time to reach the maximum value, and its rate of decline) is different in different regions of the stratosphere, as shown below for midlatitude and polar regions. These factors are taken into account in discussing ozone layer depletion, the ozone layer’s recovery from the effects of ODSs, and the contributions of various factors to the changes in the ozone layer. Note that EESC is not a useful proxy for ozone change in the tropical lower stratosphere, where ozone depletion due to ODSs is small. More information about EESC is provided in the “Additional Information of Interest to Decision-Makers” section of this report, as well as Chapter 5 of this 2014 Assessment.
Ozone Depletion Potential (ODP) and ODP-Weighted Emissions
Ozone Depletion Potential (ODP): This is a measure of the integrated (from the moment it is emitted to when the source gas is
completely removed from the atmosphere) amount of ozone depletion from a one-time (pulse) emission of an ODS, as compared to the integrated ozone depletion by a simultaneous one-time (pulse) emission of the same weight of CFC-11. By definition, CFC-11 has an ODP value of 1.
ODP-Weighted Emissions: This quantity is the product of the ODP of an ODS and the weight of that ODS emitted into the atmosphere.
The unit is ODP-tonnes. This product yields a relative measure of the expected ozone depletion from the emitted amount of the ODS before it is completely removed from the atmosphere, and enables comparisons of emissions of different ODSs on the ozone layer.
Total inorganic stratospheric bromine (Bry) 7, derived from observations of stratospheric bromine monoxide (BrO), was 20 (range
16–23) ppt in 2011. Observed BrO has decreased at 0.6 ± 0.1%/yr between 2001 and 2012. This decline in Bry provides direct evidence
that reactive stratospheric bromine has decreased, consistent with the decrease in total tropospheric organic Br based on measured abundances of CH3Br and halons in the troposphere.
There is further evidence that very short-lived substances (VSLS) containing bromine (CH2Br2, CHBr3, CH2BrCl, CHBr2Cl, CHBrCl2)
contribute ~5 (2–8) ppt toward the observed total stratospheric Bry of ~20 ppt. The current estimate of ~5 (2–8) ppt is slightly smaller
than the 6 (3–8) ppt reported in the last Assessment primarily due to the revised estimates of the partitioning in the stratosphere between the observed BrO molecule and Bry.
1980 1990 2000 2010
EESC (ppt)
polar
midlatitudes
EESC as a function of year. Equivalent Effective Stratospheric Chlorine
(EESC) was calculated (in units of parts per trillion) for the midlatitude and polar stratosphere based on global mean tropospheric abundances measured at the surface. It is assumed that, on average, air reaches stratospheric midlatitudes in roughly 3 (±1.5) years and stratospheric polar regions in 5.5 (±2.8) years. Tropospheric abundances of the following ODSs are included: CFC-11, CFC-12, CFC-113, CFC-114, CFC-115, CFC-112, CFC-113a, CH3CCl3, CCl4, HCFC-22, HCFC-141b, HCFC-142b, halon-1211,
halon-1301, halon-1202, halon-2402, CH3Br, and CH3Cl. Note that the EESC
in the polar regions, where essentially all the ODSs have decomposed to yield chlorine and bromine compounds that can destroy ozone, is more than a factor of two higher than at midlatitudes.
7 Inorganic bromine, denoted collectively by Br
y , are chemicals produced by the degradation of bromine-containing ODSs in the stratosphere. A fraction of these chemicals can catalytically destroy ozone, whereas a significant fraction of them are inactive toward ozone destruction. However, there is interconversion between the catalytically active and inactive forms.
Figure ADM 1-3. Calculated EESC (in parts per trillion) for midlatitudes between 1955 and 2100. The various scenarios for the future are shown in the legend.
Fluorine-containing substances are also produced from the degradation of ODSs and their substitutes. Measured abundances of the sum of stratospheric fluorine product substances (predominantly HF and COF2) increased by about 1%/yr between 2008
and 2012. This increase in fluorinated substances is consistent with changes in measured abundances of fluorinated compounds (CFCs,
HCFCs, and hydrofluorocarbons (HFCs)) in the troposphere and their degradation in the stratosphere. The most recent increase was smaller (on a percentage basis) than during the early 1990s, when the abundances of fluorine-containing ODSs were increasing rapidly.
The estimated lifetime of CFC-11 is revised from 45 years to 52 years, with the most likely value lying between 43 and 67 years.
The longer lifetime leads to better agreement between the emissions estimated based on inventories with those derived from atmospheric observations of 11. This change in 11 lifetime alters the Ozone Depletion Potential (ODP) values for the other ODSs, because CFC-11 is the reference gas for determining ODPs.
EESC for the “baseline scenario” was calculated using the estimated lifetimes and projected emissions associated with assumed future productions and from banks. As in past Assessments, the dates by which EESC decreases to its 1980 values in the midlatitude and polar regions are presented as indicators of when ozone would return to the 1980 levels, if other factors that influence the ozone layer do not change (e.g., climate and abundances of other chemicals that directly and indirectly influence stratospheric ozone). The baseline scenario assumes that controlled ODS emissions will be limited to future production allowed by the Montreal Protocol (complete compliance with the current agreement), and that there are no further Amendments and adjustments (e.g., the uncontrollable emissions from banks are left as they are).
EESC derived from projected atmospheric abundances of ODSs using the updated atmospheric lifetimes is not significantly different from the EESC given in the 2010 Assessment. The updated atmospheric lifetimes from SPARC (Stratosphere-troposphere
Processes And their Role in Climate, 2013) are used to predict the future tropospheric abundances of the long-lived ODSs for the baseline scenario. The tropospheric values are then used to calculate EESC shown in Figure ADM 1-3 for the midlatitude stratosphere.
1960 1980 2000 2020 2040 2060 2080 2100 0 500 1000 1500 2000 Current Baseline No Future Emissions Zero 2015 Bank Zero 2020 Bank No Future Production WMO (2011) Year EESC (ppt) Highlight 1-5
The current best estimates for when EESC will return to its 1980 values are around 2050 for the midlatitudes and around 2075 for the Antarctic. [Chapter 5: Section 5.4.3, Table 5-8]
Highlight 1-4
The estimated lifetimes and their uncertainties for key long-lived ozone-depleting and related substances are better quantified following the SPARC Lifetimes Assessment (Stratosphere-troposphere Processes And their Role in Climate, 2013) (see Appendix C). These updates decreased the calculated Ozone Depletion Potentials (ODPs) for most ODSs by 10% to 30%, in large
part due to an increase in the recommended lifetime of CFC-11. However, these changes do not significantly change model projections of future stratospheric abundances of chlorine, bromine, or ozone. [Chapters 1, 2, and 5: Sections 1.2.1.1, 2.4.1, 5.3.1, Table 5-2]
10
Emissions from the current banks (in 2015) over the next 35 years are projected to contribute more to ozone depletion over the coming few decades than emissions associated with future ODS production, assuming compliance with the Montreal Protocol (Figure ADM 1-4).
The halon and CFC banks are projected to contribute roughly equally to future ozone depletion. However, the halon banks are more amenable to recapture than the CFC banks.8 Capture and destruction of CFC, halon, and
HCFC banks could avoid 1.8 million ODP-tonnes of future emission through 2050, while the future production could contribute roughly 0.85 million ODP-tonnes, assuming compliance with the Protocol. These values are to be compared with an estimated 1.6 million ODP-tonnes of emissions from banks between 2005–2014.
Midlatitude EESC, the metric used to estimate the extent of chemical ozone layer depletion, will return to its 1980 values between 2040 and 2060 (see Figure ADM 1-3). Model simulations that take into account the effects on ozone from ODSs and GHGs provide estimates for return dates of total column ozone abundances to 1980 levels. These calculated ranges
of dates within which we expect the return of ozone to 1980 values have not changed since the last Assessment. They are:
• 2025 to 2040 for global mean annually averaged ozone (see Fig. ADM 1-5) • 2030 to 2040 for annually averaged Southern Hemisphere midlatitude ozone • 2015 to 2030 for annually averaged Northern Hemisphere midlatitude ozone • 2025 to 2035 for springtime Arctic ozone (see Figure ADM 1-6)
• 2045 to 2060 for springtime Antarctic ozone (see Figure ADM 1-6)
Highlight 1-6
Total column ozone will recover toward the 1980 benchmark levels over most of the globe under continued compliance with the Montreal Protocol. [Chapter 2: Sections 2.4 and 2.5]
CCl4 CH Br3 HCFCs halons CFCs HCFCs HCFCs
2.0
0.8
0.4
1.2
1.6
0.0
Production 2015 Banks
M
illions of ODP
-W
eight
ed
Tonnes
Figure ADM 1-4. A comparison of the cumulative projected emissions
from current banks of the CFCs, halons, and HCFCs between 2015 and 2050 with the cumulative projected emissions from production of ODSs during the same period.
-6 -3 0 3 6 T o tal O z o n e C o lu mn C h a ng e (% ) Models ±2σ Observations 1960 0 1000 2000 EESC (p pt ) Equivalent Effective Stratospheric Chlorine
total ozone column 60°S-60°N
2000 2040 2080
1960 2000 2040 2080
Figure ADM 1-5. Top Panel: Variation in EESC at midlatitudes between 1960 and 2100. The future EESC is for the baseline scenario
(described in the text before Highlight 1-1). Bottom panel: The average total column ozone changes over the same period, from multiple model simulations (see Chapter 2), are shown as a solid gray line. This is compared with the observed column ozone changes between 1965 and 2013 (blue line), the period for which observations are available.
8 IPCC-TEAP Special Report, Safeguarding the Ozone Layer and the Global Climate System: Issues Related to Hydrofluorocarbons and Perfluorocarbons, Cambridge University Press, Cambridge, U.K., 488 pp., 2005.
Tropical column ozone is projected by models to remain below 1980s values over the coming decades because of a strengthened Brewer-Dobson circulation (see Box ADM 3-1, page 21) from tropospheric warming due to increased greenhouse gases (see Highlight 3-4), which acts to decrease ozone in the tropical lower stratosphere.
Model results suggest that global stratospheric ozone depletion due to ODSs did occur prior to 1980. The midlatitude EESC was
about 570 ppt in 1960 and nearly 1150 ppt by 1980 (see Figure ADM 1-3). The 1980 baseline for ozone recovery was chosen, as in the past Assessments, based upon the onset of a discernible decline in observed global total column ozone. Between 1960 and 1980, the depletion was not large enough to be clearly distinguishable from the year-to-year variability, especially given the sparsity of observations. If the 1960 value were chosen as the baseline, the EESC would return to that value well after 2100 (see Figure ADM 1-3 and Figure ADM 1-5 top panel).
Box ADM 1-2: Climate Metrics
There are many metrics used to measure the influence of a chemical or an emission on the climate system. The choice of metric depends on the issue being addressed. The most common of these metrics are: (1) radiative forcing (RF); (2) Global Warming Potential (GWP); (3) GWP-weighted emissions; and (4) Global Temperature change Potential (GTP). These four metrics are briefly described below in simple terms. Further details can be found in the “Additional Information of Interest to Decision-Makers” section of this document, as well as Chapter 5 of this 2014 Assessment and references therein.
Radiative Forcing (RF): This is a measure of the change in the radiation flux from the troposphere due to the presence of a greenhouse
gas (GHG) in the atmosphere. There are various constraints on how this is calculated. RF is not an observed quantity, but can be estimated from the molecular properties and atmospheric abundance of the GHG, and atmospheric properties. This metric allows comparison of different forcing agents and is based on there being a clear relationship between the globally averaged radiative forcing and the globally averaged annual mean surface temperature.
Global Warming Potential (GWP): This represents the climate effect from a pulse emission of a GHG by integrating the radiative forcing
over a specific time interval and comparing it to the integrated forcing by emissions of the same weight of CO2. It is a relative measure,
very roughly speaking, of the total energy added to the climate system by a component under consideration relative to that added by CO2 over the time period of the chosen time horizon. The choice of the time horizon is based on policy choices. The most common
choice is 100 years. In this report, the 100-year GWP (GWP100) is used unless specified otherwise. GWP is the most widely used metric
for assessing the climate impact of GHGs.
GWP-Weighted Emissions (gigatonnes CO2-equivalent): This quantity is the product of the mass of a substance emitted and its GWP100
and expressed in gigatonnes CO2-equivalent. This product yields a simple measure of the future time-integrated climate impact of an
emission.
Global Temperature change Potential (GTP): This is a relative measure of the temperature increase at a specific time horizon per unit
mass pulse emission of a GHG relative to that for the emission of the same mass of CO2. This quantity is calculated using climate models.
As in the case of GWPs, GTPs can be calculated for any time horizon of choice. This metric is not used in the current Assessment, but is used in the recent IPCC Assessment. Readers are referred to the IPCC Assessment 9 for the GTP values. GTP-weighted emissions are
also calculated by multiplying the mass of emission by the GTP of that gas.
Total O
zone C
olumn C
hange (%)
Figure ADM 1-6. Total column ozone changes for the Arctic in March (left) and Antarctic in October (right). The red line is the model
average, while gray shading shows the model range (±2σ) (see Chapter 3). Satellite observations are shown in blue. This figure is a composite adaption of Figure 3-16 of Chapter 3 for the model output and Figure 3-4 of Chapter 3 for the observations.
9 IPCC AR5, Climate Change 2013: The Physical Science Basis, Contribution of Working Group I to the Fifth Assessment Report of the Intergovernmental Panel on Climate Change, Cambridge University Press, 1535 pp., 2013.
12
Releasing an ODS to the atmosphere will result in an increase in the atmospheric abundance of the ODS and a decrease in stratospheric ozone. Both changes affect the radiative forcing (RF) in the atmosphere. The change in forcing attributed to change in ODS abundance is referred to as the direct RF, while that due to change in ozone brought forth by the ODSs is referred to as indirect RF. A GWP value can be estimated for an emission based on the resulting direct or indirect forcing. Unless explicitly otherwise stated, in this section, the terms RF and GWP refer to the direct effect of the ODSs and do not include the contribution by the ozone changes caused by them. The baseline scenario referred to in this section is described in the introductory text before Highlight 1-1.
Over the past 10–20 years, the total direct radiative forcing (RF) from ODSs has stabilized at about 0.33 watts per square meter (W m-2) (see Figure ADM 1-7). This can be compared to the present-day forcing from CO
2 of about 1.8 W m-2 since 1750. The RF from the sum
of all ODSs is projected to decrease to around 0.20 W m-2 by about 2050, according to the baseline scenario. The future RF due to HFCs is
uncertain and will depend on future emission of specific compounds with markedly different GWPs.
The Montreal Protocol has caused a reduction in the sum of direct GWP-weighted emissions from ODSs and their substitutes (see Figure ADM 1-8).
Future production of HCFCs together with emissions from CFC and HCFC banks account for the majority (> 90%) of projected GWP-weighted emissions from all ODS sources. The contributions from banks and future production are comparable in magnitude
(see Figure ADM 1-9). The cumulative GWP-weighted emission between 2015 and 2050 from all controlled ODSs is projected to be 18.5 gigatonnes CO2-equivalent, an average of 0.5 gigatonnes CO2-equivalent per year. By comparison, CO2 emissions are currently about 36.7
gigatonnes per year.
Highlight 1-7
The radiative forcing from controlled ODSs and their substitutes has stabilized over the past two decades owing to the provisions of the Montreal Protocol. The forcing from controlled ODSs is expected to decrease in the future under compliance with the Protocol. [Chapters 1 and 5: Sections 1.6.3, 1.6.4, 5.4.4]
4 2 3 1 5 Radia tiv e F or cing ( W m ) -2 0 0.10 0.20 0.30 0.40 1980 1990 2000 2010 2020 2030 2040 2050 CFCs and HCFCs
Various HFC Scenarios Figure ADM 1-7. Plot of the radiative forcing by CFCs, HCFCs, and the HFCs
from 1980 to 2050. The course of future radiative forcing by CFCs and HCFCs is governed by the Montreal Protocol and is quite well determined (black line) assuming compliance with the Protocol. However, the future contributions by HFCs depend on the course of HFC use and emissions in the coming decades. Various possible scenarios for HFC emissions are shown. There are significant uncertainties in the various scenarios for HFCs.
Emissions
(gigatonnes CO
2
-equivalent per year)
Figure ADM 1-8. GWP-weighted emissions
of CFCs, HCFCs, HFCs, halons, and other ODSs between 1980 and 2012 in terms of their contribution to radiative forcing, in units of GWP-weighted emissions. See Box ADM 1-2 for the definition of GWP-weighted emission. The total, as indicated by the dashed line, has been decreasing since the peak in 1990. The GWP-weighted emissions from HFCs and HCFCs are now equal to those from the CFCs. The right panel shows an expanded view of the time period since 1995.
Previous Assessments provided estimates of changes in the indirect RF due to ODS-induced changes only in stratospheric ozone. This Assessment reports the estimated change in indirect RF due to ODS-induced changes in both stratospheric and tropospheric ozone levels. Note that this section addresses only how tropospheric ozone may respond to changes in ODS-induced stratospheric ozone depletion. There are other factors that also change tropospheric ozone, but they are not considered here. In addition, globally averaged RF may not be a good proxy for the expected climate response due to increased ODSs since the ozone changes caused by the ODSs in the lower stratosphere are not uniform across the globe.
Recent results from chemistry-climate models indicate that ODS-induced stratospheric ozone depletion has also acted to decrease tropospheric ozone. Ozone imported from the stratosphere is one of several sources for tropospheric ozone, and ozone changes in the
stratosphere also change the influx of UV radiation. Therefore, ozone depletion in the lower stratosphere alters tropospheric ozone levels.
The global mean indirect RF due to the combined effects of ODSs on tropospheric and stratospheric ozone is assessed to be −0.15 W m-2, of which approximately three quarters results from ozone changes in the stratosphere. This offsets part of the +0.33 W m-2
direct RF from increases in atmospheric ODS abundances. However, the large uncertainty range of −0.30 to 0 W m-2 could mean that its
estimated offset of the global mean RF due to ODS changes has a wide range, from almost complete to none. Recent research suggests that additional uncertainty may arise from how ozone depletion may influence clouds in the Southern Hemisphere.
CFC HCFC HCFC CCl4 0 2 4 6 8 10 Producon 2015Banks GWP-Weighted Emissions in gigatonnes CO 2 -equivalent Halon Production 2015 Banks
Figure ADM 1-9. Cumulative GWP-weighted emissions
of ODSs from banks between 2015 and 2050 and future production.
Highlight 1-8
The negative radiative forcing (RF) that comes from the effect of ODSs on stratospheric and tropospheric ozone levels could have offset a substantial part of the positive RF from atmospheric ODS abundances (see Highlight 1-7). [Chapters 4 and 5: Sections 4.4.2, 4.4.3, 5.4.4]
This section addresses a few key issues that were specifically requested by the Parties and those that bear watching in the coming years leading to the next Assessment. The details of the calculations and further information are given in the science chapters, but the essence of the information is captured here. The first topic deals with information on carbon tetrachloride (CCl4), which was requested by the Parties. The second topic
relates to hydrochlorofluorocarbons (HCFCs) and methyl bromide (CH3Br), two substances that are controlled under the Montreal Protocol. This
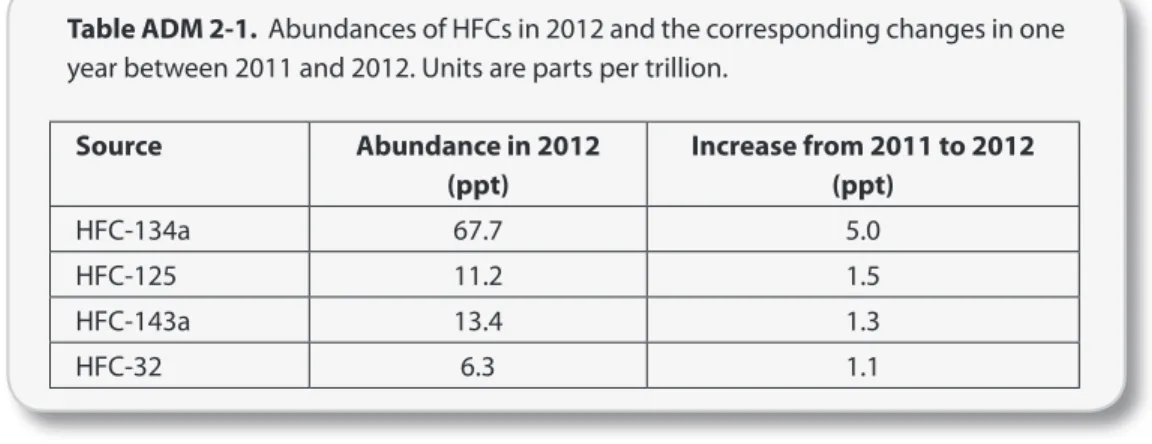
topic also includes chlorine- and bromine-containing very short-lived substances (VSLS), knowledge of which may enhance our ability to predict future Equivalent Effective Stratospheric Chlorine (EESC) from projected emissions. The third topic deals with hydrofluorocarbons (HFCs). HFCs are not ODSs since fluorine does not deplete the ozone layer. However, HFCs are related to ODSs because most HFCs in the atmosphere are from emissions associated with their use as ODS substitutes or unintended emissions from production of other chemicals (e.g., HFC-23 from HCFC-22 manufacture). For this reason, we also address the climate impacts from different HFC emission scenarios.
Over the past decade, the (top-down) emissions of CCl4 estimated from the observed atmospheric abundances and the estimated
lifetime are much larger than the (bottom-up) emissions derived from reported production and usage (see Figure ADM 2-1). New evidence indicates that poorly quantified sources, distinct from reported production, could contribute to the currently unaccounted emissions. The atmospheric abundances are the best quantified of the factors that determine the budget of CCl4. Unlike
the major CFCs, CCl4 is also removed from the atmosphere due to uptake by soil and ocean, with large uncertainties in these removal rates.
The current estimate of the total global lifetime (26 years) remains unchanged from the previous Assessment, although estimates of the relative importance of the ocean and soil uptake have been revised. When combined with the observed CCl4 trend in the atmosphere (−1.1
to −1.4 ppt/yr in 2012), a 26-year atmospheric lifetime and an uncertainty range of 22 to 32 years (this uncertainty range does not include uncertainty from uptake by soil and ocean) implies emissions of roughly 57 (40–74) gigagrams per year (Gg/yr), much larger than the values implied by the production and use data. There are reports of emissions of CCl4 from other sources not controlled by the Montreal
Protocol, but they do not appear to account for all of the difference between the two estimates.
A few key issues stand out regarding ODSs and their substitutes:
• Carbon tetrachloride (CCl
4) is not decreasing as rapidly as expected.
• Recoverable banks, hydrochlorofluorocarbon (HCFC) production, and quarantine and pre-shipment
(QPS) methyl bromide (CH
3Br) uses are major future sources of ODS emissions.
• The climate benefits of the Montreal Protocol could be significantly reduced by projected emissions
of the current mix of HFCs in the coming decades.
2. Future Issues Regarding Ozone-Depleting Substances
and Their Substitutes
Highlight 2-1
Derived emissions of carbon tetrachloride (CCl4), based on its estimated lifetime and its accurately measured atmospheric