DATA VISUALIZATION IN THE FIRST PERSON
Philip DeCampBS Electrical Engineering and Computer Science Massachusetts Institute of Technology, 2004 MS Media Arts and Sciences
Massachusetts Institute of Technology, 2008
Submitted to the Program in Media Arts and Sciences, School of Architecture and Planning, in partial fulfillment of the requirements for the degree of Doctor of Philosophy at the Massachusetts Institute of Technology February 2013
@ 2012 Massachusetts Institute of Technology. All rights reserved.
ARCHWES
LFs Fru~J
LliB3RA R I'
AUTHOR: Philip [ eCamp
Program in Media Arts and Sciences October 4, 2012
CERTIFIED BY: Deb Roy
Associate Professor edia Arts and Sciences Thesis Supervisor
4- 1 ACCEPTED BY: Prokxs Patric
Associate Ac ickead
DATA VISUALIZATION IN THE FIRST PERSON
Philip DeCampSubmitted to the Program in Media Arts and Sciences, School of Architecture and Planning, on October 4, 2012, in partial fulfillment of the requirements for the degree of Doctor of Philosophy at the Massachusetts Institute of Technology
Abstract
This dissertation will examine what a first person viewpoint means in the context of data visualization and how it can be used for navigating and
presenting large datasets. Recent years have seen rapid growth in Big Data methodologies throughout scientific research, business analytics, and online services. The datasets used in these areas are not only growing exponentially larger, but also more complex, incorporating heterogeneous data from
many sources that might include digital sensors, websites, mass media, and others. The scale and complexity of these datasets pose significant challenges in the design of effective tools for navigation and analysis.
This work will explore methods of representing large datasets as physical, navigable environments. Much of the related research on first person interfaces and 3D visualization has focused on producing tools for expert users and scientific analysis. Due to the complexities of navigation and perception introduced by 3D interfaces, work in this area has had mixed results. In particular, considerable efforts to develop 3D systems for more abstract data, like file systems and social networks, have had difficulty surpassing the efficiency of 2D approaches. However, 3D may offer advantages that have been less explored in this context. In particular, data visualization can be a valuable tool for disseminating scientific results, sharing insights, and explaining methodology. In these applications, clear communication of concepts and narratives are often more essential than efficient navigation.
This dissertation will present novel visualization systems designed for large datasets that include audio-video recordings, social media, and others. Discussion will focus on designing visuals that use the first person
perspective to give a physical and intuitive form to abstract data, to combine multiple sources of data within a shared space, to construct narratives, and to engage the viewer at a more visceral and emotional level.
THESIS SUPERVISOR: Deb Roy
Associate Professor of Media Arts and Sciences MIT Media Arts and Sciences
DATA VISUALIZATION IN THE FIRST PERSON
Philip DeCampTHESIS SUPERVISOR: Deb
Associate Professor of Media Arts and Sciences MIT Media Arts and Sciences
DATA VISUALIZATION IN THE FIRST PERSON
Philip DeCampTHESIS READER: Jdartin Wattenberg Computer Scientist and Artist Google, Inc
DATA VISUALIZATION IN THE FIRST PERSON
Philip DeCampTHESIS READER: Isabel (Aeirelles
Associate Professor of Graphic Design Northeastern University
Table of Contents
1 Introduction 13 1.1 Challenges 15 1.2 Approach 15 1.3 Applications 16 1.4 Terminology 172 The First Person 19
3 The Human Speechome Project 25
3.1 Setup 26 3.2 The Data 28 3.3 TotalRecall 31 3.4 Partitioned Views 34 3.5 Surveillance Video 35 3.6 HouseFly 37 3.7 Related Work 38
3.8 Constructing the Environment 39
3.9 Visualizing Metadata 46
3.10 Presenting HSP to an Audience 53
3.11 Wordscapes 57
3.12 First Steps: Making Data Personal 65
3.13 Additional Applications 68
4 Social Media 73
4.1 Connecting Social Media to Mass Media 74 4.2 Social Network Visualization 81
4.3 News Television 87
4.4 Visualization of the GOP Debate 89
5 Critique 95
6 Conclusions 99
1 Introduction
As this dissertation was being written, researchers at CERN an-nounced the confirmation of a subatomic particle likely to be the Higgs boson. Confirming the particle's existence to a significance of 4.9 sigmas involved the analysis of about 1015 proton-proton collisions [Overbye, 2012] using sensors that record over one pet-abyte of data each month [CERN, 2008]. When the Large Syn-optic Survey Telescope begins operation in 2016, it is expected to record image data at a rate of over one petabyte per year [Ste-phens, 2010]. Increasingly, scientific research is turning to massive datasets that no one person could hope to view in a lifetime, and that require dedicated data centers and processing farms just to access, let alone analyze.
Two years ago, the term "Big Data" entered our lexicon to refer to the growing trend of data analysis at very large scales, a trend that extends also to areas far beyond the hard sciences. Advances throughout information technologies have made it practical to collect and analyze data at scale in many areas where raw data was previously limited or prohibitively expensive. In particular, the explosion of online populations and communication devices, as well as digital sensors that are inexpensive enough to stick on ev-erything, have made it possible to collect data from vastly distrib-uted sources at little cost. The result has been a surge of interest in addressing a diverse range of problems, new and old, by applying massive amounts of computing to massive amounts of data. The Santa Cruz Police Department has recently begun using crime pattern analysis tools to plan daily patron routes for officers [Olson, 2012]. Tools have been built to analyze large corpora of legal documents in order to predict the outcome of patent litiga-tion and to aid in case planning [Harbert, 2012]. Several com-panies are developing commercial tools to optimize retail spaces
using data collected from in-store cameras, point-of-sale data, RFID tags, and others.
The most visible practitioners are the Internet companies: Google, Facebook, Amazon and others. These companies col-lect click-stream data, online transactions, communications, user generated content, and anything else that might be used to drive services for advertising, retailing, social networking, and general information retrieval. Nearly every person with a computer or phone is both a frequent contributor and consumer of informa-tion services that fall under the umbrella of Big Data.
Facebook alone counts about one-sixth of the world's population as its active users, who upload 300 million photographs every day
[Sengupta, 2012]. Users of YouTube upload over ten years of video every day [YouTube, 2012]. These social networking sites are now a significant part of our global culture, and offer some of the most extensive records of human behavior ever created. One of the most fascinating examples of data mining comes from the online data site, OkCupid, which has a corpus of the dating habits of around seven million individuals. Using this corpus, they have published findings on ethnic dating preferences, the interests that most strongly differentiate between heterosexuals and homosexu-als, and the seemingly random questions that best predict if a per-son might consider sex on a first date ("In a certain light, wouldn't nuclear war be exciting?") [Rudder, 2011]. The growing corpora of personal data offer new ways to examine ourselves.
And so the motivations for Big Data analysis are many, from scientific research, to mining business intelligence, to human cu-riosity. In turn, there are also many motivations to communicate effectively about Big Data, to explain what all this data is, dis-seminate scientific results, share insights, and explain methodol-ogy. These are all motivations behind the work described in this document, which will examine approaches to data visualization that make the analysis and communication of complex datasets clear and engaging.
1.1 Challenges
The datasets that will be examined in this document, like many of the datasets just described, pose several challenges to visualization. First, they are far too large to view completely. They generally require ways to view and navigate the data at multiple scales.
Second, they are heterogeneous, comprised of multiple kinds of data collected from many sources, where sources might be defined at multiple levels as people, websites, sensors, physical sites, tele-vision feeds, etc. Drawing out the relationships between multiple sources of data often requires finding effective methods of synthe-sis.
Third, they are usually unique in structure. The more complex the dataset, the less likely it is to resemble another dataset collect-ed in any other way. This places greater necollect-ed to develop special-ized visualization tools that work with a particular dataset. There are many ways of distilling a dataset, and for very large datasets, any visualization will involve significant compression. The structure of the database might be viewed diagrammatically. Large portions of data can be reduced to statistical summaries, in-dexes, or otherwise downsampled. Fragments can be shown in de-tail. Different sources or relationships can be viewed in isolation. But looking at only one such view can only show a small part or single aspect. Forming an understanding of the whole must be done piece-by-piece, and through the exploration of broad sum-maries, details, components, relationships, and patterns.
1.2 Approach
The approach this document takes towards visualization is to rep-resent large datasets as physical environments that provide a con-crete form to abstract and complex data, that can be explored and seen from multiple viewpoints, and that bring multiple sources of data into a shared space.
The goal is not just to show such an environment, but to place the viewer inside of it and present data from a first person per-spective. The intent is to tap into the viewers' physical common sense. When confronted with a physical scene, we have powerful abilities to perceive spatial structures and information that 2D or schematic representations do not exploit. We can reason about such scenes intuitively and draw many inferences about physical relationships pre-attentively, with little or no conscious effort. Our ability to remember and recall information is also influenced, and often enhanced, by spatial context. Last, a first person per-spective can provide a more vivid sense of being somewhere that can help to create more engaging graphics.
This dissertation will:
Define what a first person viewpoint means in the context of data visualization.
Present a body of visualization work that demonstrates tech-niques for establishing a first person viewpoint, and how those techniques can be put into practice.
Examine the response received from exhibition of the work and provide critique.
1.3 Applications
The bulk of this dissertation is comprised of visualizations that use first person to address challenges encountered in real applica-tions. Much of the work began with developing tools for retrieval and analysis, created for use in my own research in areas of com-puter vision and cognitive science, or by other members of the Cognitive Machines research group. Much of the work has also been created or adapted for use in presentations to communicate research methods and results.
One of the most widely seen exhibitions of the work occurred at the TED 2011 conference. Deb Roy gave a 20-minute talk on research from the Media Lab and from Bluefin Labs, a data ana-lytics company of which Roy is cofounder. The majority of the visual content consisted of data visualizations, created primarily
a general audience. A video of this event was made publicly avail-able shortly after the talk, has been seen by millions of viewers, and has generated discussions on numerous high-traffic websites. Some of the critique received from these discussions will be ex-amined in Section 5 in evaluation of the work.
Other work has been created for use on US national broadcast television, which will be discussed in Section 4.2.
1.4 Terminology
The terms data, data visualization, information, information
visualiza-tion, and scientific visualization are not always used consistently. This document adopts several working definitions to avoid poten-tial confusion.
Most important is the distinction between data and information. For the purposes of this document, data is like the text in a book, and information is what is communicated through the text. A person who cannot read can still look at the text and perceive the data, but does not derive the information. Similarly, a bar chart maps quantities, data, to the size of bars. What the bars represent and the inferences drawn from the chart are information.
Unfortunately, this distinction between data and information has little to do with extant definitions of data visualization and informa-tion visualizainforma-tion. [Card et al., 1998] offer a definition of visualiza-tion as "the use of computer-supported, interactive, visual repre-sentations of data to amplify cognition." They further distinguish between scientific and information visualizations based on the type
of data. Scientific visualization refers to representations of spatial data, such as wind flow measurements. Information visualization refers to representations of abstract data, data that is non-spatial or non-numerical, and that requires the designer to choose a spatial mapping. However, these definitions are ambiguous when work-ing with heterogeneous data.
[Post et al., 2003] define data visualization as including both scien-tific and information visualization. For simplicity, this document uses data visualization exclusively to refer to any visual representa-tion of data.
2 The First Person
What does afirst person viewpoint mean in the context of data visu-alization? For software interfaces, a first person viewpoint implies a navigation scheme in which the user moves through a virtual environment as if walking or flying. And while we refer to such
systems asfirst person interfaces, our categorization of viewpoint
also include many elements beyond 3D navigation. Furthermore, a data visualization might not be interactive at all, but an image or animation. The concept of first person extends to all of these me-diums, as it does to cinema, painting, video games, and literature. Defined broadly, the first person depicts a world from the eyes of a character that inhabits and participates in that world. The third person depicts a world from the viewpoint of a non-participant, a disembodied observer. To extend the terminology, the term ze-roth person will refer to a representation that establishes no sense of a world or characters at all, as in an abstract painting or instruc-tion manual. Most data visualizainstruc-tions, like bar charts, also fall into this category1.
The distinction between viewpoints is not always clear. Whether a representation presents a world and characters, and whether the viewpoint represents that of an inhabitant or of no one, may all be ambiguous. Furthermore, the criteria used to make such judg-ments depend on the properties and conventions of the medium. In video games, the distinction between first and third-person
shooters is based on a slight shift in camera position. Figure 1 shows a first-person shooter, where the player views the world
1 Second person is conspicuously omitted here due its infrequent use. The
sec-ond person is looking at yourself through someone else's eyes. This is simple to accomplish linguistically with the word you. Representing the viewer visually is more difficult, but might include looking at a photograph or video record-ing of yourself, or the rare video game in which the player controls a character while looking through the eyes of an uncontrolled character, as seen in the first
Figure 1. A first person shooter.
Figure 2. A third person shooter.
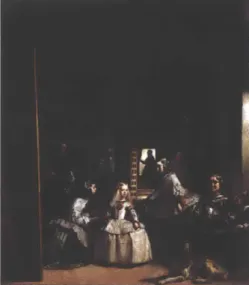
Figure 3. Diego Velizquez. Las Meninas.
1656.
from the eyes of his character. Figure 2 is from a third-person shooter, where the camera is placed a few feet behind the char-acter. In either case, the player identifies with the character in the game and views the environment from a perspective very close to that of the character. Our categorization of viewpoints is not something that is defined absolutely, but relative to the norms of the medium. In the medium of 3D-shooter video games, Figures 1 and 2 represent the narrow range of view-points normally found, and so we call the one that is slightly closer from the character's perspectivefrst person.
Categorization of viewpoint may be more ambiguous for im-ages, which provide less obvious cues as to whether or not the image represents the viewpoint of some character. An interest-ing example of viewpoint in paintinterest-ing is provided by Michel Foucault in The Order of Things [Foucault 1970]. In the first chapter, Foucault meticulously examines Diego Velizquez's Las Meninas and the different ways it relates to the viewer. At first glance, the viewer might see the 5-year old princess standing in the center of the room and the entourage surrounding her. These characters occupy the center of the space and initially appear to be the focus of attention in the painting, providing a typical third person view in which the viewer, outside the painting, views a subject of interest within the painting.
On closer inspection, many of the characters are looking out of the painting fairly intently, including a painter, Velazquez himself, who appears to be painting the viewer. A mirror in the back of the room also reveals the royal couple standing in the position of the viewer. These elements give the viewer the role within the scene, as a person being painted, possible the king or queen. The center of focus is not the princess, but rather, the princess and entourage are there to watch and perhaps entertain the royal couple as they pose for a portrait. The focus is on the viewer. A first person view.
Foucault also describes the dark man hovering at the door in the back. Compositionally, he mirrors the royal couple, but stands behind the space of the room while the royal couple stand in
front of it. The historical identity of this character is known, but Foucault suggests that it might double as a representation of the viewer, as someone who has happened into a scene and pauses to look in. A second person view.
Intruding into the left of the painting and occupying nearly the entire height is a canvas on which the represented artist is painting. To give so much prominence to the back of a canvas is unusual, and Foucault theorizes it may be intended to guide the viewer's thoughts away from the representation and towards the physical canvas that he is looking at in reality, which, too, has nothing behind it. The painting is not a scene, but just a canvas. A zeroth person view.
What we consider to be a first person viewpoint is not defined by any single element, and as discussed in the Velazquez example, different elements within a representation can support contrast-ing interpretations. What the elements of a first person viewpoint have in common is that they establish some form of egocentric relationship with the viewer, where the viewer does not perceive the representation as a configuration of light and symbols, but as a physical world that includes them, that the viewer might interact with, or where the world might affect the viewer in some way. Viewpoint is associated most strongly with visual perception, where first person is the viewpoint that most strongly creates a sense of perceived immersion, of the viewer perceiving a scene as sur-rounding himself. However, the purpose of the Velazquez exam-ple is to show that viewpoint also occurs at a cognitive level. The different viewpoints presented in the painting all come from the same visual stimuli, but differ in how that stimuli is interpreted. The work shown in this thesis will not attempt to manipulate viewpoint as subtly as this painting, but will approach viewpoint as something that extends beyond perception and that includes this kind of psychological engagement. Colin Ware authored In-formation Visualization [Ware 2004], which focuses on the percep-tion of visualizapercep-tions. In the book, Ware includes a brief discus-sion on the topic of presence:
"One of the most nebulous and ill-defined tasks related to 3D
2, 'N' V's -q J~. 2 --3 -4
Figure 4. A typical scatter plot navigated in the first person, bu
not provide a sense of physical e ment.
f
2U
space perception is achieving a sense of presence. What is it that makes a virtual object or a whole environment seem vividly
three-dimensional? What is it that makes us feel that we are actually present in an environment?
Much of presence has to do with a sense of engagement, and not necessarily with visual information. A reader of a power-fully descriptive novel may visualize (to use the word in its original cognitive sense) himself or herself in a world of the author's imagination-for example, watching Ahab on the back of the great white whale, Moby-Dick."
A viewer is more likely to feel immersed and engaged in a
rep-resentation that "feels" like a physical environment, and so the concept of presence is at the core of what a first person viewpoint means within this document. As Ware notes, the concept is not well defined, and within the book, he does not attempt to delve much deeper into the subject. There is still much to explore in what defines presence, how to establish it, and how it might be applied to data visualization.
Establishing a sense of presence involves more than just represent-ing a 3D space. Any 3D scatter plot can easily be explored usrepresent-ing a first person navigation scheme, but even so, the representation may not provide a sense of being in a physical environment. A representation of flying through a nearly empty space, populated sparsely by intangible floating dots, is perceptually unlike any view of the real world we are likely to encounter, and more to the point, unlikely to evoke a similar experience.
Our minds learn to recognize particular patterns of visual stimuli and, through experience, associate them with patterns of thought
and reasoning, described by Mark Johnson as image schemata
[Johnson, 1990]. When looking at the small objects on top of a desk, we are likely to perceive the support structures of stacked nay be objects, how we might sift through the objects to find a paper, or
t does how a coffee mug will feel in our hand. When we look around ngage- from the entrance of building, we are likely to draw inferences
about the layout of the building, where we might find an elevator, and how we can navigate towards it. One way to define presence is to say that representations with presence more strongly evoke
the image schemata we associate with physical environments, and lead to similar patterns of thought and engagement.
There are many individual techniques that might be used in visu-alization design to establish presence to varying degrees: creat-ing a sense of depth and space, representcreat-ing data in the form of a familiar object or structure, emulating physical properties like gravitational acceleration and collisions, emulating physical navi-gation and interaction, rendering naturalistic details and textures, or providing the viewer with a clear sense of position and scale. The rest of this document will provide more concrete examples of these approaches, and will examine how to establish presence and first person engagement for both photorealistic and non-pho-torealistic environments.
3 The Human Speechome Project
In 1980, Noam Chomsky proposed that a developing child could not receive and process enough stimulus from his environment to account for learning a complex, natural language. The theory fol-lowed that, if true, then part of language must be accounted for
by biology, and aspects of language are hard-wired in the brain
[Chomsky, 1980]. This argument is widely known in linguistics as the poverty of stimulus, and through several decades and into the present day, a central challenge in this field has been to iden-tify the aspects of language that are innate, the aspects that are learned, and the relationship between the two.
Language might be viewed as the product of two sets of input, genetics and environment. Of the two, genetics is the simpler to quantify. The human genetic code is about 700 megabytes, and several specimens are available for download. But the environ-ment includes all of the stimulus the child receives throughout development, including everything the child sees and hears. One of the difficulties in responding to the poverty of stimulus argu-ment is that it is difficult to produce an accurate figure for the amount of environment data a child actually receives or how much might be useful. But the number is certainly greater than
700 megabytes, and likely lies far in the realm of Big Data.
Capturing the input of a child is a difficult and messy task. Stan-dard approaches include in vitro recording, in which the child is brought into a laboratory for observation. In vivo recording is usually performed by sending scientists into the home environ-ment for observation, or with diary studies in which a caregiver records notable events throughout the a child's development. In vivo methods provide more naturalistic data collected that comes from the child's typical environment, with in vitro methods only observe the child's atypical behavior in an unfamiliar laboratory.
However, all of these approaches suffer from incompleteness and capture only a tiny fraction of the child's input. As a result, each time the child is observed, he is likely to have developed new abilities during the time between observation, making it difficult or impossible to determine how those abilities were acquired. Other researchers have lamented that the lack of high-quality, longitudinal data in this area is largely to blame for our poor understanding of the fine-grained effects of language on acquisi-tion [Tomasello and Stahl, 2004]. A more complete record might answer numerous questions about what fine-grained vocabulary actually looks like, the influence of different environmental fac-tors on development, and the patterns of interaction between children and caregivers that facilitate learning.
The poverty of environmental data was one of the motivations behind the Human Speechome Project (HSP). Speechome is a portmanteau of speech and home, meant also as a reference to the Human Genome Project. Where the Human Genome Project cre-ated a complete record of a human's genetic code, HSP intended to capture the experience of a developing child as completely as possible with dense, longitudinal audio-video recordings. Recent advances in digital sensors and storage costs offered an alterna-tive solution to the problem of observing child development: to install cameras and microphones throughout the home of a child and simply record everything. Of course, recording the data is the comparatively easy part. The difficult task that HSP set out to address was how to develop methodologies and technologies to effectively analyze data of that magnitude.
3.1 Setup
I began working on HSP shortly after its conception in 2005. The
family to be observed was that of my advisor, Deb Roy, and his wife, Rupal Patel, a professor of language-speech pathology at Northeastern University. Roy and Patel were expecting their first child, and initiated the project several months into the pregnancy. This provided enough time to instrument the house, develop a recording systems, and construct a storage facility before the
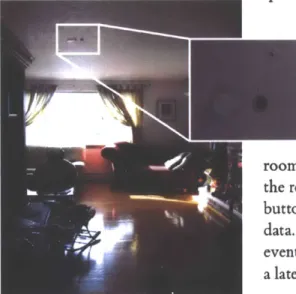
Figure 5. The HSP recording site.
Figure 6. A camera and microphone mounted in ceiling. The microphone is the small silver button near the top.
child arrived. Eleven cameras and fourteen microphones were installed in ceilings throughout most rooms of the house. Video cameras were placed near the center of each ceiling looking down, and were equipped with fisheye lenses that provided an angle-of-view of 185 degrees, enabling each camera to capture an entire room from floor to ceiling. The audio sensors were boundary layer microphones, which sense audio vibrations from the surface in which they are embedded and use the entire ceil-ing surface as a pickup. These sensors could record whispered
speech intelligibly from any location in the house.
The goal of recording everything was not entirely pos-sible, and over the course of three years, the participants would require moments of privacy. Participants in the home could control recording using PDAs-an older type of mobile device that resembles a smart phone without the telephony-that were mounted in each room. Each panel had a button that could be pressed to toggle the recording of audio or video. Another button, the "oops" button, could be pressed to delete a portion of recently recorded data. And last, an "ooh" button, could be pressed to mark an event of interest so that the event could be located and viewed at a later time.
Recording began the day the child first came home from the hospital, and completed after the child was three years old and speaking in multi-word utterances. The corpus from this project includes 80,000 hours of video, 120,000 hours of audio, and comprises about 400 terabytes of data. This data is estimated to capture roughly 80% of the child's waking experience within the home, and represents the most complete record of a child's development by several orders of magnitude. A more detailed account of the recording methodology and system can be find in [DeCamp, 2007].
Compared to what the child actually experienced, this record is certainly not complete. It does not contain recordings of smell, touch, taste or temperature. It is limited to audio-video from a set of fixed perspectives, and does not show things in the same way the child saw them, or with the same resolution. Yet, nearly
Figure 7. One of the recording control panels mounted in each room.
2005/07/29 12:13 PM 2005/07/29 05:03 AM
The Child Arrives Myself, exasperated, trying to get the record-ing system to work hours before the arrival.
every aspect of the child's experience is represented, in part, with-in the data. What the child said and heard, his with-interactions with others, his patterns of sleep and play, what he liked or disliked, are all forms of information contained in the audio-video record. But the analysis of any such information is predicated on the ability to
extract it.
3.2 The Data
The audio-video recordings are referred to as the raw data. Most analysis requires extracting more concise forms of data from the audio-video, like transcripts of speech, person tracks, prosody, and others, which are referred to as metadata. Extracting useful metadata from audio-video at this scale can be difficult. Auto-matic approaches that rely on machine perception are cheapest, but available technologies limit the kinds of information can be extracted automatically and the accuracy. Manual approaches that require humans to view and annotate multiple years of data can be extremely expensive, even for relatively simple annotation tasks. And in between are human-machine collaborative ap-proaches, in which humans performjust the tasks that cannot be performed automatically.
be extracted using available tools, what new tools could be devel-oped, and what information would be economically feasible in the end. So the project did not begin with a specific set of ques-tions to answer, but rather a range of inquiry about language and behavior. An exploratory approach was taken towards choos-ing paths of research that balanced the relevance of potential results against the expected cost of mining the required data. Although the ultimate goal of the project was to develop a model of language acquisition grounded in empirical data, many of the significant contributions came from the methodologies research-ers developed to extract relevant behavioral information from raw data.
Linguistic analysis required transcripts of the recorded speech.
A key goal of the project was thus to transcribe all speech that
occurred in the child's presence during his 9th to 24th months, representing the period just before he began to produce words, and ending after he was communicating in sentences and multi-word utterances. Current speech recognition technologies were unable to transcript the speech with any reasonable accuracy. The audio recordings contain unconstrained, natural speech, includ-ing significant background noise, overlappinclud-ing speakers, and the baby babble of a child learning to talk. Furthermore, although the audio quality was relatively high, recordings made with far-field microphones still pose problems for the acoustical models used in speech recognition. Brandon Roy led efforts to develop an effi-cient speech transcription system that uses a human-machine col-laborative approach. Roy's system locates all audio clips contain-ing speech and identifies the speaker automatically, then organizes the audio clips into an interface for human transcription [Roy and Roy, 2009]. As of this writing, approximately 80% of the speech from the 9 to 24 month period has been transcribed, resulting in a corpus of approximately 12 million words.
Person tracking, or identifying the locations of the participants within the video, was required to analyze interactions, spatial
context, and often as a starting point for more detailed video analysis. Person tracking in a home environment requires fol-lowing people moving between rooms, severe lighting contrasts between indoor lights and the natural light entering windows,
and attempting to track a child that was frequently carried by a caregiver. George Shaw developed an automatic, multi-camera tracking system used to extract much of the track data that will be shown in this document [Shaw, 2011].
Many other forms of data have been extracted to varying degrees of completeness. Most of these will play a smaller role in the following discussion, but may be of interest to those developing methods of analyzing human behavior from audio-video record-ings. A few of these include:
Prosody: The intonation of speech, including pitch, duration, and intensity for individual syllables. Many aspects of caregiver prosody have turned out to be significant predictors of vocabulary developing in the child [Vosoughi, 2010].
Where-Is-Child Annotations (WIC): Annotations describing the room in which the child was at any given point in the recorded data, and whether the child was awake or sleeping. This metadata was largely used to quickly locate the child within the data, both for data navigation tasks, and to reduce unnecessary processing of data irrelevant to the child's development.
Head Orientation: Head orientation is a useful indicator of gaze direction and attention, what the participants are looking at, if the child is looking at a care giver directly, or if the child and caregiv-er share
joint-attention
within an interaction [DeCamp, 2007]. Affect Classification: The emotional state of the child during dif-ferent activities [Yuditskaya, 2010].Sentiment Classification: The attitude or emotional polarity of a given utterance. For example, "Awesome!" has a positive senti-ment and, "Yuck!" a negative sentisenti-ment.
Taking the raw data together with the metadata, the HSP cor-pus is large, contains multiple forms of interrelated data, and is unique.
3.3 TotalRecall
After the recording process began, the immediate question be-came how to look through the data, verify its integrity, and find information of interest. Skimming through just a few hours of multi-track audio-video data can be time consuming, let alone finding specific events or interactions. This led to the develop-ment of TotalRecall, a software system designed for retrieval and annotation of the HSP corpus. This interface did not use any 3D graphics or address issues of viewpoint, but serves here as a base-line for a more conventional approach.
The TotalRecall interface provides two windows. A video win-dow that displays the raw video, with one stream at full resolution and the other streams displayed at thumbnail sizes on the side. The timeline window provides visual summaries of the audio-video recordings. The horizontal axis represents time, and can be navigated by panning or zooming in and out of different time scales. Each horizontal strip represents one stream of audio or video.
The audio data is represented with spectrograms, a standard visualization of the audio spectrum over time. Users can skim spectrograms to find areas of activity within the audio. With some practice, users can learn to quickly separate different types of audio. Human speech contains formant structures that gener-ate zebra stripe patterns. Doors and banging objects, like dishes, produce broad spectrum energy bursts that appear as sharp
verti-Figure 8. The TotalRecall interface used for browsing the HSP data.
cal lines. Running water and air conditioners produce sections of nearly uniform noise.
Summarization of the video was more challenging. The standard method used in most video editing and retrieval interfaces is to show individual frames, often selecting frames scene boundar-ies or points of significant change. This approach works poorly for the HSP video, which contains no scene changes or camera motion. Most rooms are unoccupied, and where there is activity, it comprises only a small portion of the image. Consequently, identifying the differences between video frames requires close attention and more effort relative to edited video.
However, the consistency of the video offers other advantages. Most of the content of a given stream is already known. The liv-ing room camera will always show the same of the livliv-ing room, and the portions of greatest interest are changes in the fore-ground. Rather than try to show the whole contents of the video frames, an image stack process was used to transform each stream of video into a video volume, a continuous strip that depicts only the motion within the video.
The process begins with a stream of raw video.
The per-pixel distance between adjacent frames. The distance map generated for each frame is then used to modulate the alpha chan-nel, such that dynamic pixels are made opaque and unchanging pixels are made transparent.
*1
These images are then composited onto a horizontal image strip, with each subsequent frame of the video shifted a few more pixels to the right. This maps the vertical position of motion onto the vertical axis of the image, and maps both time and horizontal position onto the horizontal axis.
The result transforms moving objects into space-time worms, where each segment of the worm represents a slice of time. More generally, the process converts continuous video into a continu-ous image. Similar to spectrograms, users can view a set of video volumes for all the streams of video and, with minimal training, quickly identify where and when there was activity in the home.
By itself, this was of great value in searching through hours or
months of 11-track video. With additional experience, viewers may quickly learn to identify more specific patterns as well. From the number of worms, users can identify the number of people in a room, and from the size, differentiate between child and caregivers. The level of intensity indicates the amount of mo-tion, with the limitation that people at complete rest may nearly disappear for periods of time. The coloration provides informa-tion about lighting condiinforma-tions, and can be used to follow some brightly colored objects, including articles of clothing and certain toys. Some activities also produce noticeable patterns, including instances when the child was in a bounce chair or playing chase with a caregiver.
A similar image stack process for visualizing video was described
previously in [Daniel, 2003]. In this work, Daniel et al. render the video as an actual 3D volume. Our application for video volumes was different in that it we needed to view longitudinal, multi-track video. Consequently, we adapted the approach by flattening the image stack into a flat, straight rectangular strip in order to make it more suitable for display on a multi-track timeline. Rony Kubat developed the main window of TotalRecall, with Brandon Roy, Stefanie Tellex, and myself. I developed the video window, along with all audio-video playback code. This video volume technique was developed by Brian Kardon, Deb Roy, and myself. A more detailed account of the system can be found in
[Kubat, 2007].
3.4 Partitioned Views
-
wm-WMd~uo42C 143910.889
Figure 9. An interface for audio, video and motion data created by Ivanov et al.
One of the choices made in the design of TotalRecall was to present different source of data separately, each in its own parti-tioned view. An advantage of this approach is that it presents each source accurately and simply, and makes explicit the underlying structure of the corpus. However, this partitioning obscures the relationships between sources of data. The representation of the data is partitioned rather than composed.
In particular, there is a strong spatial relationship between all the sensors in the house that has been largely omitted. Consequently, viewing a person moving between rooms, or viewing a caregiver speaking to the child in the dining room, can require some effort to follow. In these cases, the user must watch an event multiple times from multiple views, repeatedly finding the desired track of audio or video out of the many presented, and to mentally com-pose that information to gain a complete picture of the activity. Similarly, the interface does not provide a clear overview of the whole environment, the spatial layout and the participants present at a point in time.
A partial solution may have been to include a map view that
presents the space as a whole. For example, Yuri Ivanov et
al. developed an interface similar to TotalRecall for a dataset containing multi-camera video, person tracks, and motion sensor data. As seen in Figure 9, one view displays the video, another the timeline with annotations, and another the mapof the space with overlaid motion data.
The addition of the map view is useful in understanding the spatial arrangement of the environment and interpreting motion data. However, it does little to combine the differ-ent types of data, and the spatial data is still separate from the video. As with TotalRecall, gaining an understanding of the environment from the visualization is not a simple perceptual task, but requires the user to cross-reference a spatial view, tem-poral view, and video view.
Both the Ivanov interface and TotalRecall present data in the as a set of multiple, mostly abstract views. Again, this approach was likely suitable for their respective purposes as browsing interfaces
for expert users. However, even for us "experts," comprehend-ing and navigatcomprehend-ing video across cameras was difficult. And for an untrained user, a first glance at TotalRecall does not reveal much about what the data represents. When using the system to explain the Human Speechome Project, it required around 10 minutes to explain how to interpret the different visual elements, much as it
was described here, and what they reveal about activities within the home. In the end, the audience may still only have a partial picture of what the data contains as a whole.
In motivating HSP, a narrative frequently told in demonstrations was that we had captured an ultra-dense experiential record of a child's life, which could be used to study how experience affected development and behavior. While many found this idea compel-ling, skeptical listeners would sometimes argue that while a great amount of data about the child had been recorded, it did not capture much of what the child experienced. It was easy to un-derstand the skeptics because they were presented with a disjoint set of data that bore little resemblance to their own experiences of the world.
While the data is far from a complete experiential record, part of the issue is literally how one looks at the data. In the next ex-ample, the same set of data will be presented in the first person as a way that more clearly evokes the subjective experiences of the participants.
3.5 Surveillance Video
The raw video of the HSP corpus is surveillance video, which, taken by itself, is not always the most engaging or cinematic view of an environment. The video does not focus in on any particu-lar area of interest, and any activity is usually limited to a small
region of the total image. This emphasizes the setting and de-emphasizes the people within it. Furthermore, it provides a third person viewpoint where the overhead angle forces the viewer to
Figure 10. A man under surveillance in The Conversation.
look down into the scene from above, rather than a more typical eye-level shot as if the viewer were actually within the scene. In cinema, shots of surveillance or CCTV footage are usually diagetic, indicating that a character is being recorded within the narrative. This device has been notably used in films like The Con-versation, Rear Window, and The Truman Show. These shots often have ominous or lurid undertones, and tap into a cultural uneasi-ness surrounding the proliferation of surveillance and loss of privacy [Levin, 2006]. And indeed, although the HSP participants were aware of being recorded and in control of the system, this discomfort with the idea of constant surveillance surfaced fre-quently in discussion of the project, with terms like "Big Broth-er" voiced more than occasionally. Although this does not detract from any information in the video, it can give the viewer of the system the sense of being an eavesdropper. And in presentations, this can be a distraction in the scientific intent of the project. One HSP researcher, Kleovoulos Tsourides, performed a clever experiment by first tracking a person within a clip of video, then using the track data to reprocess the video, zooming into the region containing the person and rotating each frame to maintain a consistent orientation. This virtual cameraman system made the video appear as if shot by a cameraman following the per-son using a normal-angled lens. This system was not completely developed and had few opportunities to be demonstrated, and it
may be that for people unfamiliar with the data, the effect may not have seemed markedly different. But for those of us working on the project that had been viewing the surveillance video for several years, the transformation was remarkable. It replaced the impression of surveillance video with the impression of cinematic video, and gave the impression that the video contained substan-tially more information and detail. Of course, the process only removed information, but by removing what was irrelevant made the relevant information that much greater.
3.6 HouseFly
In addressing some of the limitations of TotalRecall, I created a new interface for browsing the HSP data called HouseFly. Rather than partition the sources of data, HouseFly synthesizes the data into a 3D simulation of the home. The user can navigate this environment in the first person and watch events with a vivid sense of immersion. Because of the density of the HSP data, the system can render the entire home in photographic detail, while also providing rapid temporal navigation throughout the three year recording period. HouseFly also serves as a platform for the visualization of other spatio-temporal metadata of the HPS corpus, combining multiple types of data within a shared space for direct comparison. As a tool for communication, the system makes the data immediately accessible and engages the viewers in the recorded events by bringing them into the home.
Figure 12. Raw video used to con-struct the 3D model below.
Figure 11. The HouseFly system showing an overhead view of the recorded home.
3.7 Related Work
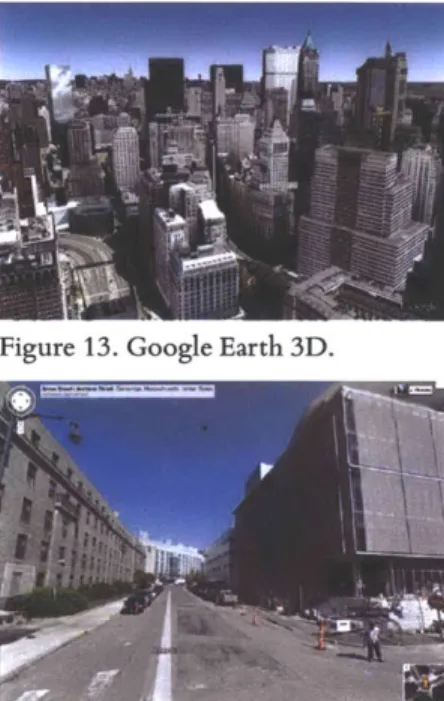
The virtual reconstruction of physical locations is a general one, with broad applications in the visualization of spatial environ-ments. One of the most visible examples is Google Maps, which includes a StreetView feature that provides a street-level, first-person view of many cities. For general path planning, conven-tional maps may
be
more efficient,but
thefirst-person
view Figure 13. Google Earth 3D. provides additional information on what a location will look likewhen the traveler is present, and can be used to identify visible landmarks for guidance or find specific locations based on appear-ance [Anguelov et al., 2010]. Google Maps and similar services provide coverage of very large areas, but primarily as snapshots in time, with limited capabilities for viewing events or for temporal navigation. As a web interface, spatial navigation is also highly constrained, and the user must navigate rather slowly between
Figure 14. Google StreetView. predefined locations.
Sawhney et al. developed the Video Flashlights system for con-ventional video surveillance tasks, which projects multi-camera video onto a 3D model of the environment. This system does not rely on static cameras, and uses a dynamic image registration to automatically map the video data to the environment. It can also present track data within, the environment [Sawhney, 2002]. The flashlight metaphor of Video Flashlights is one of using video data to illuminate small regions of the model. It places the video in a spatial context and combines connects recordings to each other and to the environment, but the range of exploration is limited to localized areas.
HouseFly builds on these technologies and uses more recent graphics capabilities to to perform non-linear texture mapping, allowing for the use of wide-angle lenses that offer much more coverage. But the most significant advantages of HouseFly are provided by the data. The HSP corpus provides recordings of a complete environment, in detail, and over long periods of time.
Figure 15. Video Flashlights. This led to the design of an interface that provides freer
3.8 Constructing the Environment
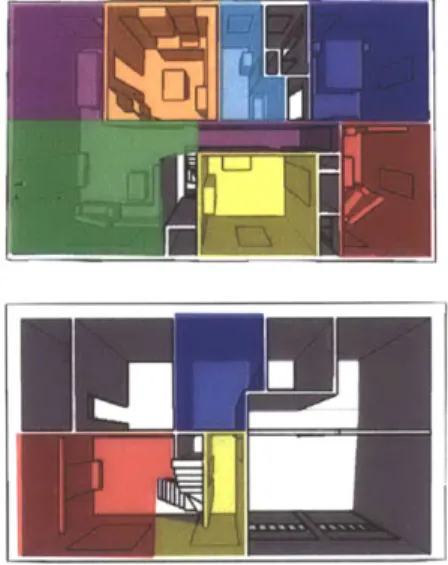
The first step in developing HouseFly was the creation of a spatial environment from the data. The environment has three compo-nents: a 3D model of the house that provides the geometry, video data used as textures, and a spatial mapping from the geometry to the textures.
The model of the house is a triangular mesh, created in Google SketchUp. The model is coarse, containing the walls and floors, doorways, and using simple boxes to represent fixtures and large furniture. This model was partitioned manually into zones, where the geometry within each zone is mapped to a single stream of video. Generally, each zone corresponds to a room of the house. Creating a spatial mapping for each stream of video requires a mathematical model of the camera optics and a set of parameters that fit the model to each camera. The extrinsic parameters of the camera consist of the camera's position and orientation. The intrinsic parameters describe the characteristics of the lens and imager.
Given the use of a fisheye lens, it is simpler to ignore the lens itself and instead model the imager surface as a sphere. The zenith axis of the sphere, Z, exits the front of the camera through the lens. The azimuth axis, X, exits the right side of the camera. Z x X is designated Y and exits the bottom of the camera. The center of the sphere is C.
To map a point in world space, P, to an image coordinate, U, P is first mapped onto the axes of the camera:
P = [XYZ] (P - C)
P
is then projected onto the sensor sphere:0
=
COS-1P1
P|
q= tan-
1PY
Px
Figure 16. Partitioning of the envi-ronment geometry into zones, each of which is textured by a single camera.
(1)
(2)
(3)
where 9 is the inclination, and
#
is the azimuth. Last,(0,
4)
is mapped into image coordinates:U
= SxOcos#+Tj
(4)
Sy6 sin
#
+
Ty
where S, and S, are scaling parameters, and T and T, are transla-tion parameteps.
Thus, Equation 4 contains four scalar parameters, while Equations
1-3 require six scalar parameters: three to define the center of
the sensor, C, and three to define the orientation as a set of Euler angles: yaw, pitch, and roll. Together, these equations define a mapping function between world coordinates and image coordina tes, f(P : 0) -> U, where
E
represents the ten camera param-eters.Camera Calibration
Finding the ten parameters for each camera comprises the calibra-tion process. This is performed by first finding a set of correspon-dence points, which have position defined in both image and world coordinates. For each correspondence point, the image coordi-nates are specified by clicking directly on the video frame. World coordinates are extracted from the 3D model in Sketchup and entered manually into the calibration interface. Given a sufficient number of correspondence points, a Levenberg-Marquardt non-linear solver was used to fit the parameters.
Figure 17.The interface used
for camera calibration. Rony
Kubat developed the interface, and I developed the camera model and parameter solver.
Texture Mapping
Figure 20 shows the simplified geometry for one zone of the partitioned environment model, and below shows the texture used for that region. Normally, with a rectilinear lens, the texture can be mapped to the geometry at the vertex level. That is, the camera model defines a function that maps a world coordinate to a texture coordinate, and that function is applied once for each ver-tex of the model geometry. With a rectilinear lens, the ver-texture for each point of the triangle can be computed accurately by linearly interpolating the texture coordinates of its vertices.
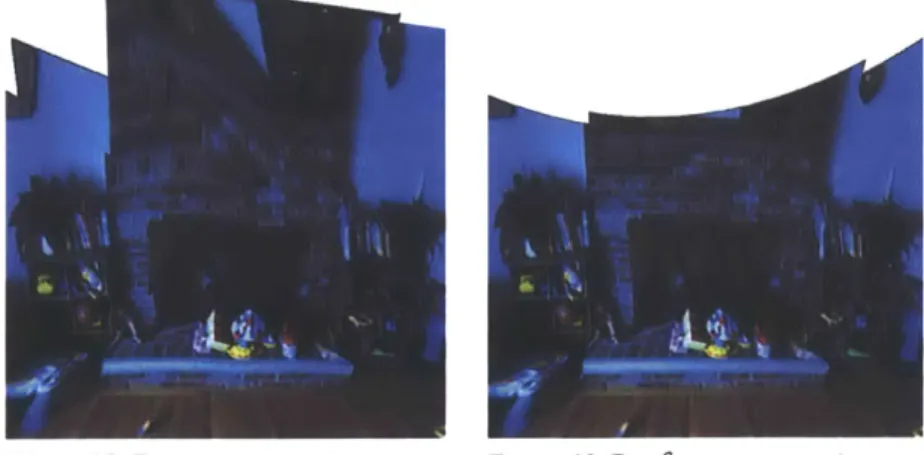
However, the fisheye lenses are not modeled well with linear functions. Note that in Figure 20, although the geometry above is rendered from an angle to approximately align with the texture below, the match is not very accurate. The edges between the floor and walls are straight on the geometry, but appear curved in the texture, leading to distortion. This distortion grows greater towards the edges of the texture as it becomes more warped and non-linear. Figure 18 shows the result of using a piece-wise lin-ear, per-vertex mapping, where distortion becomes increasingly severe as the model approaches the edges of the texture.
Subdividing the geometry produces a finer mapping and reduces distortion, but requires far more video memory and processing. Beyond a certain threshold, when the vertices of the subdivided geometry no longer fit in memory, the geometry must be loaded dynamically according to the user's current position, greatly in-creasing the complexity of the renderer.
Figure 18. Per-vertex mapping.
Figure 20. Partitioning of the environment geometry into zones, each of which is tex-tured by a single camera.
Figure 19. Per-fragment mapping.
Fortunately, modern GPUs feature programmable shaders that can perform non-linear texture projection. Instead of mapping each vertex to the texture, the renderer loads the camera model onto the graphics card, which then computes the correct texture coordinate for each pixel at every render pass. Unless the graphics card is being taxed by other operations, per-fragment incurs no detectable performance penalty while eliminating completely the
non-linear distortions, as in Figure 19.
Rendering
Given the spatial model, textures, and mapping, the house can be rendered in full. Each zone is rendered separately. For each zone, the associated texture object is bound, the camera parameters are loaded into the fragment shader, and the geometry is sent to the graphics card for rasterization and texturing.
A benefit of this approach is that any frame of video may be
loaded into the texture object and will be projected onto the envi-ronment model without any preprocessing. As a result, animation of the environment is just a matter of decoding the video streams and sending the decoded images directly to the texture objects. In this document, all the video is prerecorded, but in future applica-tions, live video streams may be viewed just as easily.
Controls
HouseFly provides fluid navigation of both time and space. The user may go to any point in time in the corpus and view the envi-ronment from any angle.
Temporal navigation is very similar to conventional interfaces for multi-track video playback. A collapsible timeline widget displays the user's current position in time, and may be clicked to change that position. Using either a keyboard or ajog-shuttle controller, the user may control his peed along the time dimension. The data can be traversed at arbitrary speeds, and the user may watch events
in real-time, thousands of times faster, backwards, or frame-by-frame.
HouseFly was designed to create a similarly first-person view-point into the data. It supports two primary schemes for spatial
navigation, both of which follow a metaphor of moving through the environment rather than moving the environment.
First, navigation can be performed with a keyboard and mouse using the same controls as a first-person shooter. The WASD keys are pressed to move forward, left, backward, and right, and the mouse is used to rotate. The Q and E keys are pressed to increase or decrease elevation. The drawback to this scheme is that it requires both hands, making it difficult to simultaneously control time.
Second, navigation can be performed using a SpaceNavigator input device. This device consists of a puck mounted flexibly on a heavy base, where the puck can be pushed-pulled along three axes, and rotated about three axes, providing six degrees-of-freedom. Navigation with the SpaceNavigator provides full control over orientation and position using only a single hand. The drawback is that this device requires significant practice to use effectively.
Audio
For audio, one stream is played at a time. The system dynamically selects the stream of audio recorded nearest the user's location. While this simple approach does not capture the acoustic varia-tion within a room, it does capture the variavaria-tions between rooms. When the user is close to people in the model, their voices are clear. When the user moves behind a closed door, the voices from the next room become accurately muffled. When the user moves downstairs, he can hear the footsteps of the people overhead. Such effects may not draw much attention, but add greatly to the immersiveness of the interface.
Figure 21. SpaceNavigator and jog-shuttle controller used for time-space navigation.
When playing data forward at non-real-time speeds, SOLA-FS is used to correct the pitch of the audio [Hejna, 1991], which improves comprehension of speech [Foulke 1969].
Implementation
HouseFly was developed in the Java programming language. 3D graphics were produced with OpenGL using the Java bindings provided by the JOGL library. Shader programming was done in
GLSL and Cg. Functionality that required significant
optimiza-tion, like video decoding, was written in C. C was also necessary for interfacing with input devices, including the SpaceNavigator and jog-.shuttle controller.
The graphics engine developed for HouseFly is similar to a 3D game engine, with similar techniques used to manage assets, script events, and handle user input. This engine was used for most of the original visualizations in this document.
Roughly, the hardware requirements of HouseFly are below that of most modern first-person shooter games. The system runs smoothly, between 30 and 60 frames-per-second, on personal computers and newer laptops. More specific figures depend
great-ly on how the software is configured and the data being accessed.
The most significant bottleneck of the system is video decoding. First, due to the size of the corpus, the video must be pulled from the server room via Ethernet. Network latency is largely miti-gated through aggressive, predictive pre-caching. Alternatively, if not all the data is required, a subset may be stored locally for better performance.
Second, video decoding is currently performed on the CPU. The
HSP video is compressed using a variant of motion JPEG with
a resolution of 960 by 960 pixels at 15 frames per second. On a laptop with a two-core 2.8 GHz processor, the system can replay four streams of video without dropping frames. On an eight-core
2.8 GHz processor, frame dropping becomes noticeable at around
However, it is not always necessary to decode many streams of video. For most viewpoints within the house, only three or four
rooms are potentially visible. To improve performance, HouseFly dynamically enables or disables playback of video streams based on the location of the user.
Baseline Summary
The tools provided by HouseFly encourage the exploration of the data as a whole environment rather than as individual streams. The user can navigate to any point in time within the corpus and view it as a rich 3D environment, filled with objects and people that move, speak, and interact with the environment. The user can move closer to areas of interest, pull out to look at multiple rooms or the entire house, and follow events fluidly from one room into the next. Rather than looking down into the scene, the user can look from within, gain a clear sense of the spatial context that connects both data and events, and receives a much closer ap-proximation of what the participants saw, heard, and experienced. The system still has significant limitations in its ability to recon-struct the environment. The people and objects do not actu-ally stand up and occupy space, but are projected flatly onto the surfaces of the environment. There is no blending between zones, so when a person walks to the edge of one zone towards the next, the person is chopped into two texture pieces recorded from two
Figure 22. Examples of the home environment as rendered in HouseFly.
different viewpoints. Also, many parts of a given room are not visible from the camera, and there is no data available for textur-ing areas under tables and behind objects. Just filltextur-ing these blind areas with black or gray made caused them to stick out conspicu-ously next to the textured areas. Instead, the video data is project-ed onto these areas regardless of occlusions, and the area under-neath a table is given the same texture as the top of the table. Surprisingly, though, many viewers tend not to notice these is-sues. In demonstrations, listeners frequently asked how the people are rendered into the environment, and only realized that the people were not 3D models but flat projections after the camera was moved to floor.
Most methods of acquiring geometry from video are far from tractable, and even if applicable to the HSP video, would produce numerous artifacts and draw more attention to the limitations of the representation. So while the model HouseFly provides is coarse, there is enough detail within the video to provide a vivid depiction of a naturalistic, 3D environment.
3.9 Visualizing Metadata
In addition to the audio-video, the HSP corpus contains many forms of metadata. HouseFly provides several ways to incorporate metadata into the scene, combining it with other data and plac-ing it in context. In turn, the metadata also provides methods for searching and navigating the corpus, greatly improving the acces-sibility of the data.
Much of the metadata used for temporal navigation is placed on the timeline widget, shown in Figure 23. The timeline displays the user's place in time, and can be expanded to show an index of the audio-video recordings organized by room. The green bars represent audio recordings and the blue bars represent video re-cordings. Clicking on a room within the timeline moves the user temporally to that place in time and also moves the user spatially to an overhead view of the selected room.
Figure 23. The timeline in HouseFly.
The orange and yellow bars are the Where-Is-Child annotations, showing the room in which the child is located. The bar is or-ange if the audio for that period has been transcribed, and yellow otherwise, where transcripts will be discussed later. The viewer can then browse through the timeline to quickly determine the location of the child at a given point in time, and view the child
by clicking on the bar.
The small flags at the bottom of the timeline are bookmarks. The user can create a bookmark associated with a point of time, and may optionally associate the bookmark with a room of the house or a specific camera position.
As described earlier, the PDA devices mounted in each room as control panels also contained an "ooh" button that could be pressed to mark significant moments. These events were incor-porated into the system as bookmarks, represented here by the pink flags. The user may browse these bookmarks to view events like the child's first steps and many of his first words. One ooh event was made after describing the recording system to the child, explaining that years later, the child would be able to go back and find that moment in the data.