HAL Id: hal-02921299
https://hal.archives-ouvertes.fr/hal-02921299
Submitted on 10 May 2021HAL is a multi-disciplinary open access
archive for the deposit and dissemination of sci-entific research documents, whether they are pub-lished or not. The documents may come from teaching and research institutions in France or abroad, or from public or private research centers.
L’archive ouverte pluridisciplinaire HAL, est destinée au dépôt et à la diffusion de documents scientifiques de niveau recherche, publiés ou non, émanant des établissements d’enseignement et de recherche français ou étrangers, des laboratoires publics ou privés.
NCIPLOT and the analysis of noncovalent interactions
using the reduced density gradient
Rubén Laplaza, Francesca Peccati, Roberto A. Boto, Chaoyu Quan,
Alessandra Carbone, Jean-Philip Piquemal, Yvon Maday, Julia
Contreras-garcía
To cite this version:
Rubén Laplaza, Francesca Peccati, Roberto A. Boto, Chaoyu Quan, Alessandra Carbone, et al.. NCIPLOT and the analysis of noncovalent interactions using the reduced density gradient. WIREs Computational Molecular Science, 2021, 11 (2), pp.e1497. �10.1002/wcms.1497�. �hal-02921299�
NCIPLOT and the analysis of Noncovalent
Interactions using the Reduced Density
Gradient
Rubén Laplaza,
†,kFrancesca Peccati,
†,⊥Roberto A. Boto,
†,#Chaoyu Quan,
‡,@Alessandra Carbone,
¶,4Jean-Philip Piquemal,
†,4Yvon Maday,
§,4and Julia
Contreras-García
∗,††Sorbonne Université, CNRS, Laboratoire de Chimie Théorique, LCT, 75005, Paris ‡SUSTech International Center for Mathematics, and Department of Mathematics,
Southern University of Science and Technology, 518055 Shenzhen, China ¶Sorbonne Université, CNRS, IBPS, Laboratoire de Biologie Computationnelle et
Quantitative (LCQB), 75005 Paris, France
§Sorbonne Université, Université Paris-Diderot SPC, CNRS, Laboratoire Jacques-Louis Lions, LJLL, 75005 Paris
kDepartamento de Química Física, Universidad de Zaragoza, 50009 Zaragoza, Spain ⊥Sorbonne Université, Institut des Sciences du Calcul et des Données, ISCD #Centro de Física de Materiales CFM-MPC (CSIC-UPV/EHU), 20018 San
Sebastián-Donostia, Spain
@Sorbonne Université, Institut des Sciences du Calcul et des Données, ISCD, 75005, Paris
E-mail: [email protected]
Noncovalent interactions are of utmost importance. However, their accurate treat-ment is still difficult. This is partially induced by the coexistence of many types of interactions and physical phenomena, which hampers generality in simple treatments. The NCI index has ben successfully used for nearly over 10 years in order to identify, analyze and understand noncovalent interactions in a wide variety of systems, ranging from proteins to molecular crystals. In this work, the development and implications of the method will be reviewed, and modern implementations will be presented. After-wards, some sophisticated examples will be given that showcase the current advances towards the fast, robust and intuitive identification of noncovalent interactions in real space.
Introduction
NonCovalent Interactions (NCIs), both within and between molecules, are important in all branches of chemistry. While individual NCIs are usually weaker than their classically estab-lished covalent and ionic counterparts, they boast unmatched ubiquity: they are everywhere, and it is the sum of such many tiny factors that governs, as an emergent property, complex systems. Just to list a few relevant examples, NCIs are relevant in molecular recognition,1 protein folding and unfolding,2 and the storage of genetic information.3,4
The generalized importance of NCIs, however, signals the gist of the problem. When we speak of NCIs we usually encompass several wildly different physical origins: hydrogen bonds, halogen bonds, π − π stacking, van der Waals interactions, and a long list thereafter. Due to this, chemical intuition which may suffice for covalent bonds often fails to identify NCIs. An undeniable consequence is that the aforementioned list of NCI types is neverending, with newly defined NCI types being added every few years (e.g. π−cation, S−cation, pnictogen bonds).5–7
At the same time, computationally characterizing NCIs is far from trivial. When ap-proached from the perspective of quantum mechanics, which is holistic, several issues arise
immediately. First of all, the tiny energies involved in individual interactions compared with the grand total energy terms from the Hamiltonian. Secondly, the cooperative nature, which shines in large systems where the exponential scaling of quantum chemical computations can rarely be applied. Luckily, in recent years there has been a significant advancement in computational techniques, both from wavefunction-based approaches8 and, perhaps even
more so, stemming from Density Functional Theory (DFT).9–11
Nevertheless, there has to be a link between accurate theory and interpretation. For instance, in the construction of classical many-body potentials or simple representations for machine learning of potential energy surfaces, one does need accurate values for interaction energies but also a physical basis, a fundamental understanding. Many approaches coexist in this regard.12–15 Sometimes the basal representation of some NCIs differs wildly between
different scientific communities, arising from mathematical models that include significant assumptions (eg. the multipole expansion) or that only tackle a few types of interaction (eg. the secondary interaction model16), with sometimes conflicting results.17 The underlying issue at hand is the decomposition of interaction energies in several distinct contributions with a chemical interpretation.
Historically, NCIs have been decomposed in several distinct contributions: electrostatics, polarization, exchange and charge-transfer effects.18As a zeroth-order approximation, forces
between molecules must arise from the interaction of permanent electric moments over a large distance, due to Coulomb’s law. This term is easy to estimate from frozen charge distributions, for example using Symmetry Adapted Perturbation Theory or the Interact-ing Quantum Atoms framework.8,19 However, such interactions will naturally polarize both charge distributions, generating induced electric moments and resulting in higher order cou-plings that must be truncated at some point. Assuming that exchange and charge-transfer effects are shorter ranged than electrostatics, attractive NCIs are either dominated by po-larization terms and thus usually called van der Waals interactions, or mainly electrostatic in nature, which generally results in stronger forces (e.g. hydrogen bonds, π-cation
interac-tions). Unequivocally quantifying exchange and charge-transfer effects is extremely hard.20,21 A possible approach is studying NCIs through the electron density ρ(r) and its derived scalar and vector fields. Such approach shares the key concept of DFT: the electron density can be directly related to the energy, and therefore we should be able to study interactions purely from the density as well. Coincidentally, all contributions to the interaction energy except for zeroth-order electrostatics can be associated with a deformation in ρ(r). These methodologies have several natural interpretative advantages. They are invariant with re-spect to unitary transformations of molecular orbitals, they are generally robust, and can be examined visually due to their three-dimensional nature. For more than 30 years, such tech-niques have been used to understand fuzzy chemical concepts, such as bonds and atoms.22–24
Among the real-space framework, the NCI index25 stands as an approach dedicated
to NCIs. As we approach the 10th anniversary of the method, which inherits the main
advantages of its predecessors (such as AIM), an overview of recent implementations, past success and future perspectives is due.
The NCI index and its interpretation
The reduced density gradient
The NCI index arises from the study of the reduced density gradient, s(r). This gradient was first conceived as a correction for semilocal density approximations in DFT.26 It is a simple function of the electron density, ρ(r), and its gradient (Eq. 1):
s(r) = 1 Cs
|∇ρ(r)|
ρ(r)4/3 , (1)
where Cs = 2(3π2)1/3. At first glance, s(r) is an adimensional measurement of the
inhomogeneity of the density at a point of space r, because it measures the ratio at which the density changes with respect to the uniform electron gas. Therefore, it vanishes everywhere
in a uniform electron gas. However, it is also a quantity that can be interpreted in real molecular systems, where the electron density is quite far apart from that of an uniform electron gas.
The reduced density gradient does not have an upper bound, and will be maximal when the density vanishes faster than the gradient. This is the case, for example, in the valence density of most systems, but specially when far away from nuclear positions where ρ(r) → 0 and consequently s(r) → ∞. In general, the situations where it takes very low values are far more interesting, as the lower bound of 0 is well characterized.
There are two types of situations in which ∇s(r) = 0. The first possibility is that ∇ρ(r) = 0, and therefore, ρ(r) has a Critical Point (CP). Such points have been thoroughly studied in the context of the Atoms-In-Molecules theory (AIM)23,27 and thus the points
belonging to this situation in s(r) have been termed “AIM-CPs”.28 AIM-CPs are found in
most covalent chemical bonds, nuclear positions (cusps), ring centers, and other characteristic emplacements that have already been interpreted by AIM theory, and discussed over the years.29
Likewise, traditionally AIM-CPs are classified according to the components of the Hessian of ρ(r) with respect to r = (x, y, z) in the CP. Diagonalization of the Hessian H(ρ, r) leads to three eigenvalues λ1, λ2 and λ3 that add up to the Laplacian of the electron density
∇2ρ(r). There are only four possible types of AIM-CPs, depending on S = P3
i λi/|λi|,
which measures the definiteness of H(ρ, r):
• S = −3 for local maxima, generally on nuclear positions.
• S = −1 in saddle points which typically appear in covalent bonds (e.g. C−C axis of ethane).
• S = +1 in saddle points which typically appear in rings (e.g. center of benzene). • S = +3 for local minima which typically appear in molecular cages (e.g. center of
The interpretation of such points is given by the AIM theory. Most typically, they are classified in terms of the Laplacian, ∇2ρ(r), into shared-shell (i.e. covalent) interactions if
∇2ρ(r) < 0; and closed-shell (e.g. ionic and weak interactions) if ∇2ρ(r) > 0. All these
situations are recovered by NCI as AIM-CPs.
The other situation in which ∇s(r) = 0 corresponds to situations in which ∇ρ(r) 6= 0, which have been called “non-AIM-CPs”. In these points, the following equality holds (Eq.
2): ∇2ρ(r) ρ(r) = 4 3 (∇ρ(r))2 ρ2(r) (2)
From Eq. 2it can be inferred that in this case the Laplacian is always positive, so we are in the closed-shell interactions case. Effectively, these points correspond to regions where the density is varying very slowly, with a global charge depletion.
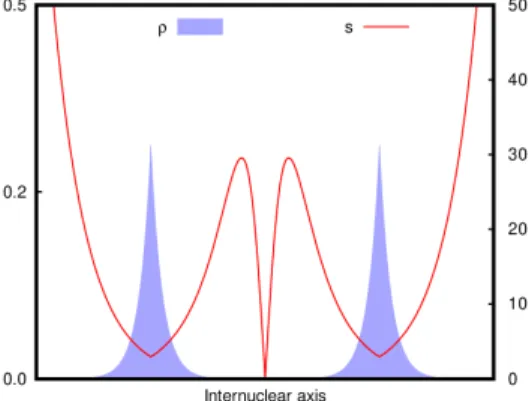
The situation that such points encompass can be understood from a schematic model of two atoms with a linear combination of exponential Slater type orbital on each. If the atoms are close and the densities overlap, the total density will show the features of a typical covalent AIM-CP. However, if the two orbitals overlap in a region in which their exponential decay is asymptotic (∇ρ(r) ≈ 0), the resulting density may present a non-AIM-CP (Fig. 1).
Figure 1: ρ and s along the internuclear axis of a model system that is governed by two weakly interacting exponential cusps.
been put forward from other contexts: interactions are signaled by deviations from simple exponential decay.30,31 Similarly, the anihilation between exponentials of opposite phase is
exploited in the Independent Gradient Model, a remarkable derivation from the NCI index methodology.32,33
Due to the continuous nature of s(r), points in which s(r) = 0 are surrounded by low-valued regions. In fact, properties of s(r) isosurfaces are determined by their critical points: components of the surface points originate at minima of the function. Consequently, the analysis is typically performed by using small isosurfaces of s(r), which better reflects the often delocalized nature of NCIs. This methodology is also far less computationally demand-ing than the calculation of all the CPs of s(r) and allows for a visual mergdemand-ing of spurious local minima.
Physical interpretation
Although an interpretation in terms of exponential decays is understandable from a mathe-matical standpoint, it lacks connection with physical quantities. s(r) is an indicator of the bosonic character of the system because it is the kernel of the bosonic kinetic energy density τbose(r) (Eqs. 3 and 4):28
τbose(r) = 5 3s 2(r) = τw(r) τT F(r) (3) ∇τbose(r) = 10 3 s(r)∇s(r) (4)
where τT F(r) = 3/10(3π2)2/3ρ(r)5/3 is the Thomas-Fermi kinetic energy density and
τw(r) = 1/8(∇ρ(r))2/ρ(r) is the von Weizsäcker kinetic energy density. Recalling that the
von Weizsäcker term is appropriate for single-orbital systems, while the Thomas-Fermi term is a typical scaling factor to avoid nuclear preponderance, the physical interpretation of this function is straightforward: τbose(r) measures the single-particle character of the system,
Note that this interpretation is coherent with the previous observations on the behavior of s(r). For instance, nuclear cusps (assuming that the Kato cusp is described through gaussian functions) will present an AIM-CP, which is a CP of ρ(r) with S = −3, and marked single-orbital character. By construction, τbose(r) is not limited to the identification of NCIs.
Hence, neither is s(r).
In this sense, using s(r) is based on similar grounds to other real-space functions, as the Electron Localization Function (ELF),24,34 the Localized Orbital Locator (LOL),35 and other successful descriptors. In fact, a simple bound function χ(r) = 1/(1 + τbose(r)) can be
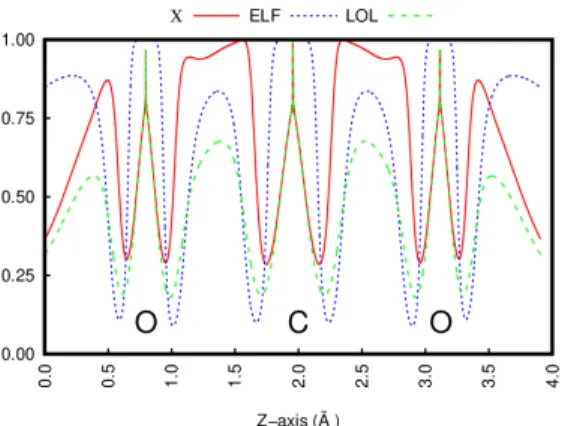
defined that is suitable for the elucidation of bonding patterns. In Fig. 2 we can see how the Lewis pattern of CO2 is revealed by χ and coincides with previous localization functions: nuclear positions, the C-O bond and the lone pairs appear as maxima of χ (minima of τbose).
It should be noted that a structuration appears in the bonding region highlighted by χ which corresponds to an ionic contribution (i.e. a polar covalent bond).36
Figure 2: χ, ELF, and LOL along the Z-axis of the CO2 molecule. Nuclear positions are indicated by the respective atomic symbols.
This is the reason why the NCI index succeeds even when AIM theory fails, and belongs to the significantly more sophisticate descriptors based on the kinetic energy density and/or H(ρ, r). Just like the evolution of DFT has shown, these two quantities often carry useful information. Limiting ourselves to AIM theory, significant chemical features such as lone pairs and weak-interactions would remain invisible. Instead, as shown in Fig. 2these are all simultaneously revealed by NCI.37,38
Qualitative analysis
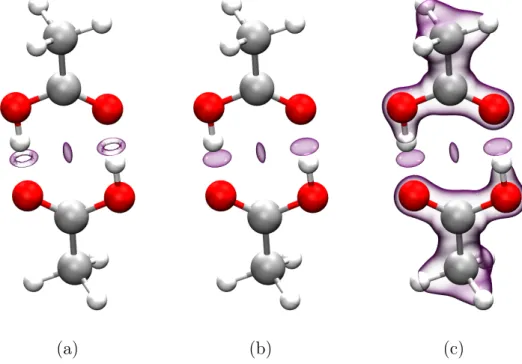
In the previous sections we have detailed why regions with low s(r) correspond with NCIs from both an applied and a theoretical perspective. The simplest way to visual inspect such regions is plotting low-valued isosurfaces, typically s(r) = 0.3 − 0.5, in 3D. However, low s(r) regions also identify all AIM-CPs (e.g. covalent bonds). If one wants to focus on NCI regions only, the simplest approach is to select a small cutoff of ρ(r), because we know that, unlike NCIs, bonds and nuclei have large density values. This is significantly faster and computationally cheaper than characterizing each CP, which would be the more rigorous alternative, and provides a clean view. The effect of this procedure is highlighted in Figure
3, in which all intramolecular covalent interactions are discarded by imposing a simple cutoff.
(a) (b) (c)
Figure 3: s(r) = 0.5 isosurfaces on the acetic acid dimer. (a) with a ρ(r) = 0.05 cutoff (b) with a ρ(r) = 0.08 cutoff (c) without any cutoff.
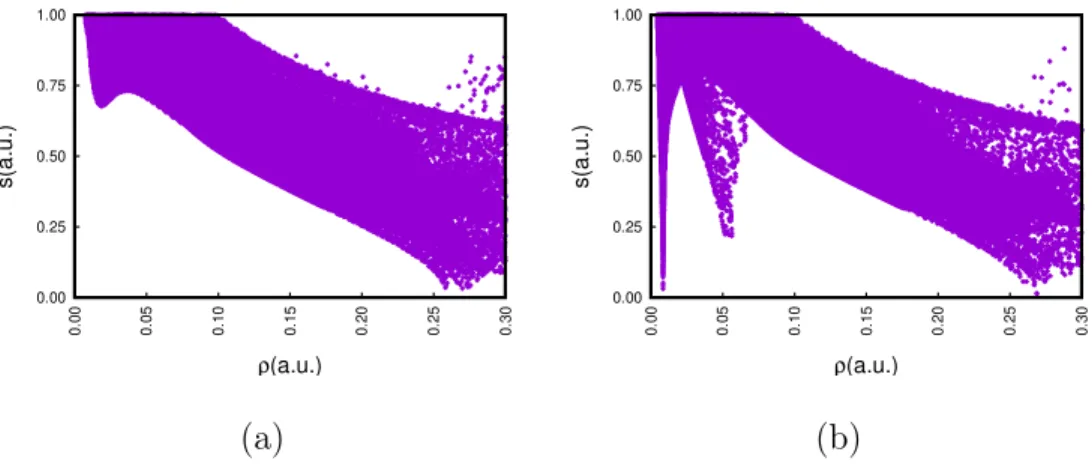
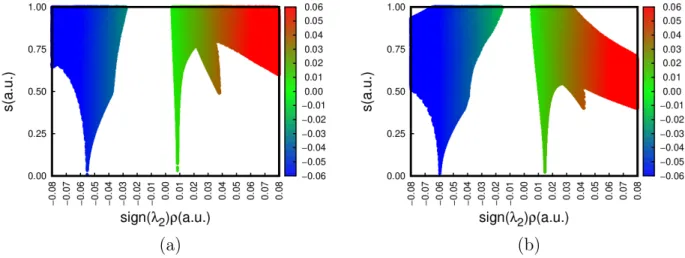
Establishing a proper cutoff for the density can be done with ease using a 2D representa-tion of s(r) against ρ(r) for all r. Covalent bonds correspond to the rightmost peak in Figs.
in leftmost region of 4b1, the dimer, matching chemical insight. The thin peak at ρ = 0.09 corresponds to the van der Waals blob in the C−C axis, while the strong hydrogen bonds correspond to the second peak, with ρ ≈ 0.05. Note that, in this case, an appropriate density cutoff is higher than 0.05 in order to properly accommodate the density of the entire second peak. Therefore, Fig. 3a is not an ideal representation, and the strong hydrogen bonds show a hole that disappears upon increasing the cutoff (as in Figs. 3b and c). 2D representations are always advised in order to properly select a density cutoff and avoid this issue.
(a) (b)
Figure 4: s(r) against ρ(r) plots for (a) the acetic acid molecule and (b) the acetic acid dimer as in Fig. 3.
It is also possible to qualitatively classify interactions to complete the NCI characteriza-tion. The previous 2D representations can be unfolded by plotting s(r) against the product of the density and the sign of the second eigenvalue of H(ρ, r). This is normally expressed as sign(λ2)ρ(r). The sign of λ2 measures charge accumulation in the perpendicular plane
of the interaction. The function sign(λ2)ρ(r) is able to classify interaction types: strongly
attractive (e.g. hydrogen bonds) < 0, van der Waals ' 0 (irrespective of the sign) and steric clashes > 0. For instance, S = +1 and S = +3 AIM-CPs are revealed as steric clashes from this classification since several atoms are simultaneously contributing to the electron density at these points.
1A deviation might have been spotted even in the case of the monomer. This is indeed a weak O-H
A color code based on sign(λ2)ρ is often used to connect the 2D and 3D representations.
An example is shown in Figure5for several base pairs present in RNA. The colored peaks in the 2D graph correspond to the regions with the same colors enclosed by the 3D isosurfaces.
(a) (b) (c)
Figure 5: s(r) = 0.5 isosurfaces and corresponding 2D plots colored by sign(λ2)ρ(r) for
several dimers in 3D and 2D. (a) Hypoxanthine–Adenine (b) Hypoxanthine–Cytosine (c) Hypoxanthine–Uracil
Note that Fig. 5b shows the strongest interactions qualitatively, as the peaks belonging to hydrogen bonds are further shifted to the right (more electron density with negative λ2) and
van der Waals interactions are abundant. This is expected because there are two hydrogen bonds and a third, presumably weaker carbon-hydrogen bond thanks to the available oxygen atom in cytosine. This third interaction is absent in 5a and significantly weaker in 5c because there is no proper electronegative atom for the polar hydrogen to interact with. As before, the rightmost peak corresponds to steric clashes in the center of the five-membered rings, which are S = +1 AIM-CPs. The position of this peak stays constant in this series because it originates in the hypoxanthine monomer. The hydrogen bonds and van der Waals interactions that constitute the NCI-bound dimer are all captured by the isosurfaces.
without any a priori knowledge about them. It is therefore a very powerful tool for identi-fication and interpretation of quantum chemical calculations, but it can also be applied in many more contexts that will be covered in the next sections.
Quantitative analysis
Revealing and classifying NCIs is the most important feature of the NCI index method. However, such representations lack any energetic meaning on their own. This is not a irredeemable problem, because the coherent application of the method stems from DFT. Therefore, from the self-consistent electron density, one can obtain the energy (using a density functional approximation) and also an interpretative picture (using s(r)). In any case, it would be desirable to obtain a direct NCI index–interaction energy relationship that quantitatively justifies what is often evident upon visual inspection, which would also enable to go beyond SCF densities (e.g. to obtain energy estimates from promolecular densities).
Remarkably, this would improve upon current methodologies because the interaction energy of individual contacts is generally burdensome and limited to a very small number of atoms.39 Therefore a general and robust measure would provide much needed insight.
As the low density peaks in the 2D diagram can be understood as genuine deformations due to interactions, the key idea is that some subset of points CN CI, or perhaps a bound
region ΩN CI given by a NCI surface, SN CI, should account for the interaction locally. This
is inspired by, for example, the well-known correlations between ρ(r) in the CP of covalent bonds and their bond dissociation energy, or ELF basin populations which are assimilated to bond orders. However, these approaches lack generality and are applicable only along isoelectronic series.
So far, the most successful, general and robust approach has been obtaining an interacting charge QN CI by integrating the electron density over a subset of points Cint. The most
QN CI =
Z
r∈CN CI
ρn(r)dr3 (5)
where ρn(r) is the nth power of the density at the points in the CN CI subset.
Analo-gous treatment can be performed using different scalar fields, such as the positive kinetic energy density),35,40–44 the molecular virial field23,45–47 and the energy density.48 However, the most meaningful results are obtained using simple powers of the electron density as the the integrand. Another viable option that is native to the NCI index is integrating sign(λ2)ρ,
which accounts for the attractive or steric clash nature of the interaction. Typical values of n obtained from fittings lay in the range [1,3].
Once an integrand has been chosen, one needs to define CN CI. Several approaches have
been tested in this regard as well. In general, it has been found that just using a bounding isovalue of s(r), for instance 0.5, is not enough to properly relate interaction energies with QN CI. Indeed, this approach enables to characterize bonding but only within the same
family.49 The question would then be whether very different chemical species can be evenly
represented in spite of the fact that some systems are much richer than others in terms of electron density.
The most successful definition so far, based on empirical observations, uses a combination of criteria to define the interacting region. It is based on identifying the points which are intramolecular. This is done as follows: ρ(r) is decomposed in terms of i monomer contributions, ρi(r) such as ρ(r) = Piρi(r). There are several different ways to do this,
including using parametric additive densities (which are trivially separable) and assigning basis functions to fragments according to the center they arise from (i.e. Mulliken or Coulson localization). Any decomposition scheme is viable.
Once the density is partitioned, points in which one of the monomers is dominant are removed using a threshold value γref. This first step is meant to remove all intramolecular interaction regions. Then, a maximum value sref(r) is used, just like in visualization. The
procedure is detailed in Equation 6. r ∈ CN CI s(r) < sref(r) ρ(r) < γrefρ i(r) ∀i (6)
γref is an empirical threshold value, typically around 0.95 for i = 1, 2 dimers. A
reason-able isovalue such as sref(r) = 1.0 is also recommended. Such a definition provides distinct
unconnected regions for individual interactions, which is advantageous.
With this approach, a remarkable correlation (R2 ≈ 0.94) between interaction energies
and QN CI has been obtained in the S66 database.50 Additionally, the approach is able to
dissect dissociation curves, and works with very crude input densities.?
However, this does not mean that other approaches can not be meaningful.51 The corre-lations observed, which are purely empirical, are strong and robust enough to suggest that, indeed, a transferable Ansatz exists that can potentially be quantitative, just as the visu-alization procedure seems to work irrespective of the chemical system. Further efforts in this direction are on the way, which may be explored using machine learning approaches as well.52
The open questions in this regard are thus two: what is the proper integrand to consider in Eq.5and what is the proper definition to consider in Eq.6. A theory-driven answer is on its way. Meanwhile, the approach detailed in Boto et al.50is not far from other approaches in
terms of correlation. For instance, the XLYP interaction energies of the S66 set (as collected in the GMTKN55 database53) with respect to the reference data have a value R2 = 0.799,
which improves to R2 = 0.991 with D3 dispersion corrections. The PBE functional scores
R2 = 0.883 without corrections for the same set. However, the descriptors based on s(r) proposed so far do not necessarily require an self-consistent field procedure (see next section for more detail) and have, comparatively, much less empirical parameters.
Input densities
One of the main advantages of the NCI index is the independence from the a priori knowledge of the interaction itself. To calculate s(r) only the electron density is required, so that it can be applied to identify interactions which have not been previously characterized (unlike force fields). In principle, DFT calculations can provide good self-consistent densities, which are not very far away from the exact one, thanks to the Kohn-Sham formulation. Hence, a Kohn-Sham DFT calculation is the most straightforward way to generate an input for an NCI index analysis. In practice, energies in DFT converge with basis set size significantly faster than wavefunction methods, but a triple-ζ quality basis set is recommended for accurate calculations. In this sense, note that a converged energy implies a converged density. For interpretative purposes, DFT-oriented double-ζ basis sets are usually sufficient due to their diffuseness.54
However, performing a full self-consistent DFT calculation is not always possible when-ever the size of the system is very large, even though linear scaling methods are increasingly developed.55 This is unfortunate, as more often than not it is in large systems where NCIs
shine the most (e.g. proteins, nucleic acids, nanomachines). On top of this, these systems also present a large amount of conformational degrees of freedom that further increase the computational cost.
An alternative to linear-scaling DFT is known as partition DFT.56 In this approach, the total system is approximated by a series of self-consistent fragment densities, which are then allowed to interact with each other. Analogously, the total density of a large system can be approximated by combining the self-consistent densities of smaller, tractable fragments. By doing so, it is found that regions that correspond to NCIs are often negligibly distorted. This is so because orbital overlap in such regions is near zero.
Therefore, as an approximation, fragment densities which are cheap to calculate can be used to reconstruct a total density, which can be analyzed using s(r). The density cutoff
interaction would be significantly larger. Thus, at least qualitatively, NCIs can be studied from fragments.
Depending on the desired accuracy, different levels of approximation are available. The full wavefunction is obviously the ideal case (Fig.6a), followed by the sum of localized frag-ments, which arise from self consistent monomer wavefunctions that have undergone a lo-calization procedure57–59and later have been orthogonalised. Fig. 6b shows the example for NCI derived from a Natural-Bond Orbital localized DFT calculation of each monomer. The simple sum of fragment self-consistent densities is significantly worse than the localization procedure. Fig. 6c shows the results for a DFT calculation on each monomer. The cheapest yet crudest approximation is known as the promolecular approximation, in which atomic or-bitals are used to reconstruct the full density (Fig. 6d). Note that levels (c) and (d) formally correspond to densities that arise from wavefunctions that are not properly antisymmetric.
(a) (b) (c) (d)
Figure 6: s(r) = 0.5 isosurfaces colored by sign(λ2)ρ(r) for the acetic acid dimer with
densities from different sources: (a) DFT calculation of the dimer (b) Natural-Bond Orbital localized DFT calculation of each monomer (c) DFT calculation on each monomer (d) s(r) = 0.4 isosurface using atomic densities (promolecular).
Albeit significantly worse, the promolecular approximation has negligible cost. Atomic densities can be parametrized as exponential functions which have very accurate decaying tails, which are then simply positioned at nuclear positions.38,60 The resulting densities and
(a) (b)
Figure 7: 2D NCI analysis of the acetic acid dimer using densities from different sources: (a) DFT calculation on the dimer (b) atomic densities (promolecular).
gradients are representative in the weakly interacting areas (Fig. 7b), but these densities are usually more diffuse than the calculated counterparts (Fig. 7a) (Figures for other input densities can be found in S.I.). Therefore, a lower isovalue of s(r) = 0.3 is usually advised, and higher density values can be expected in such regions. Nevertheless, this is optimal for treating large conformational spaces. The major limitation is accurately treating charged or radical species, which is nigh impossible with such an approach because atomic densities can not properly reproduce delocalized charge carriers.
A fifth option is to use experimental densities from X-ray diffraction experiments. This can be done through numerical derivatives of the electron density61or after constraining them
to a particular wavefunction form.62,63 After all, the electron density is an experimentally
available observable.
However, it must always be taken into account that mixing densities from different sources is not trivial, and that combining densities from different sources without proper post-processing might produce very erroneous gradients and hence distorted interpretation. Caution is advised. There is no absolute reason for an interpretation to be good if the density approximation is not.
Computational implementation
Several noteworthy remarks have been put forward in the previous sections that contribute towards the scalability and speed of the NCI index analysis. First and foremost, all the points in which s(r) = 0 need not be characterised because a density cutoff is in place that can be inferred from the 2D diagram.
Therefore, grid-based implementations are simple, and just involve calculating s(rj) at
every point j of a finite grid after checking that ρ(rj) is smaller than the density cutoff of
choice. The density, which is required in s(rj), can be obtained from different sources, as
explained in the previous section. For wavefunction based densities, ∇ρ(rj) can be calculated
from the derivatives of the basis set functions, which are often analytical. In promolecular densities this is even simpler because of the simple exponential form of atomic densities. The grid is usually set in a way that covers the molecular coordinates, and is denser or coarser depending on the required accuracy. For instance, integrations based on s(r) will require fine grids to converge. This is due to the presence of higher density points near the boundary of the integration region.
After s(rj) is calculated at every point of the grid, values of the reduced density gradient
will show regions where single-orbital character is maximal, and thus will reveal NCIs. This algorithm was naively implemented in the first published code for NCI index analysis.60
A number of improvements can speed up the procedure significantly. Indeed, the calcu-lation of s(rj) is trivially parallelizable if analytical gradients are available. However, the use
of dense grids might still be computationally demanding, specially memory-wise. Therefore, an adaptive scheme was proposed recently50 to help tackle larger molecules faster and more
efficiently.
The adaptive algorithm uses several nested regular grids. The procedure starts with a coarse grid (Fig. 8a), computes the required ρ and s in all points of the grid in the active area (violet zone in Fig. 8), then builds an αl-times denser grid containing only the regions
(a) (b) (c)
Figure 8: Schematic representation of a three-step adaptive grid procedure with αl = 2.
Active regions are colored purple, colorless areas are inactive.
sure peaks are not missed due to the very coarse grid. After the identification of important grid points, ρ and s are computed again, and the process proceeds until the user defined number of steps is reached (Fig. 8c). The complete procedure is schematised in Fig. 8 for a three-steps implementation in which αl = 2 at each step. Areas without color contain
discarded points in which functions are not evaluated anymore. Naturally, the number of iterations and the value of αl can be adjusted to ensure maximal performance for different
steps.
Applications of the NCI index
The possible applications of the methodology are many and diverse. A few examples will be showcased in this section to illustrate the various fields of application. Most specifically, we will dwell on an example of new bond types (the tetrel bond), material science (adsorption on graphene flakes) and biochemistry (the DNA double strand and a protein-ligand interaction).
Analysis of new bonding situations: tetrel bonds
Analogous to hydrogen bonds, tetrel bonds are NCI where the bridging atom between a Lewis base and an electron withdrawing atom is one of the tetrel (C,Si,Ge, etc.) family, which presents a local electron deficiency (σ-hole).64In a way, they are analogous to pnictogen and
chalcogen bonds, but the relevance of carbon in organic chemistry and biochemistry makes tetrel bonds more enticing. For instance, the significance of tetrel bonds as a preliminary step of SN2 reactions has been pointed out.65
At the same time, carbon is electronegative and small, therefore the σ−hole of sub-stituted alkyl moieties are small and tetrel bonds with such holes are generally weak and consequently hard to model. Furthermore, they might bypass chemical intuition, and thus be ignored whenever they play a key role. Even weak NCIs might be determining in tran-sition structures. The NCI index, which needs no a priori knowledge of the underlying interactions, can be used to reveal tetrel bonds – and any other weak interaction.
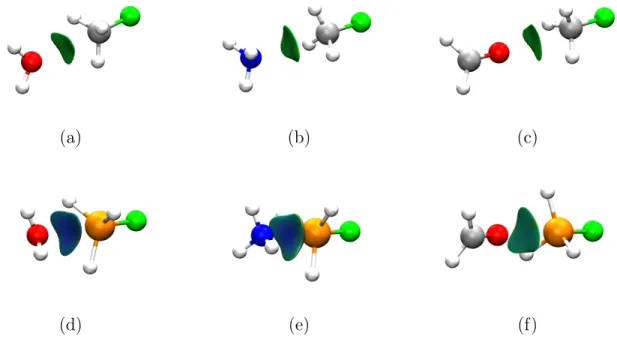
Six different models were optimized at the CAM-B3LYP-D3BJ/def2-TZVP level: F−CH3···B and F−SiH3···B with B=H2O,NH3, CH2O. Very flat minima were found in all cases cor-responding to interactions between the available electron pairs in B and the σ-hole of the tetrel moiety. NCI index analysis for all six systems is shown in Fig. 9in 3D.
(a) (b) (c)
(d) (e) (f)
Figure 9: s(r) = 0.5 isosurfaces colored by sign(λ2)ρ(r) for several tetrel bonds: (a)
F−CH3···OH2 (b) F−CH3···NH3 (c) F−CH3···OCH2 (d) F−SiH3···OH2 (e) F−SiH3···NH3 (f) F−SiH3···OCH2. C, H, Si, F, N and O atoms are colored grey, white, orange, green, blue and red respectively.
As it can be seen in Fig.9 (a) to (c), the tetrel bond imposes a linear arrangement of B with respect to the C−F axis. Equilibrium distances are significantly longer than those present in covalent bonds, and the interaction is identified as weak by the NCI index criteria due to the low density in the region. However, treading down the group, Si is far less electronegative than C. In Fig.9 (d) to (f) a much thicker, bluish isosurface can be seen, signaling increased interaction strength. In fact, both Fig.9(d) and (e) are comparable to a typical NCI index depiction of a hydrogen bond due to the increased basicity of ammonia and water compared to formaldehyde.
This is in agreement with the equilibrium distances, which are reduced significantly for Si compared to C:3.00 Å, 3.18 Å and 3.01 Å in Fig.9 (a), (b) and (c) respectively shrink to 2.72 Å, 2.56 Å and 2.90 Å in (d), (e) and (f). However, distances do not capture the behavior of the system: counterpoise corrected interaction energies increase at a much different rate, just from 1.74 kcal/mol in (c) to 2.96 kcal/mol in (f), but much more significantly in the other cases: 1.91 kcal/mol (a) to 4.45 kcal/mol (d) for H2O and 2.10 kcal/mol in (b) to 8.40 kcal/mol in (e) for NH3. Simply inspecting the NCI analysis using s(r) may have sufficed to guess that, in spite of the similar distances and the involvement of an oxygen atom, the interaction energy in H2O···SiH3F (Fig. 9(d)) is larger than in CH2O···SiH3F (Fig.9(f)).
All in all, being based on the electron density, the NCI index can be useful to identify unexpected NCIs, including the newest additions, such as is the case of tetrel bonds.
Analysis of heterogeneous catalysis: graphene sites
Graphene is a promising carbon allotrope with many applications in development. A plau-sible use of graphene layers is the enhanced adsorption of chemically inert species such as CO2. However, the chemical and physical properties of graphene can also be tuned with the inclusion of boron and nitrogen atoms in the periodic lattice.66,67
While calculating adsorption pathways of small molecules in graphene is feasible with modern DFT methods, interpreting results is not always straightforward. Why is a site
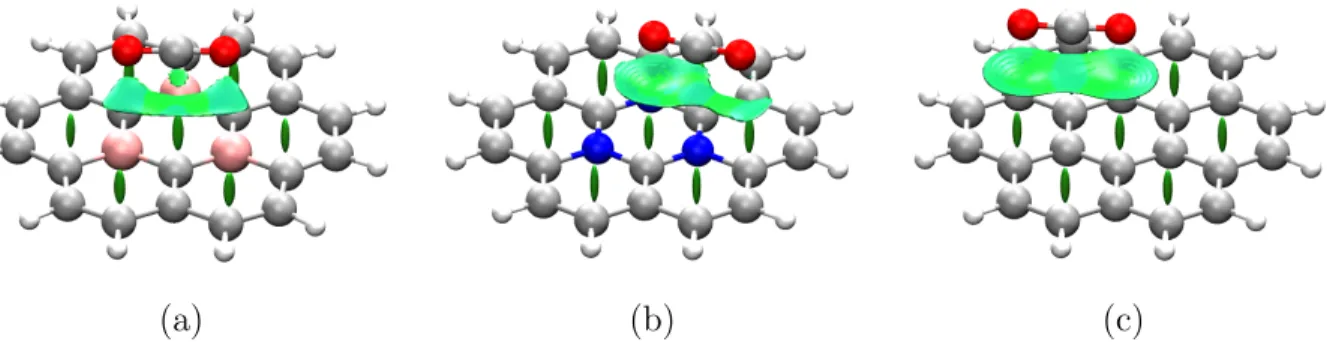
pre-ferred over another? As an example, B3LYP-D3BJ/def2-TZVP calculations were performed of the CO2 molecule adsorbed over different graphene flakes, including B and N-doped cases. Local minima were found in the potential energy surface, and the resulting densities were analyzed using the NCI index. 3D results are presented in Fig. 10.
(a) (b) (c)
Figure 10: CO2 adsorption on top of different graphene-like flakes: (a) B-doped graphene (b) N-doped graphene flake (c) non-substituted graphene flake .
Visualizing the NCI index results, it becomes apparent that sites are determined by balancing out local pairwise interactions between atoms. For instance, in the case of boron doping (Fig. 10a), two O···B interactions can be seen, oxygen atoms sitting just atop boron atoms, which suggest a deficit of electron density in the B-substituted sites that makes them suitable for nucleophilic attack. A different result is observed for the nitrogen doped case (Fig.10b), where oxygen atoms sit on top of the middle of the triply substituted triazine ring, revealing a O-π hole interaction. It is interesting to note that O···N interactions seem to arise in spite of the total positive charge of the flake. This points to a plausible perpendicularly adsorbed conformation, with one terminal O atom in the middle of the ring.
Finally, in Fig. 10a non local interactions arise, and the location of the minima seems to be fundamentally arising from the van der Waals interaction between the π-system of the flake and the charge distribution of the CO2 molecule.
Therefore, just by computationally sampling some conformations and using the NCI index, we can rationalize that adsorption on non-substituted graphene will not be as effective for the capture and/or activation of CO2 as in the substituted analogues. Furthermore, we can suggest that the adsorption mechanisms will differ between B-doped graphene, which
favors a planar conformation with strong O···B interactions, and N-doped graphene which presents an interaction between oxygen atoms and the π-hole of the triazine moiety.
Analysis of interactions in biomolecules along a molecular dynamics
simulation
The acceleration of NCIPLOT 4.0 over the previous versions of the code opens new possi-bilities in the world of biomolecular applications at the dynamical level. Indeed, molecular dynamics simulations can be used to study large biomolecular systems in realistic conditions over significant timescales. However, such simulations generate very abundant data that re-quires a significant effort to analyze. Additionally, NMR in solution is becoming the method of choice for the experimental determination of protein structures, as they are able to ac-count for their inherent flexibility. Using the simplest promolecular approximation, multiple frames exploring the conformations of a single system can be studied using the NCI index at a negligible cost. The interested reader is directed to Ref.,68 which details the guidelines
for the application of NCI integrals to the biomolecular field.
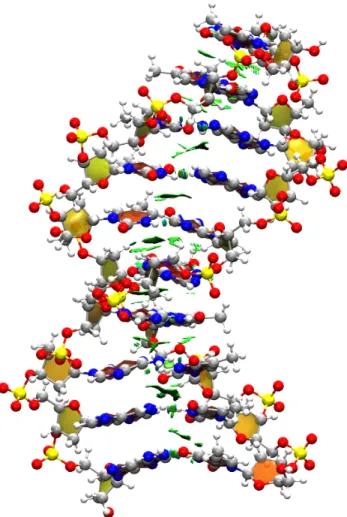
In order to understand inter-strand interactions in nucleic acids, each of the strands can be defined as a fragment. Along with the intermolecular keyword, this simple proce-dure effectively removes intra-strand interactions and isolates inter-strand π-stacking and hydrogen bonding (Fig. 11).
In an MD simulation of the system at equilibrium, we expect inter-strand interactions to be converged. In order to be able to evaluate the strength of all inter-strand hydrogen bonds and π-stacking with a single descriptor, we can follow the evolution of the strongly attractive (sign(λ2)ρ between -0.1 and -0.02) and weakly attractive (sign(λ2)ρ between -0.02
and 0.02) NCI integrals along the molecular dynamics trajectories. Results, shown in Fig.
12, indicate that both contact types are essentially constant along the simulation, which can be therefore considered converged with respect to inter-strand NCIs.
Figure 12: Integrals over time for different sign(λ2)ρ intervals. Integration was performed
with γref = 0.95 and sref(r) = 1.0.
of hydrogen bonds is required. Indeed, most classical dynamics force fields do not have an explicit term to account for hydrogen bonds, which are described by the electrostatic and van der Waals ones. For this reason, analysis of the hydrogen bond network is generally performed after the dynamics with a separate module using geometric criteria (distances and angles between hydrogen bond donors and acceptors). This kind of analysis is therefore capable of following the distribution and frequency of individual hydrogen bonds, but not of evaluating directly their collective strength. NCI integrals, conversely, provide a compact descriptor for all contacts belonging to a pre-defined density range.
In Fig. 12, for instance, it can also be observed how, in the beginning of the trajectory, a small decrease in inter-strand hydrogen bonds is counteracted by an improved inter-strand π-stacking. Therefore, range integration is a tool for the analysis and interpretation of MD calculations that requires no a priori definition of NCIs whatsoever.
This kind of analysis is not only useful to interpret MD trajectories, but also to assess their convergence. Let us consider the example of a protein-ligand interaction, a model of amyloid-β(1-40) (Aβ40) fibril in complex with two fluorescent markers, Thioflavin-T and
NIAD4 (Figure 13).69
Figure 13: Structure of an amyloid-β(1-40) fibril, PDB code 2LMN, and of Thioflavin-T and NIAD-4, fluorescent markers for amyloid detection.
Our starting point is the classical molecular dynamics simulations of the Thioflavin-T/Aβ40 and NIAD-4/Aβ40 complexes. From the trajectories, one hundred frames were extracted for each complex, stripped of water molecules and ions, and processed with NCI-PLOT 4.0. A promolecular run was performed on each frame in the LIGAND mode, setting the cutoffs on the density and reduced density gradient at 0.2 and 1.0, respectively, and using 0.1 Å increments. A cutoff of 4 Å was used for intermolecular interactions.
The resulting 2D plots along the dynamics trajectories are presented in the S.I., and show how the protein-ligand contacts evolve along the frames of the dynamics, with the formation and disruption of hydrogen bonds that contribute to the stabilization of the complexes.
For a more quantitative view of the network of steric clashes and attractive contacts, it is possible to plot the value of the R sign(λ2)ρ2 integral along the frames of the dynamics
simulations integrating over three ranges: sign(λ2)ρ2: -0.05 to -0.01, corresponding to
at-tractive interaction, -0.01 to 0.01 to van der Waals, and 0.01 to 0.05 to the so-called steric clashes. The plots for Thioflavin-T and NIAD-4 are reported in Figure 14 and 15, respec-tively, and show that there is a significant difference between the two molecules. While for NIAD-4 (Figure15) the integrals corresponding to the three types of interaction are constant along the dynamics (oscillating approximately around 0.03 for steric clashes, 0.01 for van der
Waals and -0.06 for attraction), indicating that our dynamics is equilibrated with respect to ligand-protein contacts, for Thioflavin-T we can appreciate a global change of the pattern of non-covalent interaction. Indeed, the integrals of both steric clashes and the attractive component decrease along the frames, indicating that the system is not equilibrated but is adjusting its binding pose. The interesting point here is that this difference can hardly be appreciated looking at the bare interaction energy along the frames, because the simulta-neous loss of attractive contacts and steric clashes leads to contributions of opposite sign to the interaction energy that can cancel out or at least partially compensate each other.52 This means that small differences in the interaction energy can correspond to large changes in the network of non-covalent interactions.
-0.10 -0.08 -0.06 -0.04 -0.02 0.00 0.02 0.04 0.06 0.08 0.10 0 10 20 30 40 50 60 70 80 90 100 R sig n (λ 2 )ρ 2 frames Thioflavin-T
van der Waals attractive repulsive
Figure 14: Evolution of R sign(λ2)ρ2 along the 100 dynamics frames of Thioflavin-T/Aβ40
integrated over three ranges of sign(λ2)ρ2: -0.05 to -0.01 (attractive), -0.01 to 0.01 (van der
-0.10 -0.08 -0.06 -0.04 -0.02 0.00 0.02 0.04 0.06 0.08 0.10 0 10 20 30 40 50 60 70 80 90 100 R sig n (λ 2 )ρ 2 frames NIAD-4
van der Waals attractive repulsive
Figure 15: Evolution of R sign(λ2)ρ2 along the 100 dynamics frames of NIAD-4/Aβ40
in-tegrated over three ranges of sign(λ2)ρ2: -0.05 to -0.01 (attractive), -0.01 to 0.01 (van der
Waals), 0.01 to 0.05 (repulsive). Black lines are guides to the eyes.
This analysis can be used to complete and unravel the values of binding energies; in the widespread MM/PBSA methodology, for instance, the binding energy is evaluated as an average result on a set snapshots extracted from a molecular dynamics trajectory. Performing this NCIPLOT analysis on the same snapshots is a quick way to tell whether the network of weak interactions that are accounted for by the binding energy are constant or subject to fluctuations, which in turn is informative on the reliability of the binding energy evaluation.
Conclusions and Outlook
The NCI index has been successfully used for the identification, characterization and analysis of noncovalent interactions for about 10 years now. We have reviewed the physical basis of the method, the nuanced details of its interpretation, and some key technical features and advances. The existence – and the role – of the density-based cutoff is particularly important to notice in order to properly analyse results.
Furthermore, we have introduced the latest developments in NCI index analysis. In terms of quantitative analysis, the most relevant Ansatz has been presented, which has been shown to correlate with interaction energies over a significant chemical space. In any case, we
have shown how the empirical correlations that are known can be exploited to analyse NCIs in several contexts. Attention from a wider scientific community is brought upon the two highlighted questions: what would be a sensible Ansatz that is not simply based on ρ(r)? and, coupled to it, what is the ideal definition of the interacting region? Further efforts will be devoted to this two questions in the near future.
NCI calculations can be coupled with localization techniques to partition the system of interest. This is particularly viable because NCIs are usually studied between closed-shell systems. Therefore, the exponential scaling on DFT calculations can be minimized and very large systems can be analyzed using very accurate densities. Coupled to the newest algorith-mic developments, gigantic biomolecular structures can be tackled, originating from either experimental crystallography or molecular dynamics simulations. Indeed, NCI provides in a compact format the fundamental information on the evolution of contacts in biosystems as a function of time. It allows to look at the individual regions of sign(λ2)ρ2 corresponding
to attractive, van der Waals contacts and steric clashes rather than at the global interaction energy for each frame. This information can be used both to analyze MD results as well as to asses their equilibration.
All in all, the NCI index offers a fast, intuitive understanding of the interactions that take place in the system, which will hopefully give it another 10 years of helping people characterize weak interactions.
Supporting Information
The following data are provided in the ESI: 1. 2D plots for different densities in Figure 6
Funding
All authors express their gratefulness to LabEx CALSIMLAB (public grant 11-LABX-0037-01 constituting a part of the "Investissements d’Avenir" program - reference : ANR-11-IDEX-0004-02). This work has received funding from the European Research Council (ERC) under the European Union’s Horizon 2020 research and innovation programme (grant agreement No 810367), project EMC2 (JPP and YM). AC, JPP and YM acknowledge the funding of the Institut Universitaire de France. RL thanks ED 388 for a PhD grant. YM and CQ acknowledge the funding from the PICS-CNRS and the PHC PROCOPE 2017 (Project No.37855ZK).
References
(1) Persch, E.; Dumele, O.; Diederich, F. Molecular Recognition in Chemical and Biological Systems. Angewandte Chemie International Edition 2015, 54, 3290–3327.
(2) Ben-Naim, A. The role of hydrogen bonds in protein folding and protein association. The Journal of Physical Chemistry 1991, 95, 1437–1444.
(3) Watson, J. D.; Crick, F. H. C. Molecular Structure of Nucleic Acids: A Structure for Deoxyribose Nucleic Acid. Nature 1953, 171, 737–738.
(4) Mignon, P. Influence of the - interaction on the hydrogen bonding capacity of stacked DNA/RNA bases. Nucleic Acids Research 2005, 33, 1779–1789.
(5) Ma, J. C.; Dougherty, D. A. The Cation-π Interaction. Chemical Reviews 1997, 97, 1303–1324.
(6) Motherwell, W. B.; Moreno, R. B.; Pavlakos, I.; Arendorf, J. R. T.; Arif, T.; Tiz-zard, G. J.; Coles, S. J.; Aliev, A. E. Noncovalent Interactions of π Systems with Sulfur:
The Atomic Chameleon of Molecular Recognition. Angewandte Chemie International Edition 2017, 57, 1193–1198.
(7) Brammer, L. Halogen bonding, chalcogen bonding, pnictogen bonding, tetrel bonding: origins, current status and discussion. Faraday Discuss. 2017, 203, 485–507.
(8) Hohenstein, E. G.; Sherrill, C. D. Wavefunction methods for noncovalent interactions. Wiley Interdisciplinary Reviews: Computational Molecular Science 2011, 2, 304–326. (9) Burns, L. A.; Vázquez-Mayagoitia, Á.; Sumpter, B. G.; Sherrill, C. D.
Density-functional approaches to noncovalent interactions: A comparison of dispersion cor-rections (DFT-D), exchange-hole dipole moment (XDM) theory, and specialized func-tionals. The Journal of Chemical Physics 2011, 134, 084107.
(10) Grimme, S.; Hansen, A.; Brandenburg, J. G.; Bannwarth, C. Dispersion-Corrected Mean-Field Electronic Structure Methods. Chemical Reviews 2016, 116, 5105–5154. (11) Stöhr, M.; Voorhis, T. V.; Tkatchenko, A. Theory and practice of modeling van der
Waals interactions in electronic-structure calculations. Chemical Society Reviews 2019, 48, 4118–4154.
(12) Hermann, J.; Alfè, D.; Tkatchenko, A. Nanoscale π–π stacked molecules are bound by collective charge fluctuations. Nature Communications 2017, 8 .
(13) van der Lubbe, S. C. C.; Zaccaria, F.; Sun, X.; Guerra, C. F. Secondary Electrostatic Interaction Model Revised: Prediction Comes Mainly from Measuring Charge Accu-mulation in Hydrogen-Bonded Monomers. Journal of the American Chemical Society 2019, 141, 4878–4885.
(14) Pollice, R.; Chen, P. A Universal Quantitative Descriptor of the Dispersion Interaction Potential. Angewandte Chemie International Edition 2019, 58, 9758–9769.
(15) Meyer, B.; Barthel, S.; Mace, A.; Vannay, L.; Guillot, B.; Smit, B.; Corminboeuf, C. DORI Reveals the Influence of Noncovalent Interactions on Covalent Bonding Patterns in Molecular Crystals Under Pressure. The Journal of Physical Chemistry Letters 2019, 10, 1482–1488.
(16) Jorgensen, W. L.; Pranata, J. Importance of secondary interactions in triply hydro-gen bonded complexes: guanine-cytosine vs uracil-2, 6-diaminopyridine. Journal of the American Chemical Society 1990, 112, 2008–2010.
(17) Popelier, P. L. A.; Joubert, L. The Elusive Atomic Rationale for DNA Base Pair Sta-bility. Journal of the American Chemical Society 2002, 124, 8725–8729.
(18) Kitaura, K.; Morokuma, K. A new energy decomposition scheme for molecular in-teractions within the Hartree-Fock approximation. International Journal of Quantum Chemistry 1976, 10, 325–340.
(19) Blanco, M. A.; Martín Pendás, A.; Francisco, E. Interacting Quantum Atoms: A Cor-related Energy Decomposition Scheme Based on the Quantum Theory of Atoms in Molecules. Journal of Chemical Theory and Computation 2005, 1, 1096–1109.
(20) Misquitta, A. J. Charge Transfer from Regularized Symmetry-Adapted Perturbation Theory. Journal of Chemical Theory and Computation 2013, 9, 5313–5326, PMID: 26592269.
(21) Deng, S.; Wang, Q.; Ren, P. Estimating and modeling charge transfer from the SAPT induction energy. Journal of Computational Chemistry 2017, 38, 2222–2231.
(22) Bader, R. F. Atoms in molecules; Wiley Online Library, 1990.
(23) Bader, R. F. A bond path: a universal indicator of bonded interactions. The Journal of Physical Chemistry A 1998, 102, 7314–7323.
(24) Becke, A. D.; Edgecombe, K. E. A simple measure of electron localization in atomic and molecular systems. The Journal of chemical physics 1990, 92, 5397–5403.
(25) Johnson, E. R.; Keinan, S.; Mori-Sanchez, P.; Contreras-Garcia, J.; Cohen, A. J.; Yang, W. Revealing noncovalent interactions. Journal of the American Chemical Society 2010, 132, 6498–6506.
(26) Perdew, J. P.; Burke, K.; Ernzerhof, M. Generalized gradient approximation made simple. Physical review letters 1996, 77, 3865.
(27) Bader, R. F. W.; Tang, T. H.; Tal, Y.; Biegler-Koenig, F. W. Molecular structure and its change: hydrocarbons. Journal of the American Chemical Society 1982, 104, 940–945.
(28) Boto, R. A.; Contreras-García, J.; Tierny, J.; Piquemal, J.-P. Interpretation of the reduced density gradient. Molecular Physics 2015, 1–9.
(29) Shahbazian, S. Why Bond Critical Points Are Not “Bond” Critical Points. Chemistry -A European Journal 2018, 24, 5401–5405.
(30) de Silva, P.; Korchowiec, J.; Wesolowski, T. A. Atomic shell structure from the Single-Exponential Decay Detector. The Journal of Chemical Physics 2014, 140, 164301. (31) de Silva, P.; Corminboeuf, C. Simultaneous Visualization of Covalent and
Noncova-lent Interactions Using Regions of Density Overlap. Journal of Chemical Theory and Computation 2014, 10, 3745–3756.
(32) Lefebvre, C.; Rubez, G.; Khartabil, H.; Boisson, J.-C.; Contreras-García, J.; Hénon, E. Accurately extracting the signature of intermolecular interactions present in the NCI plot of the reduced density gradient versus electron density. Physical Chemistry Chem-ical Physics 2017, 19, 17928–17936.
(33) Lefebvre, C.; Khartabil, H.; Boisson, J.-C.; Contreras-Garcia, J.; Piquemal, J.-P.; Hénon, E. Independent Gradient Model: a new approach for probing strong and weak interactions in molecules from wave function calculations. ChemPhysChem 2017, (34) Savin, A.; Nesper, R.; Wengert, S.; Fässler, T. F. ELF: The Electron Localization
Function. Angewandte Chemie International Edition in English 1997, 36, 1808–1832. (35) Schmider, H.; Becke, A. Chemical content of the kinetic energy density. Journal of
Molecular Structure: THEOCHEM 2000, 527, 51–61.
(36) Boto, R. A.; Piquemal, J.-P.; Contreras-García, J. Revealing strong interactions with the reduced density gradient: a benchmark for covalent, ionic and charge-shift bonds. Theoretical Chemistry Accounts 2017, 136, 139.
(37) Lane, J. R.; Contreras-García, J.; Piquemal, J.-P.; Miller, B. J.; ; Kjaergaard, H. G. Are Bond Critical Points Really Critical for Hydrogen Bonding? J. Chem. Theory Comput. 2013, 9, 3263.
(38) Contreras-Garcia, J.; Boto, R. A.; Izquierdo-Ruiz, F.; Reva, I.; Woller, T.; Alonso, M. A benchmark for the Non-Covalent Interaction index (NCI) or...is it really all in the geometry? Theo. Chem. Acc. 2016, 135, 242.
(39) Pendás, A. M.; Blanco, M. A.; Francisco, E. Two-electron integrations in the quantum theory of atoms in molecules. The Journal of Chemical Physics 2004, 120, 4581–4592. (40) Becke, A. Hartree–Fock exchange energy of an inhomogeneous electron gas.
Interna-tional journal of quantum chemistry 1983, 23, 1915–1922.
(41) Cohen, L. Local kinetic energy in quantum mechanics. The Journal of Chemical Physics 1979, 70, 788–789.
(42) Cohen, L. Representable local kinetic energy. The Journal of chemical physics 1984, 80, 4277–4279.
(43) Abramov, Y. A. On the possibility of kinetic energy density evaluation from the experi-mental electron-density distribution. Acta Crystallographica Section A: Foundations of Crystallography 1997, 53, 264–272.
(44) Finzel, K. ELF and its relatives—A detailed study about the robustness of the atomic shell structure in real space. International Journal of Quantum Chemistry 2014, 114, 1546–1558.
(45) Keith, T.; Bader, R.; Aray, Y. Structural homeomorphism between the electron density and the virial field. International journal of quantum chemistry 1996, 57, 183–198. (46) Pendás, A. M. Stress, virial, and pressure in the theory of atoms in molecules. The
Journal of chemical physics 2002, 117, 965–979.
(47) Pendás, A. M.; Francisco, E.; Bueno, A. G.; Vela, J. G.; Costales, A. Applications of Topological Methods in Molecular Chemistry; Springer, 2016; pp 131–150.
(48) Cremer, D.; Kraka, E. A description of the chemical bond in terms of local properties of electron density and energy. Croatica Chemica Acta 1984, 57, 1259–1281.
(49) Saleh, G.; Gatti, C.; Presti, L. L. Energetics of non-covalent interactions from elec-tron and energy density distributions. Computational and Theoretical Chemistry 2015, 1053, 53–59.
(50) Boto, R.; Peccati, F.; Laplaza, R.; Quan, C.; Carbone, A.; Piquemal, J.-P.; Maday, Y.; Contreras-García, J. NCIPLOT4: fast, robust and quantitative analysis of noncovalent interactions. J. Chem. Theo. Comp. 2020,
(51) Contreras-García, J.; Johnson, E. R.; Yang, W. Analysis of hydrogen-bond interaction potentials from the electron density: integration of noncovalent interaction regions. The Journal of Physical Chemistry A 2011, 115, 12983–12990.
(52) Peccati, F.; Desmedt, E.; Contreras-García, J. A Regression Approach to Accurate Interaction Energies Using Topological Descriptors. Comput. Theor. Chem. 2019, (53) Goerigk, L.; Hansen, A.; Bauer, C.; Ehrlich, S.; Najibi, A.; Grimme, S. A look at
the density functional theory zoo with the advanced GMTKN55 database for gen-eral main group thermochemistry, kinetics and noncovalent interactions. Phys. Chem. Chem. Phys. 2017, 19, 32184–32215.
(54) Zheng, J.; Xu, X.; Truhlar, D. G. Minimally augmented Karlsruhe basis sets. Theoretical Chemistry Accounts 2010, 128, 295–305.
(55) Nakata, A.; Futamura, Y.; Sakurai, T.; Bowler, D. R.; Miyazaki, T. Efficient Calculation of Electronic Structure Using O(N) Density Functional Theory. Journal of Chemical Theory and Computation 2017, 13, 4146–4153.
(56) Elliott, P.; Burke, K.; Cohen, M. H.; Wasserman, A. Partition density-functional theory. Physical Review A 2010, 82 .
(57) Carpenter, J. E.; Weinhold, F. Transferability of natural bond orbitals. Journal of the American Chemical Society 1988, 110, 368–372.
(58) Meyer, B.; Guillot, B.; Ruiz-Lopez, M. F.; Jelsch, C.; Genoni, A. Libraries of Extremely Localized Molecular Orbitals. 2. Comparison with the Pseudoatoms Transferability. Journal of Chemical Theory and Computation 2016, 12, 1068–1081.
(59) Meyer, B.; Guillot, B.; Ruiz-Lopez, M. F.; Genoni, A. Libraries of Extremely Local-ized Molecular Orbitals. 1. Model Molecules Approximation and Molecular Orbitals Transferability. J. Chem. Theory Comput. 2016, 12, 1052.
(60) Contreras-García, J.; Johnson, E. R.; Keinan, S.; Chaudret, R.; Piquemal, J.-P.; Be-ratan, D. N.; Yang, W. NCIPLOT: a program for plotting noncovalent interaction regions. Journal of chemical theory and computation 2011, 7, 625–632.
(61) Saleh, G.; Gatti, C.; Lo Presti, L.; Contreras-García, J. Revealing Non-covalent Interac-tions in Molecular Crystals through Their Experimental Electron Densities. Chemistry – A European Journal 2012, 18, 15523–15536.
(62) Jayatilaka, D.; Grimwood, D. J. Tonto: A Fortran Based Object-Oriented System for Quantum Chemistry and Crystallography. Computational Science — ICCS 2003. Berlin, Heidelberg, 2003; pp 142–151.
(63) Arias-Olivares, D.; Wieduwilt, E. K.; Contreras-García, J.; Genoni, A. NCI-ELMO: A New Method To Quickly and Accurately Detect Noncovalent Interactions in Biosystems. Journal of Chemical Theory and Computation 2019, 15, 6456–6470, PMID: 31553606. (64) Bauzá, A.; Mooibroek, T. J.; Frontera, A. Tetrel Bonding Interactions. The Chemical
Record 2016, 16, 473–487.
(65) Grabowski, S. J. Tetrel bond–σ-hole bond as a preliminary stage of the SN2 reaction. Phys. Chem. Chem. Phys. 2014, 16, 1824–1834.
(66) Pan, F.; Li, B.; Deng, W.; Du, Z.; Gang, Y.; Wang, G.; Li, Y. Promoting electrocatalytic CO2 reduction on nitrogen-doped carbon with sulfur addition. Applied Catalysis B: Environmental 2019, 252, 240 – 249.
(67) Sreekanth, N.; Nazrulla, M. A.; Vineesh, T. V.; Sailaja, K.; Phani, K. L. Metal-free boron-doped graphene for selective electroreduction of carbon dioxide to formic acid/formate. Chem. Commun. 2015, 51, 16061–16064.
(68) Peccati, F. NCIPLOT4 Guide for Biomolecules: An Analysis Tool for Noncovalent Interactions. Journal of Chemical Information and Modeling 2020, 60, 6–10.
(69) Peccati, F.; Pantaleone, S.; Riffet, V.; Solans-Monfort, X.; Contreras-García, J.; Gual-lar, V.; Sodupe, M. Binding of Thioflavin T and Related Probes to Polymorphic Models of Amyloid-β Fibrils. The Journal of Physical Chemistry B 2017, 121, 8926–8934.