Assessing the State of Supply Chain Sustainability
byLaura S. Allegue Lara
Master of Business Administration, Universidad Politécnica de Cataluña, 2015 Bachelor of Science, Accounting, Universidad Nacional de San Juan, 2008
and
Ashley Barrington
Bachelor of Science, Fashion Merchandising, Fashion Institute of Technology, 2009 SUBMITTED TO THE PROGRAM IN SUPPLY CHAIN MANAGEMENT IN PARTIAL FULFILLMENT OF THE REQUIREMENTS FOR THE DEGREE OF
MASTER OF APPLIED SCIENCE IN SUPPLY CHAIN MANAGEMENT AT THE
MASSACHUSETTS INSTITUTE OF TECHNOLOGY May 2020
© 2020 Laura S. Allegue Lara - Ashley Barrington. All rights reserved.
The authors hereby grant to MIT permission to reproduce and to distribute publicly paper and electronic copies of this capstone document in whole or in part in any medium now known or
hereafter created.
Signature of Author: ____________________________________________________________ Laura Allegue Department of Supply Chain Management
May 8, 2020 Signature of Author: ____________________________________________________________
Ashley Barrington Department of Supply Chain Management
May 8, 2020 Certified by: ___________________________________________________________________
Alexis H. Bateman Director of MIT Sustainable Supply chains at MIT Center for Transportation & Logistics Capstone Advisor Certified by: ___________________________________________________________________ Yin Jin Lee Ph.D. Candidate & Research Assistant Capstone Co-Advisor
2
Accepted by: __________________________________________________________________ Prof. Yossi Sheffi Director, Center for Transportation and Logistics Elisha Gray II Professor of Engineering Systems Professor, Civil and Environmental Engineering
3
Assessing the State of Supply Chain Sustainability by
Laura S. Allegue Lara and
Ashley Barrington
Submitted to the Program in Supply Chain Management on May 8, 2020 in Partial Fulfillment of the
Requirements for the Degree of Master of Applied Science in Supply Chain Management ABSTRACT
Supply chain sustainability has increased in importance for companies of all sizes, public and private, across a wide range of industries. While there has been increased excitement in tandem with proclamations of lofty goals around the topic of supply chain sustainability, it has proven challenging to operationalize sustainability when many companies focus on short-term financial goals or lack science-and context-based sustainability targets. The focus of this research is to understand current and future supply chain sustainability practices from the perspective of frontline professionals, across industries, geographies, cultures, and regulatory environments in 2019. This research gathered insights and data through a survey distributed to frontline supply chain professionals, executive interviews, and additional research sources. Results confirm increased corporate interest in supply chain sustainability. However, misalignment may exist between executives who set overarching corporate goals and strategies and frontline professionals who are tasked with the tactical implementation of these strategies. Companies struggle to implement sustainability initiatives under constrained resources with conflicting priorities. Results also indicate that companies may be overstating social and environmental goal commitments, as overall investment levels are lower than goal commitment levels.
To better understand these issues and how companies are adopting supply chain sustainability, this research project was commissioned by the MIT Center for Transportation and Logistics and the Council of Supply Chain Management Professionals. To set the stage for future State of Supply Chain Sustainability reports, we will reveal the results of our research on supply chain sustainability in 2019 with an added focus on what the events of 2019-2020, such as the global COVID-19 pandemic that is still unfolding at this writing, could mean for supply chain sustainability in coming years.
Capstone Advisor: Alexis H. Bateman
Title: Director of MIT Sustainable Supply chains at MIT Center for Transportation & Logistics Capstone Co-Advisor: Yin Jin Lee
4
ACKNOWLEDGMENTS
We are extremely grateful to our advisor, Dr. Alexis Bateman, for sharing her passion and knowledge on supply chain sustainability. We also want to acknowledge Yin Jin Lee for her guidance throughout the project and thank her for her technical advice. A special thank you to Toby Gooley for her assistance in reviewing and editing our work. We also wish to thank CSCMP for their contribution and providing the opportunity for us to be part of this important work serving frontline supply chain professionals. The industry experts who shared their perspectives for this research were crucial as we synthesized our findings and we would like to thank them for their contribution. Last but not least, we want to thank the CTL team and our SCM colleagues for their support and enthusiasm during the program.
Laura S. Allegue Lara and Ashley Barrington
This accomplishment is dedicated to all those who encouraged me to chase my dreams and supported me during this endeavor. To my Husband, Mom, Dad, Brother, and Nephews – thank you for your love and energy. Without your help, this achievement would have not been possible. To my mentors, colleagues, and friends who have been by my side throughout this incredible, amazing, and challenging journey, you made an extraordinary experience even more memorable. Laura S. Allegue Lara
I would like to thank my husband for fully supporting me in my academic pursuits without whose encouragement I could not have completed this research project, and my parents, brother, and sister for supporting and motivating me through this time. I would also like to thank my former manager, Susie Breuer, colleagues, and former employer, Stitch Fix, without whom I would not have gone on the path that led me to MIT and gave me the opportunity to contribute to this research. Last but not least, thank you to the industry experts who participated in interviews to share their candid perspectives on the important topic of supply chain sustainability.
5
TABLE OF CONTENTS
List of Figures ... 6
List of Tables ... 7
1. Introduction ... 8
1.1 Role of Supply Chains in Sustainability Today ... 8
1.2 Supply Chain Sustainability: Pressure Sources ... 9
1.3 Supply Chain Sustainability: Adoption Incentives and Challenges ... 11
1.4 Research Gap ... 14
1.5 Research Process Summary ... 15
2. Literature Review ... 16
2.1 Sustainability Concept and Knowledge Evolution ... 17
2.2 Application of Supply Chain Sustainability ... 19
3. Methodology ... 20
3.1 News and Industry Journals ... 23
3.2 Executive Interviews... 23
3.3 Limitations ... 24
3.4 Data Cleansing, Preparation, and Modeling ... 25
3.4.1 Data Cleansing ... 25
3.4.2 Data Preparation ... 26
3.4.3 Modeling Data for Logistic and Linear Regression ... 28
4. Results ... 28
4.1 Respondent Characteristics ... 28
4.2 Survey Results ... 32
5. Qualitative Findings from Executive Interviews ... 44
6. Discussion ... 49
6.1 Key Inferences from Research ... 49
6.2 The Impact of the Coronavirus Pandemic on Supply Chain Sustainability ... 54
6.3 Recommendations to Inform Future Work / Surveys ... 56
7. Conclusion and Future Directions for Research ... 58
References ... 60
APPENDIX A – Survey ... 69
APPENDIX B - Executive interview questions ... 75
APPENDIX C – Logistic regression model results ... 76
6
List of Figures
Figure 1: Root and branch question design with binary and Likert scale answer types 22 Figure 2: Heat map showing respondents’ company headquarters’ location 29
Figure 3: Number of respondents grouped by industry 29
Figure 4: Number of respondents grouped by companies’ number of employees 30 Figure 5: Number of respondents grouped by functional department or position 31
Figure 6: Respondents’ age range and gender 31
Figure 7: Respondent level of engagement with company supply chain sustainability efforts
32
Figure 8: Respondent question skip rate 33
Figure 9: Focus areas for company sustainability goals and commitments 34 Figure 10: Focus areas for company sustainability investment 34 Figure 11: Average level of company commitment to social sustainability goals 34 Figure 12: Average level of company commitment to environmental sustainability goals 35 Figure 13: Top social and environmental sustainability goals by industry 35
7
List of Tables
Table 1: Number of Executive Interviews by Industry Sector 24
Table 2: Sample of Data Dictionary for Analysis Purposes 27
Table 3: Correlation matrix demonstrating relationship between social and environmental sustainability goal commitment
36 Table 4: Correlation matrix demonstrating relationship between sustainability goal
commitment and investment level
Table 5: Average level of pressure to increase supply chain sustainability by source and primary consumer market location
Table 6: Top Sustainability Practices by Industry Table 7: Sustainability Practices Group
Table 8: Logistic Regression Results
37 38 39 39 41
Table 9: Linear Regression Results 42
Table 10: Average level of disclosure frequency by industry sector and channel, scores above 3 on Likert scale highlighted
Table 11: Average level of disclosure frequency by primary consumer market and channel, scores above 2.6 on Likert scale highlighted
43 44
8
1. Introduction
In 1987, the United Nations defined sustainable development as meeting “the needs of the present without compromising the ability of future generations to meet their own needs” (The World Commission on Environment and Development, United Nations, 1987). In that defining moment, the importance of sustainability came to the forefront as a global issue. Nearly 30 years later, the 17 Sustainable Development Goals of the United Nations 2030 Agenda for Sustainable Development were adopted by 193 countries in a historic UN Summit and officially went into effect on January 1, 2016 (Leibowitz, Croke, & Araujo, 2019). The goals universally apply to all countries, which committed to mobilizing efforts to end all forms of poverty, fight inequalities, and tackle climate change, while ensuring that no one is left behind. Each of the 17 goals set forth specific targets to be achieved by 2030 (Leibowitz et al., 2019). With this call for action and increasing pressures in the form of regulation and stakeholder demands, the need for companies to play a role in sustainability is clear.
This capstone will focus on understanding current and future practices in achieving supply chain sustainability to better support ongoing progress. Supply chain sustainability has increased in importance for companies of all sizes, public and private, creating pressures to reduce social and environmental impacts. To better understand these issues and how companies are adopting supply chain sustainability, a large-scale survey of supply chain professionals was deployed globally in October 2019 through the MIT Center for Transportation and Logistics (CTL) and the Council of Supply Chain Management Professionals’ (CSCMP) networks. The purpose of this survey was to collect data on corporate supply chain sustainability practices, including topics such as goal setting, investment, management tools, reporting, and disclosure practices.
This research does not give guidance on what companies should or should not do but rather provides a broad view on the current adoption of sustainability practices in supply chains to help inform future strategies. To that end, we seek to answer the following research question: What does supply chain sustainability look like in 2019?
1.1 Role of Supply Chains in Sustainability Today
While business sustainability has increasingly come to the forefront as a strategic issue, most of a company’s impact lies in the supply chain. Based on corporate disclosures to CDP
9
(formerly known as the Carbon Disclosure Project), Bové and Swartz (2016) found that supply chains were responsible for 80% of overall greenhouse gas emissions and over 90% of the impact on natural resources.
In the past, many environmental and social issues were treated as independent from one another, but today we understand that climate change heavily interacts with health and poverty. Climate change also threatens biodiversity, endangering supply continuity of crops and putting disadvantaged populations at further risk (Bouchery, Corbett, Fransoo, & Tan, 2017). Georgetown University Medical Center stated that one billion people could be newly exposed to diseases like dengue fever as world temperatures rise (Carlson, Johnson, Mordecai, & Ryan, 2019), particularly impacting supply chains in labor-intensive industries.
There are numerous public health, economic, and political issues that have greatly impacted the supply chain recently at an unprecedented pace, such as the trade dispute between the US and China and the global coronavirus pandemic. As a result of the trade disputes, global supply chains have moved towards a more regionalized paradigm, with sourcing strategies impacted by national and political interests (QIMA, 2020). Companies are trying to navigate this changing landscape and new manufacturing regions are stepping up to seize opportunities; however, this can come at the expense of supply chain sustainability. According to Hong Kong-based quality control company QIMA, companies “consistently prioritized operational concerns over sustainability” in 2019 (Donaldson, 2020). The coronavirus crisis is also shining light on sustainability problems in the global pharmaceutical and medical supply industries. Companies are returning to single-use plastics and many products are in short supply, requiring urgent deliveries with higher carbon emissions levels (Degnarain, 2020).
To provide a perspective on progress and opportunities in supply chain sustainability, the capstone focuses on survey results analysis, executive interviews, content analysis, and literature review on supply chain social and environmental sustainability.
1.2 Supply Chain Sustainability: Pressure Sources
The topic of supply chain sustainability is coming increasingly into focus for companies, frontline professionals, and consumers alike as a result of political and economic factors, and increased access to global information through social media and digital platforms. One source of
10
that growing focus is pressure for companies to adopt more sustainable supply chain practices. Pressure sources include industrial associations, executives, investors, corporate buyers, end-consumers, government, local communities, non-governmental organization campaigns, and media coverage. Some tangible examples are environmental groups shaming companies or encouraging boycotts of companies that make profits from lands cleared by means of fire in the Amazon forest or that have contributed to deforestation because of palm oil planting in Asia (Parr, Dolsak, & Prakash, 2019).
In the early 1990s and 2000s “name and shame” was a common tactic, with non-governmental organizations and journalists pressuring and exposing companies in consumer facing industries with high brand value. This still happens, but emerging brands are trying to build sustainability into their brand ethos, as this topic is now a basic requirement in the minds of consumers (M. Chung, interview, January 31, 2020). Eddie Chan, CEO of Lever Style, an Asia-based apparel manufacturer that works with many well-established and rising direct-to-consumer, e-commerce brands, mentioned that emerging brands today do not have years to build their brand name, and a focus on sustainability is a way to quickly resonate with consumers with minimal promotion (E. Chan, interview, February 11, 2020).
Sustainability has also come into focus through end-consumers demanding transparency of the supply chain, as it affects the technology, food, and electronics industries, among many others. Mineral extraction operations face challenges including potential impacts in their local communities, environmental biodiversity, pollution, and worker welfare during hazardous activities. Sean Cady, VP Sustainability at VF Corporation, said extraction of raw materials represents half of the company’s total carbon emissions (S. Cady, interview, February 10, 2020). Ethical sourcing as a subset of the broader topic of sustainability continues to be a focus for non-governmental organizations. For example, the Alliance for Responsible Mining supports small-scale miners in high-risk countries.
Media coverage is highlighting the negative impacts of overconsumption caused by fast fashion due to abbreviated product lifecycles, creating challenges for post-consumer, end-of-life disposal. The fashion industry emits more carbon than international flights and maritime shipping combined. The fashion industry produces 10% of the world’s carbon emissions, is the second-largest consumer of the world’s water supply and pollutes the oceans with microplastics. It is also
11
estimated that 85% of all textiles go to landfills each year (McFall-Johnsen, 2019), causing both negative upstream and downstream impacts on sustainability within the supply chain.
1.3 Supply Chain Sustainability: Adoption Incentives and Challenges
With increased scrutiny on the impacts of the supply chain, the negative impact of non-sustainable activities is becoming harder to ignore. Stakeholders are creating more pressure, demanding that companies be transparent through disclosure of actual practices and reduction of negative impacts. Financial profit, environmental benefits, brand reputation, technology, and transparency are all driving factors behind the increased corporate focus on sustainability within supply chains.
While financial profit is an incentive to adopt sustainable practices, a key challenge faced today is that practitioners struggle with valuing the return on sustainability investment. Although the business world has several universally accepted tools, nothing comparable exists for evaluating social and environmental rewards in dollar terms; so forecasting gains is often a matter of guesswork (Addy, Chorengel, Collins, & Etzel 2020). Numerous organizations have recognized these shortcomings and have sought to better understand impact measurement and management, because “what gets measured gets managed” (Addy, et al., 2020). This work has produced metrics such as the Social Return on Investment, a performance metric used to identify and quantify the financial impacts of sustainability-related initiatives, like brand reputation or investment in local communities (Then, Schober, Rauscher, & Kehl 2017).
The United Nation’s Sustainable Development Goals call for a united effort to achieve a shared set of targets and indicators. As a result, the Impact Management Project was launched in 2016 to create consensus on how to define, measure, and manage social and environmental impact. The project seeks to bring together the perspectives of all stakeholders to create a toolkit of best practices that can be referenced globally across firms and industries (Addy, et al. 2020).
Environmental benefits are also an important driver behind the adoption of sustainable practices however measurement is not straightforward. Scopes of emission measurement, as defined from the Greenhouse Gas Protocol Corporate Standard, across the supply chain include (Bouchery, et al., 2017):
12
Scope 2: Carbon emissions from the generation of obtained resources, such as electricity purchased and used by a company, with consumption physically taking place at a facility outside the company.
Scope 3: All other indirect carbon emissions which are a consequence of activities of the company but occur from sources not owned or controlled by the company, such as the extraction and production of materials.
Awareness of the scope in which most of the environmental impact occurs is becoming prevalent. It is essential that sustainability measurement takes a supply chain perspective beyond only Scope 1, as these account for a relatively small amount of total supply chain emissions. As Sean Cady, VP Sustainability at VF Corporation, points out, “99% of environmental impact occurs in Scope 3, so supply chain focus is critical for reducing carbon emissions” (S. Cady, interview, 2020). As another example, when Walmart announced its goal of reducing corporate greenhouse gas emissions by 20 million tons per year by 2020, it realized that its supply chain represented about 95% of its overall carbon footprint. As a result, Walmart worked with suppliers to cut down their emissions, which reduced environmental impact and provided cost savings primarily due to lower fuel consumption (Lyons Hardcastle, 2017).
Environmental impact in the supply chain is not limited to greenhouse gas emissions. Water scarcity, issues with land use, toxic waste, deforestation, air quality, and energy use are all important considerations. Some steps firms are starting to address these issues include driving efficient supply and demand planning to reduce overproduction, optimizing routes to reduce fossil fuel consumption, and consolidating shipments to fully utilize containers in transportation (Blue Global, 2019). This is the case with TAL Apparel, as President/CTO Delman Lee explains: “Greenhouse gases, such as electricity and fuels, are noticeable lines in the P&L making it easier to justify investment in practices to reduce consumption” (D. Lee, interview, February 5, 2020).
Brand reputation is an important driver behind the adoption of sustainable practices. Many corporate brands in recent years have invested in their reputations through corporate social responsibility and sustainability. Research suggests that positive reputation is an integral component of brand equity and that reputation building as a business strategy offers several benefits. The benefits include increasing long-term shareholder value, access to new markets, price premiums, corporate brand trust, and facilitating employee recruitment (Cowan, Kirsten, Guzman, & Francisco, 2018).
13
Supplier collaboration and transparency also play a part in firms’ successful implementation of sustainable supply chain practices. We define transparency as knowledge of what is happening upstream in the supply chain and communicating this knowledge internally and externally (Bateman & Bonanni, 2019). Processes and technologies that can help firms build greater transparency in supply chains include supply chain mapping, traceability, third-party certification, and goal setting. For example, food companies are seeing more requests for supply chain-related data about ingredients, food fraud, animal welfare, and child labor (Bateman & Bonanni, 2019). Companies and stakeholders are increasingly interested in knowing what materials are used to make products, where they are produced, and whether the supply chain can withstand disruptions, among other concerns. When there is a lack of transparency in the supply chain, a company may not be able to fully understand its risks or fully advance its sustainability efforts (Kashmanian, 2017).
Digitization of sourcing processes, new business models, and increased adoption of technological innovation such as virtual sampling in the fashion industry are examples of how process efficiencies are influencing sustainability and reducing waste. Unilever uses software to collect data on whether farmers in its supply chain are using sustainable practices (Bové & Swartz,
2016). Patagonia partnered with a company called Trove, which creates and operates reuse
e-commerce platforms, to launch its re-e-commerce site in 2013 (Makower, 2018). Re-e-commerce, or “resale commerce”, is the process of selling used products or excess inventory to companies or consumers (Kaplan, 2019).
Interest in sustainability efforts has also been driven by consumers who are empowered by easy and frequent access to information on the internet and social media. Consumer interest in transparency and traceability across the supply chain is growing. Younger consumers are eager for companies to share more about the origin of their products and provide more transparency on sustainability-related marketing claims, as they express concern for workers’ rights, environmental issues, and seek to influence companies’ actions through their buying power.
Challenges in understanding the state of adoption of sustainability practices include the scale, scope, opacity, complexity, and the changing nature of supply chains. There is no common language to define sustainability, and it is still difficult for industry practitioners to talk about sustainability with a shared vocabulary to forge a mutual understanding. The complexity and broadness of the topic of sustainability also makes it challenging for sustainability-related
14
functions within firms to speak the language of profit and tie their efforts directly to a firm’s financial success. Even when an employee can provide tangible financial benefits for a sustainability-related initiative, such projects are often not a company’s core business and stakeholders prefer to invest back into their core business to drive topline growth (Aronson 2017).
This research seeks to improve knowledge to better understand the ways companies are adopting sustainable supply chain practices today.
1.4 Research Gap
We identified that existing research does not define the actual state of supply chain sustainability today across industries, geographies, and functional roles within a defined time period. Instead, most reports and articles tend to target specific industries, such as energy, fashion, agriculture, transportation, and logistics, or their specific impacts, like greenhouse gas emissions, ethical sourcing, deforestation, or social compliance issues. We have also identified that the majority of supply chain sustainability-related research focuses on perceptions of company executives and shareholders. Examples include:
EY’s 2016 report The state of sustainable supply chains: Building responsible and resilient supply chains mentions employees as a stakeholder in sustainability efforts, however there is no indication of perspectives being provided specifically from frontline supply chain professionals;
CDP’s 2017 report Missing link: Harnessing the power of purchasing for a sustainable future provides perspectives primarily from those in top management positions, though most are in sustainability-related roles; and
McKinsey’s 2019 report Fashion’s new must-have: Sustainable sourcing at scale reflects the perspectives of 64 sourcing executives.
We address the underrepresentation of perspectives from frontline supply chain professionals on supply chain sustainability practices through this capstone. We sought to provide a glimpse into frontline employees’ perceived state of adoption of sustainability practices across geographies, industries, functional roles, and demographic characteristics. The level of visibility and importance of supply chain sustainability efforts have increased in recent times, making the topic a key area of interest for many companies in 2019 and beyond.
15
Supply chain sustainability is inconsistently defined across different types of (and even within the same) companies, industries, and geographies. This issue becomes more complex when coupled with varying regulatory requirements as well as individual firms’ willingness, technological, and financial ability to adopt. There is also a lack of industry-wide standardized benchmarks to objectively measure progress and little transparency as to what sustainability efforts other companies are undertaking as well as what progress has been made to date.
The Global Reporting Initiative (GRI, 2016) and the United Nation’s 2030 Agenda for Sustainable Development (UN Sustainable Development Goals, 2020) demonstrate the importance of sustainability efforts, but the path to get there is not always clear. Different indexes have been designed to measure sustainability, however, despite these indexes tending to consider the same criteria, the weight given to each component varies according to the party responsible for measuring. As a result, not having globally accepted definitions of how to measure sustainability makes comparison of values almost meaningless.
To that end, we offer generalizable learnings about what constitutes supply chain sustainability from a global perspective, and highlight what that means for the future. This is the first time this study has been conducted from MIT CTL and learnings from this capstone will inform future iterations of the work.
1.5 Research Process Summary
To achieve the objectives stated in Section 1, analysis was performed by substantiating existing knowledge in literature with new evidence from a rich set of survey data, content and archival analysis, and perspectives from interviews with supply chain executives. Data collection included a large-scale survey of professionals (distributed initially to supply chain professionals but also shared on a wider network) that was deployed globally in October 2019. Its objective was to collect data on corporate supply chain sustainability practices, ranging from awareness of the topic, goal setting, investment, management tools, sources of pressure, and reporting.
The methodology to conduct this research included: Logistic and linear regression
16
Aggregation and correlation matrix to identify sustainability practices across types of companies, industries, and regions.
Content analysis of secondary materials to provide further context on findings of the survey.
Use of Tableau to exhibit the findings in a clear and visually engaging way so that professionals across backgrounds can clearly understand the findings.
The capstone results are part of a major research project developed by MIT CTL together with CSCMP to deliver the first State of Supply Chain Sustainability report in 2020. Given the outsized impact of the coronavirus pandemic in 2020, we reveal findings from the survey dataset with an added focus on what the events of 2019-2020 mean for supply chain sustainability in coming years.
2. Literature Review
The literature reviewed for this capstone project included news articles on current events, articles from scientific journals covering topics ranging from corporate codes of conduct to sustainable manufacturing, corporate social responsibility reports, publications on the history of sustainability, case studies, industry reports, and books on topics such as business sustainability and international political economics of production. Through the literature review, we sought to understand the historical evolution of sustainability, how and why supply chains came to be understood as linked to sustainability, the framework of regulatory requirements that have influenced sustainability, what current events are influencing supply chain sustainability practices in 2019, and what emerging trends will shape supply chain sustainability for years to come.
We have performed content analysis of existing literature to understand the historical context and evolution of supply chain sustainability while aiming to answer the question: what does supply chain sustainability look like in 2019? We will clarify how expert efforts on defining this matter impacted existing knowledge, and how we observed current practices to evaluate the awareness in sustainability applied to supply chain processes across industries and geographies.
17
2.1 Sustainability Concept and Knowledge Evolution
The term “sustainability” was originally coined in German as “Nachhaltigkeit” which means “sustained yield”. The term first appeared in a handbook of forestry published in 1713 and meant to never harvest more than the forest can regenerate. Once ecology became a discipline, the concept of sustainability was defined as the ability of an ecosystem to maintain its biodiversity over time. In the later part of the 20th century, awareness of overuse of resources and dependence on fossil fuels was growing (Rack, 2014).
References to sustainability were observed in literature in 1969 as part of the creation of the National Environmental Policy Act law, which was signed in 1970 (National Environmental Policy Act, 1969) and reinforced later in 1972 in the Stockholm Declaration during the United Nations Conference on the Human Environment. In these early cases, sustainability refers to the capability of achieving profit while focusing on preserving the environment. The U.S. Environmental Protection Agency implemented numerous standards and regulations related to conservation and environmental sustainability in the 1970s, and the first Earth Day was celebrated by 20 million Americans. After the Stockholm Declaration, awareness, community activism and, therefore the global demand for focus on environmental protection, increased (Handl, 2012).
By 1987, the concept evolved, and the United Nations defined sustainable development as meeting “the needs of the present without compromising the ability of future generations to meet their own needs” (The World Commission on Environment and Development, United Nations, 1987). In 1992, the Rio Declaration on Environment and Development reaffirmed the Stockholm declaration goals and added a regulatory framework to reinforce environmental practices with development of global standards (Handl, 2012). The main outcome of the conference held in Rio was a call for global partnership to identify the integration of environment and development concerns, as leading factors for the fulfillment of basic needs, improved living standards, and better protected ecosystems. In 1993, the Commission on Sustainable Development was created as a forum tasked with following up on the progress of outcomes of the 1992 United Nations Conference on Environment and Development/Earth Summit. This commission has advanced the sustainable development agenda within the international community (UN Sustainable Development Goals, 2020).
18
“Although environmental issues started before the 1990s, major streams of sustainable research specific to the supply chain management discipline started in the mid-1990s” (Baah & Jin, 2019). The acceptance of social and other issues related to the environment evolved from what was referred to as “standalone” by Craig and Easton (2011), to the concept we currently refer to as sustainability. The concept of sustainability then started to cover a wider range of impacts, including what was called the three pillars of sustainability in the “triple bottom line theory.” The triple bottom line theory is an accounting framework created by John Elkington in the mid-1990s to measure sustainability and went beyond the traditional financial measures of profits to include environmental and social dimensions (Slaper & Hall, 2011). Elkington designed a model including these topics to guide any company strategy pursuing sustainable results: 1) Economic, 2) Environmental, and 3) Social (Elkington, 1994). These three pillars are also informally referred to as profit, planet, and people.
The first pillar, commonly known as the “bottom line,” is economic sustainability and it refers directly to profitability. It means that no organization can last if it is not able to generate the appropriate income related to its expenses and investors’ expectations. Risk management and compliance activities are also included as part of this pillar. The second pillar of sustainability, environmental, relates to consumption of natural resources, waste generation and disposal, carbon footprint, and deforestation, among other areas. The third pillar, social sustainability, refers to obtaining a license-to-operate, avoiding slave labor, child labor, and conflict minerals, and propitiating fair trade. Overall, this pillar is about considering the organization as a member of the community and the importance of community support for the organization to be sustainable. The triple bottom line theory altered the understanding of the actual value of a company or brand, and led to the need for defining global measurement and reporting rules.
Sustainability standards have grown rapidly in number and importance in global commodity markets over the past decade. The growth of voluntary sustainability standards has occurred in parallel with growing recognition of the importance of economic drivers in implementing sustainable development. These factors are creating new opportunities for stakeholder participation in supply chain decision making. Furthermore, poor sustainability performance, as measured in social and environmental impact, can slow a company’s growth (United Nations Conference on Trade and Development, 2019). To make and sell goods,
19
companies need affordable, reliable supplies of energy and natural resources, as well as permission from investors, consumers, and regulators to conduct business.
For a company to thrive, it must have the ability to effectively evaluate its own sustainability performance. The Dow Jones Sustainability index for investors, a collection of indexes acting as the first global sustainability benchmarks, was launched in 1999 and provides a clear example of the impact the broad concept of sustainability has achieved. Despite this progress, there is ongoing evolution of these indexes, as bias is claimed by analysts because neither the global stakeholders nor the specific industries or markets agree on what weight each pillar should have in the existing indexes (Escrig, Muñoz, & Fernandez, 2010).
Furthermore, each country’s national law requires and reinforces sustainable practices according to their resource availability and main social or economic weaknesses. Sustainability is in demand by the global community in 2019, however global standards and policies mainly require voluntary adoption.
2.2 Application of Supply Chain Sustainability
Supply chain sustainability is increasingly recognized as a key component of corporate responsibility involving many complex and interrelated facets. Linton, Klassen, and Jayaraman (2007) drew attention to the joint terms “supply chain” and “sustainability”. They reinforced that to optimize the supply chain in any industry, the entire sequence of steps should be analyzed in terms of sustainability because of trade-off between the economic impact and the achievement of sustainability goals. In 2010, the UN Global compact defined the term “supply chain sustainability” as “the management of environmental, social, and economic impacts, and the encouragement of good governance practices, throughout the lifecycles of goods and services.” (United Nations Global Compact & BSR, 2010)
By 2019, rising issues such as global warming, energy crisis, and ozone layer depletion, among others, have brought attention to the topic of sustainability in all facets of human existence. Likewise, social sustainability practices, such as fair trade and worker welfare, are of increasing interest to consumers as they seek to know the origins of the products they purchase. As a result of these trends, there has been increased interest in sustainability as part of strategic supply chain decisions.
20
Companies that look to become more sustainable often start with their own operations, but soon realize that many of their impacts are in their supply chains rather than in-house (Bové & Swartz, 2016). CDP reveals that companies pressuring their suppliers to make changes to be more sustainable can have a significant impact. When CDP’s Supply Chain Disclosure started 10 years ago, only 14 companies participated. In 2018, 115 of the world’s largest organizations, with a combined purchasing power of over $3.3 trillion, requested environmental information from more than 5,500 suppliers (Scott, 2019).
Although the aim to create a cascade of sustainable practices that flows throughout the supply chain is admirable, it is difficult to realize in practice. Apple, Dell, and HP faced scrutiny for sourcing from companies that required employees to work in hazardous conditions (Villena & Gioia, 2020) and in 2013, the Rana Plaza disaster in Bangladesh killed 1,130 people and injured many others when a building housing several factories producing clothing for US-based brands collapsed (White, 2017). While the topic of supply chain sustainability has evolved significantly over time, the aforementioned tragedies are a stark reminder that there is still much progress to be made.
3. Methodology
This section describes the methodology used for the state of supply chain sustainability research. The methodology followed this chronological order: survey design and distribution, survey data collection, literature review, executive interviews, quantitative analysis including data cleaning, data triaging, and visualization analysis, and discussions on key takeaways.
As a primary research method, a survey was commissioned by MIT CTL in partnership with CSCMP. The main goal of the survey was to understand the state of supply chain sustainability in 2019 with a focus on the perception of frontline employees. Because the survey could reach all networks of supply chain professionals, it included a question to identify the respondent’s functional role to allow filtering if required when performing analysis. The overall content in the survey questions drew from different major sources: a) significant knowledge in this topic area from within MIT CTL; b) academic research from the past and current ongoing work in this area; c) existing standards and industry reports, including related reports with a different angle
21
(based on C-suite executive interviews or focused on specific industries); d) anticipated future trends.
To ensure that potential respondents could understand the survey content, the survey was vetted by experts in the area including CTL researchers, CTL graduate students, the CSCMP Sustainability Committee, the CSCMP board, industry professionals, and external academic professionals. This study also received approval from the MIT Committee on the Use of Humans as Experimental Subjects (COUHES) to involve human subjects. Before going online, the survey was piloted successfully with over 60 supply chain professionals to gauge understanding of the questions’ main concepts and the respondents’ ability to complete it.
As the understanding of the topic of sustainability within the context of supply chain may differ among survey respondents, the following clarification was included at the beginning of the survey:
In this survey, supply chain sustainability refers to the management of environmental and social impacts within and across companies in networks consisting of suppliers, manufacturers, distributors, and customers.
The survey was designed to gather data covering 7 major aspects: 1) Categories and Level of Commitment in Sustainability 2) Categories and Level of Investment in Sustainability 3) Disclosure Frequency and Media
4) Type and Effort Level on Applied Practices in Sustainability 5) Source and Level of Pressure for Sustainability
6) Type of Company
7) Respondent Main Characteristics
The initial survey questions gathered information on existence of specific firm practices by respondent, such as existence of publicly stated sustainability goals or whether the firm has invested in increasing supply chain sustainability. Once the surveyed professionals stated their firm’s involvement or lack thereof in these areas, the objective of succeeding questions was to understand the main focus areas within the topic by category (for example, carbon emissions
22
reduction or supplier diversity and inclusion), level of adoption of current practices, level of investment, main sources of pressure, disclosure practices, and disclosure frequency.
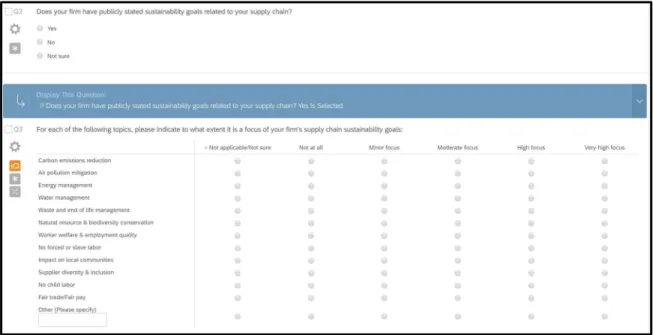
The survey was designed and conducted online through Qualtrics web-based platform. Survey routing (also known as Skip Logic) was used to modify the respondent’s path through the survey depending on the answers they provided to previously defined questions. For this capstone, the questions that modify the path are named as “root questions” and those that follow a “yes” answer to a root question are named as “branch questions”. An example of this is shown in Figure 1. Likert Scale was used in most of the branch questions with the understanding that the perceived attitudes could be measured from 0 to 5 for further numerical analysis once the data was available and ready to be used.
Figure 1: Root and branch question design with binary and Likert scale answer types
From the literature review, we identified that answers might be correlated to specific characteristics of the participants and the companies at which they were employed. Therefore, questions related to the respondents’ demographic and professional attributes such as geographic location, gender, age, and functional role as well as the size, type, industry, headquarters’ location, and primary consumer markets were included. The survey was anonymous to avoid potential bias that could result if the surveyed audience was concerned about exposing their firm’s actual practices.
23
The survey included count of clicks tracking and measured the amount of time spent on each page of the survey by respondent. The objective of recording amount of time spent was to identify whether the respondent spent time possibly reading long texts carefully or assessing possible answers in questions where many options were available. As there is a minimum number of clicks required to complete the survey, additional clicks may imply a respondent’s change of choices while going through the questions.
The survey was open for responses for 40 days, from October 7, 2019, to November 15, 2019. The survey was primarily distributed through CSCMP to their associates as well as CTL’s database of contacts, and was shared through other industry associations’ e-mail groups. It was also promoted in social media (mainly through LinkedIn) and was shared through the survey respondents' network. Global coverage of frontline supply chain professionals was the goal of selecting this wide audience, and the questions would provide the option to aggregate results and narrow down the scope if deeper analysis was required on a smaller subset of answers.
3.1 News and Industry Journals
Existing literature reveals the concept of sustainability was initially focused on environmental concerns (Handl, 2012), but more recently focus has extended to include a comprehensive perspective based on three pillars 1) Economic, 2) Environmental, and 3) Social (Elkington, 1994). The survey was not designed to cover the economic side of sustainability, as explained in Section 3.3, and this pillar was analyzed by means of secondary research.
The secondary research method provided a clearer understanding on the evolution of sustainability applied to supply chain, and was utilized to challenge or reinforce the survey results. The main sources of data for this step were internet-based including news, business, industry, and sustainability-focused journals, as well as MIT libraries.
3.2 Executive Interviews
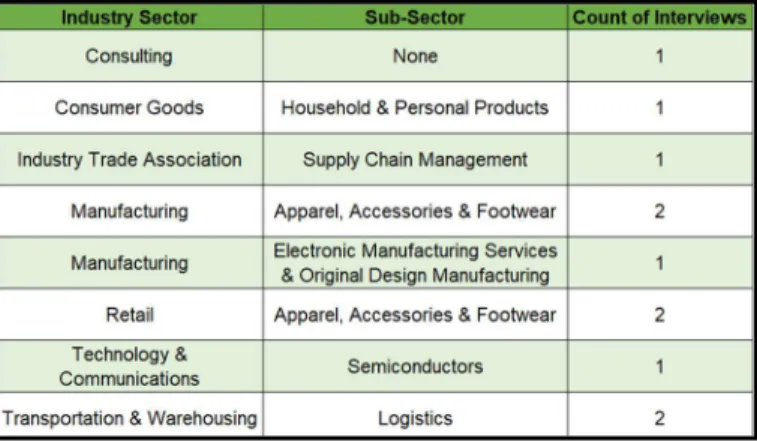
We arranged executive interviews to support and increase the ethos, defined as the credibility and sense of accuracy, of the collected data for the reader. We conducted 12 interviews with supply chain industry executives based in the US, Europe, and Asia, ranging from upstream
24
(for example, manufacturing) to downstream (for example, retail) during the data analysis phase. Table 1 shows the number of interviews conducted by industry sector.
Table 1: Number of executive interviews by industry sector
A semi-structured, open-ended interview guide was prepared and focused on topics including perspectives on supply chain sustainability, level of pressure received to adopt sustainable practices, the role of supply chain professionals, and pressure agents, among others. The main objectives of the interviews were to understand key challenges, if and how sustainable practices are implemented within their own companies, and to gain knowledge on practices that could impact employees’ perceptions within their companies. Qualitative findings from executive interviews were used to provide anecdotical insights that can be found in Section 5 and the interview guide can be found in the Appendix B.
Information gathered from the executive interviews bridged the gap between the lofty ambitions from executives pertaining to sustainability goals that are prevalent in the news, and the sometimes-contradictory perspectives from frontline employees.
3.3 Limitations
a) Economic Pillar of Sustainability
The survey focuses on the social and environment sustainability aspects of supply chains because these areas are more often overlooked by businesses, and therefore are interesting for tracking changes over time. The economic pillar of sustainability was intentionally not part of the survey. A deep economic analysis would require data that is private to each company and therefore
25
it is less feasible to collect information that guarantees global representativeness through an anonymous survey. The absence of survey questions with economic-related content also aimed to protect data privacy of respondents. The survey includes a broad view of sustainability-related questions across geographies and industries, and when designing the survey, we sought to protect the anonymity of respondents, so these factors limited the specificity of responses. However, the firm size, respondent perception of level of investment in environmental and social aspects of sustainability, and whether the firm is publicly or privately held is information that was included in the survey and statistical relationships of these attributes were analyzed.
b) Respondents’ duplicated records
Another limitation is that the surveyed audience is anonymous, so we cannot identify if more than one person from the same company participated in the survey, providing similar or different responses. We addressed this problem by removing identifiable duplications in responses.
c) Representativeness of the responses
Questions with fewer than ten answers for a specific industry, headquarters, primary consumer market, geographic location, gender, age range, or position were dismissed for individual analysis as they did not provide enough information for analysis. These responses are considered for aggregated analysis in cases where the objective is not related to the place, person, or industry, but with overall existing practices, goals, investment, pressure received from stakeholders, or disclosure practices.
3.4 Data Cleansing, Preparation, and Modeling
Before proceeding with analyzing the data, it was necessary to confirm that answers were complete and accurate, that typos were not affecting the results potentially causing duplicate or inaccurate data categorization, and that there were not unwanted observations to erase from the sample. The data was then cleaned in order to guarantee accuracy and consistency, and prepared before moving forward with the analysis process.
26
Data cleansing initially focused on locating answers that respondents identified as required but were not listed as possible options to each question, instead they were entered as free form text responses under an “Other” category. The next step was defining whether the exceptions fit existing categories or should be incorporated into a new group that appears relevant for the audience and was not originally considered by the data collection tool.
An example of this was the cleaning of answers in category “Other” from the question regarding focus and level of focus in sustainability (Q3 from the survey can be found in Appendix A). We identified “N/A” comments that were translated into blank answers (as no actual “Other” focus described) and reallocated responses that could be included in existing categories, like “Performance Metrics CO2 reduction for customers” was translated into the existing “Carbon emissions reduction” category. At the end of this process, only three answers remained in “Others” for this question, and considering the low representativeness of these answers, they were left unidentified as “Others” for the analysis phase. The same process was performed with the following survey questions: Q5, Q6, Q9, and Q10. In those cases, where a new proposed category received over 10 answers, the new category was included as an original response, replacing “Others” for the analysis.
3.4.2 Data Preparation
Considering that the primary source of information for this research provided qualitative information related to categorical variables, the collected data was analyzed initially individually and then grouped, applying descriptive statistics, and logistic and linear regression once the categorical responses were turned into numerical data.
The procedure to turn categorical answers into numerical data for the analysis purposes was different depending on the collected information and the expected correlations from each type of question:
A) “Yes” / “No” / “Not Sure” answers: questions that could be answered only with one of these options were turned into binary responses by replacing “Yes” with 1 and “No” or “Not sure” with 0.
B) “Not at all” to “Very High” level answers: questions that could be answered to state a level of pressure, agreement, investment, commitment, or frequency were turned into numerical variables in ranks from 0 to 5 by means of Likert Scale usage. In all cases, a 0 represents the lowest
27
level or no level according to the question design, while a 5 represents the highest corresponding level.
C) Respondents’ age or company size (measured in range of number of employees): Numerical answers providing ranges were turned into the average of each range. As an example, respondents’ answers in a range of age between 35 and 44 years old, were turned into a numerical variable by using the average of 39.5 for the regression analysis.
D) Categorical answers: questions to be answered with a continent, country, state, department, or gender that could not be treated as mentioned in the previous A to C statements, were redesigned into a one-column answer per given alternative. Respondents’ choices were turned into binary by using 1 in case they selected that option or 0 if they did not.
A data dictionary was created and included in the master file. Its purpose is to guarantee the ability to translate the original database into the final analysis database, providing a tool to researchers in the field working on future State of Supply Chain Sustainability reports. An example of the information stored in the dictionary is detailed in Table 2.
28
Missing data was analyzed according to its origin. If the reason for missing data in a branch question’s answer was related with the corresponding root question answer, the missing answer was considered as “skipped”, so it was null for linear regression, but considered in the logistic regression of the root question data. If the reason was related to the respondent dropping the survey, the empty entry is considered as null data and this fact is only analyzed with the objective of understanding what could lead to that fact. For all purposes, empty data are not considered as “No” answers and then are not turned into 0 for the regression analysis.
Data aggregation was performed in all cases in which the number of answers did not impact the result of the data analysis. In cases where the number of answers could impact the accuracy of results interpretation, data was normalized by using an average. An example of this is the analysis on level of focus in each sustainability goal commitment grouped by the respondent’s industry, as Manufacturing and Transportation and Warehousing industries represent 46% of total responses.
3.4.3 Modeling Data for Logistic and Linear Regression
Given that the survey design used skip logic (see Section 3 and Appendix A), answering “No” to certain root questions led to skipping the branch questions on the same subject. The goal was to not bias the regression analysis by considering unanswered questions with correctly answered questions, as per the survey routing design. The regression from any dependent variable compared to those responses as independent variables was split into a two-step process: 1) utilizing logistic regression to define the correlation of any variable with the “Yes” or “No” answer to the root question, 2) utilizing linear regression to analyze correlations considering only those responses to the branch questions that were obtained after a “Yes” answer to the root question. Dependent variables analyzed by this method were defined according to the main sections of the survey, as detailed in Section 3.
4. Results
29
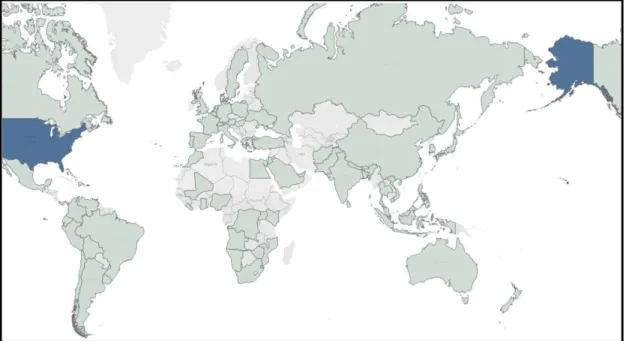
As exhibited in the heat map with the dark blue color indicating a higher number of responses (Figure 2), respondents with company headquarters in 71 different countries participated in the survey. The United States of America had the highest number of respondents at 44% with most responses from California, New York, and Illinois. The countries with the second- and third-highest number of responses were Malaysia and India, respectively.
Figure 2: Heat map showing respondents’ company headquarters’ location
Firms from over 19 industries including Manufacturing, Transportation and Warehousing, and Retail participated in the survey. Figure 3 below summarizes the top 10 industries by number of responses.
30
Answers received from Government or NGOs, Chemicals, Marketing and Social Media, 3PL, and Trading and Finance industries had less than 10 responses, so they are not considered as representative of the industry. However, they were included for aggregated analysis.
Firms of various sizes, categorized and measured by number of employees, were represented in the survey. This can be observed in both extremes with 17% of the respondents coming from companies with over 50,000 employees and 11% between 0 and 19 employees. The size of the firm was analyzed to understand the correlation with level of pressure received from diverse stakeholders, as well as company level of investment in increasing supply chain sustainability.
Figure 4: Number of respondents grouped by companies’ number of employees
In our analysis we considered the relationship between a company being publicly traded or privately held and its goals, commitments, and main sources of pressure to adopt sustainable practices. The survey shows that 65% of the respondents were from privately-held companies and 35% of respondents were from publicly-traded companies.
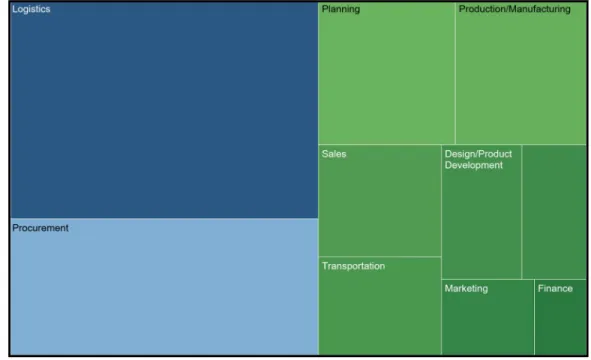
One of the major gaps this research is aiming to explain is frontline supply chain employees’ perception of the state of adoption of sustainability practices across geographies, industries, and functional roles. Figure 5 illustrates that they are properly represented by the population sample. We observe that the highest number of responses came from people working in procurement and logistics, which represent major areas in the supply chain management field, and that only 5% of answers are from top management professionals.
31
Figure 5: Number of respondents grouped by functional department or position
As shown in Figure 6, over 58% of the surveyed population is between 25 and 44 years old and our sample population consists of 75% male respondents and 25% female respondents. Age range was expected to have a correlation with the level of engagement in a firm’s sustainability efforts. Based on content analysis, it was hypothesized that the younger population may be more socially aware of sustainability practices because they have grown up with social
media. The results of the correlations of these variables are detailed in subsection 4.2 Results.
32
Survey results show that 78% of respondents are directly or indirectly engaged with their firm’s sustainability efforts in the supply chain. Details on these results are displayed in Figure 7.
Figure 7: Respondent level of engagement with company supply chain sustainability efforts
4.2 Survey Results
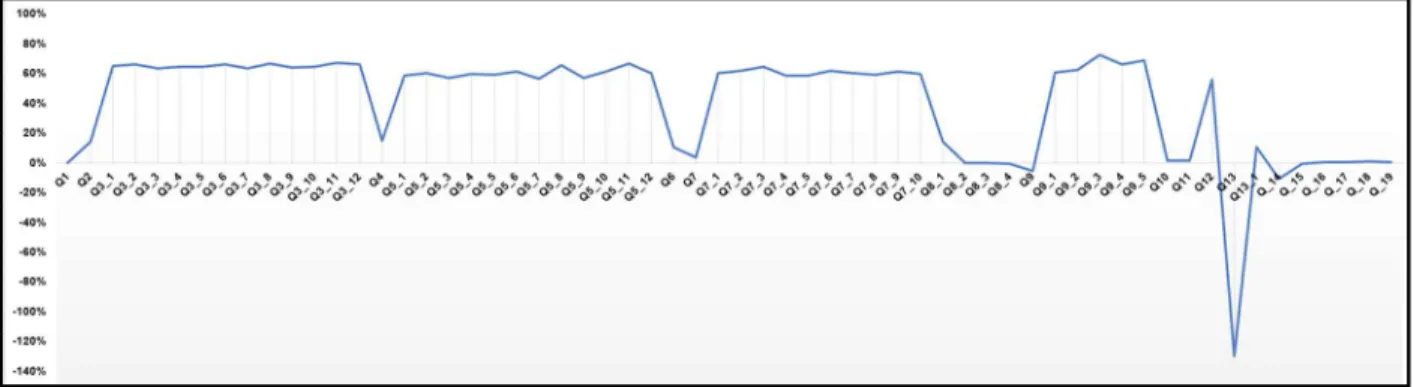
The survey highlighted differences in companies’ goals and investment level in supply chain sustainability, current practices, level of pressure received, disclosure frequency, level of effort, and commitment from frontline employees (see Appendix A). The survey completion rate was 54%, calculated as the ratio of the number of completed surveys (through Question 19) compared to the number of respondents who started the survey (answered “Yes” to Question 1). Some respondents dropped out when information regarding sustainability practices, pressure, and investment was requested in detail. We evaluated the total number of responses versus the percentage of respondents who skipped or dropped out at certain questions to see if there was any point in the survey at which the question skip rate was particularly high. The objective was to identify the motivations of respondents in proceeding with the survey, skipping, or dropping out at certain points. As shown in Figure 8, the points at which respondents either dropped out or skipped questions were highest at branch questions. For example, the skip rate was lower for a general root question like “Has your firm invested (financially or with human resources) in increasing the sustainability of your supply chain?” but increased for more specific branch questions where details such as “Please indicate the extent of your firm's investment in the
33
following: carbon emissions reduction” were requested. A negative skip rate in Figure 8 indicates that respondents returned to the survey after skipping the previous question. Survey results show that approximately 60% of respondents skipped the branch questions when asked to identify category-level sustainability goal commitments and investment. We also found that 66% of respondents skipped questions when asked about investment level in “no forced or slave labor” and “no child labor” categories, which was higher than other categories. Appendix A shows the content of each question by question number.
Figure 8: Respondent question skip rate
We used the results to suggest opportunities to revise the order of survey questions to increase the completion rate and gain demographic information on respondents who drop out of the survey for future iterations. Suggestions for future surveys are detailed in Section 6.3.
From the data analysis shown below in Figures 9 and 10, with 4.0 as the highest level, we observed that the focus on sustainability is perceived to be mostly in social sustainability, with a strong emphasis on no child or slave labor and worker welfare. However, investment in these areas is not directly aligned with the goal commitment focus areas.Later analysis was separated between social and environmental pillars to support the idea of categorizing unique sustainability indicators as well as more easily compare the diverse applications of sustainability from survey results. One drawback of this approach is that it can reinforce the idea that the different pillars of sustainability (as defined in Subsection 2.1) have meanings that are independent from one another. One study indicates that it is necessary to understand how the different pillars interact in order to characterize and assess sustainability (Boyer, Peterson, Arora, & Caldwell, 2016).
34
Figure 9: Focus areas for company sustainability goals and commitments
Figure 10: Focus areas for company sustainability investment
Respondents’ perceptions indicate that companies have stronger commitment to social sustainability, and therefore are investing more in this area. By splitting the analysis into social and environmental sustainability, as seen in Figures 11 and 12, it is observed that “No child labor” and “Energy management” are the top focus areas in each category.
35
Figure 12: Average level of company commitment to environmental sustainability goals by category
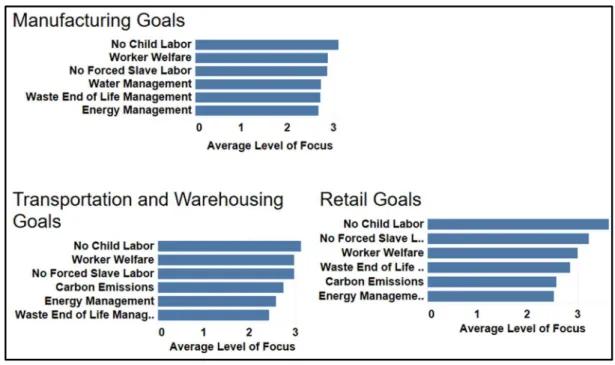
When analyzing companies’ level of commitment to sustainability goals by industry, it is observed in the three industries with the highest number of respondents from the survey (manufacturing, retail, and transportation and warehousing) that:
The main commitment to social over environmental sustainability prevails.
The top 3 social goals in these industries are the same: no child labor, no forced labor, and worker welfare.
The top environmental goal exhibited by each industry (water management, waste and end of life management, and carbon emissions) may be related to related industry practices, as seen in Figure 13.
36
Table 3 shows a correlation matrix between social and environmental sustainability goal commitments, where the green color indicates a higher correlation and the yellow and red colors indicate a lower correlation. Table 3 demonstrates that there is a high correlation between goal commitment categories within the social and environmental sustainability pillars, however the correlation is lower when the goal commitment categories fall under separate sustainability pillars. For example, if a company has goal commitments in carbon emission reduction, this is strongly correlated with having goal commitments in air pollution mitigation but not as strongly correlated with social sustainability goal commitments, such as no forced or slave labor.
Table 3: Correlation matrix demonstrating relationship between social and environmental sustainability goal commitment
Table 4 shows a correlation matrix between sustainability commitments and levels of investment, where the green color indicates a higher correlation and the yellow color indicates a lower correlation. Table 4 demonstrates that company sustainability goal commitments and investment levels are not perfectly correlated, however category-level goal commitments and investment levels are mostly aligned. For example, having a carbon emissions-reduction goal commitment is most highly correlated with investment in carbon emissions reduction. There are also certain categories, such as investment in impact on local communities, that are correlated with relatively higher goal commitments in other areas that are as well related to community impact. These areas include air pollution mitigation, energy management, waste and end of life management, natural resource and biodiversity conservation, worker welfare and employment quality, and supplier diversity and inclusion. Investment in social categories has a higher
37
correlation with investment in other related social and environmental categories, while investment in environmental categories tends to be most highly correlated with investment in other environmental categories.
Table 4: Correlation matrix demonstrating relationship between sustainability goal commitment and investment level
Over 45% of survey respondents mentioned receiving some level of pressure to increase their firms’ supply chain sustainability. The average level of pressure received by all stakeholders was between 1.3 and 2.8 points on a Likert Scale, ranging from 0 (no pressure), 1 (a little pressure), 2 (some pressure), 3 (moderate pressure), and 4 (intense pressure). Overall, the party applying the most pressure to increase supply chain sustainability was company executives, but the average level of pressure received from any source ranged from “a little pressure” to between “some pressure” and “moderate pressure.” An analysis of the level of pressure by industry found that mining, quarrying, and oil and gas extraction; agriculture, forestry, fishing and hunting, and construction industries received the most pressure.
The level of pressure received from different sources also varies by companies’ primary consumer market locations. While companies with consumer markets in Latin American and Caribbean regions show a higher level of pressure received from government and local communities, companies with North American consumer markets exhibit higher pressure received from executives and corporate buyers. At the same time, companies with European consumer markets receive the highest level of pressure from end consumers. Overall, companies with primary consumer markets in Asia and Africa receive the highest level of pressure to increase supply chain sustainability from all sources. Further detail can be observed in Table 5.
38
Table 5: Average level of pressure to increase supply chain sustainability by source and primary consumer market location
Supply chain sustainability practices are tools companies adopt to measure and improve performance. Survey results indicate that 53% of companies have practices in place to manage supply chain sustainability. Practices were defined as follows: 1) External standards defined by an entity outside of the company; 2) Internal standards defined internally by a company for its supply chain; and 3) Internal interventions defined as those that apply to a company’s supply chain but do not have defined production standards (Thorlakson, de Zegher, & Lambin, 2018). The data shows that having a code of conduct, an internal standard, is the most prevalent supply chain sustainability practice across industries, with 74% of respondents having a code of conduct in place (detailed in Table 6).
Supplier audits, an internal standard, were the second-most prevalent supply chain sustainability practice across industries, with 53% of respondents having supplier audits in place. The second-most prevalent supply chain sustainability practices contained many more practices that were categorized as external and internal intervention standards. Table 6 shows the grouping of supply chain sustainability practice categories represented in the survey.