Bioreactor Fill Process Control Using Inline Concentration Measurement by
Matthew P. Dumouchel
B.S., Chemical Engineering Cornell University, 2008
Submitted to the MIT Sloan School of Management and the Department of Chemical Engineering in Partial Fulfillment of the Requirements for the Degrees
of
Master of Business Administration and
Master of Science in Chemical Engineering
in conjunction with the Leaders for Global Operations Program at the
Massachusetts Institute of Technology June 2014
C 2014 Matthew P. Dumouchel. All Rights Reserved.
ARCHS
The author hereby grants to MIT permission to reproduce and to distribute publicly paper and electronic copies of this thesis document in whole or in part in any medium now
known or hereafter created.
Signature of Author ...
Signature
...
MIT Sloan School of Management Department of Chemical Engineering
<: -May 9, 2014
<Signature
redacted
C ertified by... ...
Donald Rosenfield Senior Lecturer, MIT Sloan School of Management Director, Leaders for Global Operations Program
I Thesis Supervisor
Signature
redacted-C ertified by ... ...
Bernhardt Trout Professor, Chemical Engineering
Sig
nature redacted
Thesis Supervisor A ccepted by... ...Maura Herson Director, MBA Program -- 4IT Sloan Spool of Management Accepted by...Signature redacted
Patrick Doyle Chairman, Committee for Graduate Students Department of Chemical Engineering
MASSACHUSETTS INTITE. OF TECHNOLOGY
JUN
18
201
LIBRARIES
Bioreactor Fill Process Control Using Inline Concentration Measurement By
Matthew P. Dumouchel
Submitted to the MIT Sloan School of Management and the Department of Chemical Engineering on May 9, 2014 in Partial Fulfillment of the
Requirements for the Degrees of Master of Business Administration
and
Master of Science in Chemical Engineering
ABSTRACT
Some biopharmaceutical companies have responded to evolution of the competitive landscape by placing additional emphasis on reducing their costs of manufacturing as a means of maintaining competitiveness. The prototypical current generation biopharmaceutical drug substance manufacturing facility requires a
large upfront capital investment. Improving efficiency of use of existing facilities, such as by improving production throughput through the adoption of technology, represents one way in which a company may reduce its costs of manufacturing and/or avoid or delay investments in additional capacity needed to meet future demand.
Reducing the variability in the performance of a liquid filling operation taking place during the protein production step is desirable, because it: (1) enables process optimization, including potential throughput expansion, (2) demonstrates control over the process, and (3) improves step yield reproducibility. The technical and economic bases for the implementation of an alternative process control strategy intended to reduce this variability are presented. This strategy involves controlling the fill operation using an inline concentration measurement of the parameter of interest. An engineering-probabilistic approach,
consisting of a transient concentration profile model built into a Monte Carlo framework, is applied to predict the variability of the performance of a concentration-based control strategy for filling an agitated, gassed bioreactor. An optimization methodology for selecting an appropriate post-fill target concentration and for quantifying the economic benefit of reducing variability is proposed.
Thesis Supervisor: Donald Rosenfield
Title: Senior Lecturer, IT Sloan School of Management, Director, Leaders for Global Operations Program
Thesis Supervisor: Bernhardt Trout Title: Professor, Chemical Engineering
ACKNOWLEDGEMENTS
To the MIT Leaders for Global Operations Program and Amgen, Inc., thank you for the generous support and for providing me with this wonderful opportunity for personal and professional growth.
To my Amgen colleagues, thank you for your mentorship and invaluable contributions to the success of the project.
To my academic advisors, thank you for your guidance and for continually challenging me to improve. To my friends and family, thank you for your patience and for your encouragement through the graduate school experience.
NOTE ON PROPRIETARY INFORMATION
Information used in the analysis described in this document that is proprietary to Amgen is withheld. Such information includes, but is not limited to, the raw data used to develop the transient concentration profile model and the Monte Carlo simulation described in Chapters 5 and 6, respectively.
Table of Contents
1. Introduction ... 16
1.1. Project Motivation ... 16
1.2. Problem Statem ent ... 17
1.3. Project G oals... 18
1.4. Project Approach ... 18
1.5. T hesis Statem ent ... 19
1.6. Thesis Overview ... 19
2. Drug Substance Manufacturing at Amgen and Relevant Details of Production Reactor Filling at Amgen Rhode Island... 21
3. L iterature R eview ... 22
3.1. Scope of Literature Review ... 23
3.2. Transient Concentration Profiles during Agitated Tank Batch Filling Operations23 3.3. Modeling Approaches Chosen for Use ... 28
4. Current State of Production Reactor Fill Operation ... 28
4.1. Data Used to Assess Current State... 29
4.2. Characterization of Process Variance ... 29
4.3. Relationship between Post-Fill CCP Concentration and Process Yield ... 31
5. Modeling of Production Reactor CCP Concentration during Fill Operation ... 31
5.1. Data Used to Determine Transient Concentration Profile Model Parameters...32
5.2. Transient Concentration Profile Model Development ... 33
5.3. Transient Concentration Profile Model Fitting Approach...36
5.4. Results of Transient Concentration Profile Modeling ... 45
6. Probabilistic Estimation of Variability of Fill Operation Control Using Measured CCP C oncentration ... 5 1 6.1. Probabilistic Modeling Methodology ... 52
6.2. Probabilistic Model Input Parameters and Model Baselining ... 55
6.3. Results of Process Performance Simulation ... 59
7. Quantification of Benefit of Reducing Variability ... 66
7.1. Optimization Methodology for Selecting Target CCP Concentration...66
7.2. Example Application of Optimization Methodology ... 70
7.3. Use of Optimization Methodology to Evaluate Economics of Technologies Affecting Variability ... 73
8. Conclusions and Recommendations ... 74
8.1. Conclusions for Manufacturing at Amgen... 74
8.2. Recommendations for Future Initiatives... 74
9 . R eferen ces...75
Appendix A Derivation of Equation (8)...78
Appendix B Transient Concentration Profile Model Fitting Results and Probability Distributions Used in Monte Carlo Simulation ... 80
List of Figures
Figure 1 Fractional Deviation from Target Post-Fill CCP Concentration from Production Runs Representative of the Current State ... 30
Figure 2 Example Modeled System Response to Series of Sequentially Injected Tracer
Pulses 35
Figure 3 Concentrate Flow Rate Calculated as the Ratio of the Change in Volume in the Production Reactor to the Time Duration of the Interval ... 38
Figure 4 Linear Regression Representation of Concentrate Flow Rate ... 39
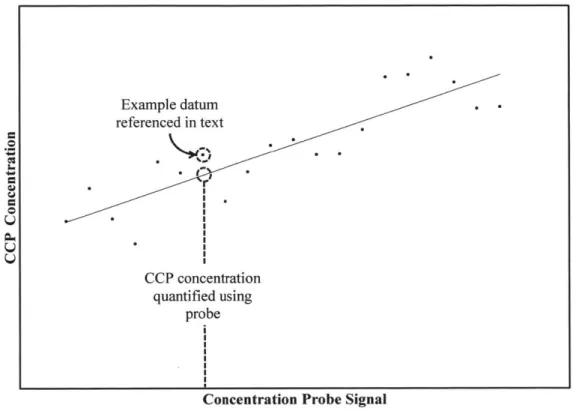
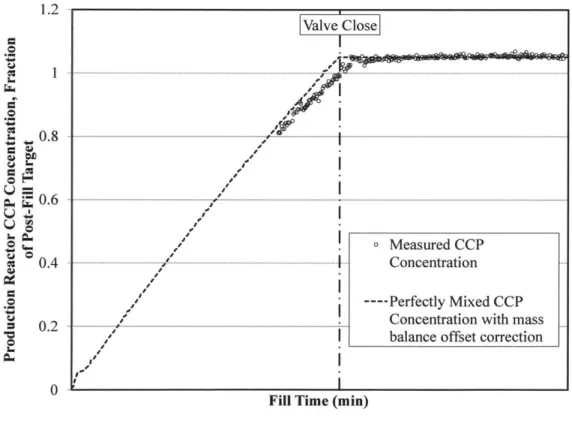
Figure 5 Representative Fill Profile with Modeled Perfectly Mixed CCP Concentration Profile without M ass Balance Offset Correction... 40 Figure 6 Qualitative Relation between CCP Probe Signal and Offline CCP Concentration Measurement for Source Vessel (plot data developed using random number generation and are not representative of Am gen performance) ... 41 Figure 7 Representative Fill Profile with Modeled Perfectly Mixed CCP Concentration
Profile 43
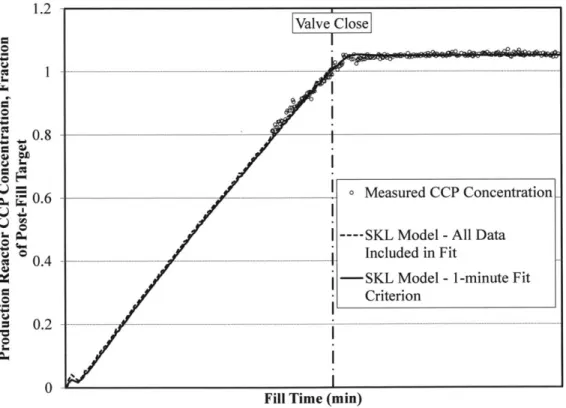
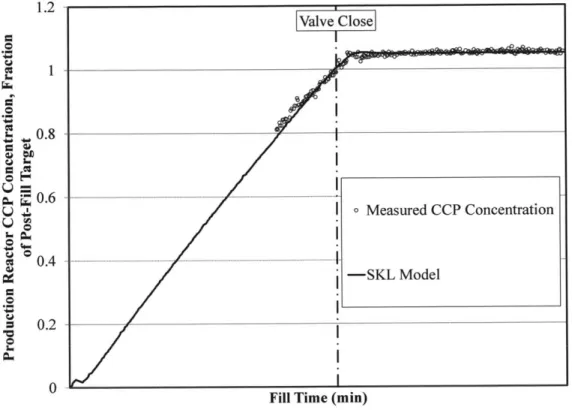
Figure 8 Representative Fill Profile with SKL Model Fit to: (1) All Measured CCP
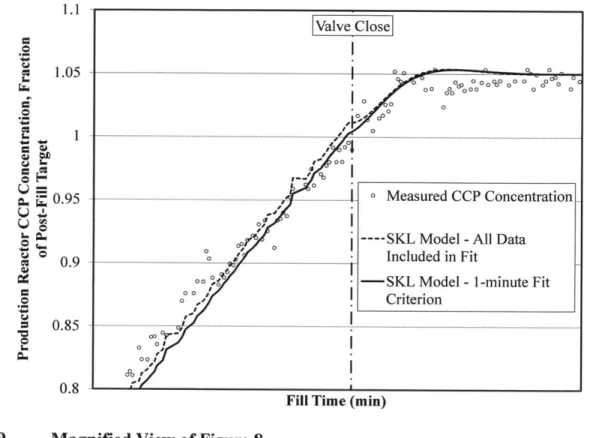
Concentration Data, and (2) Measured CCP Concentration with One-Minute Criterion Applied44 Figure 9 M agnified View of Figure 8 ... 45 Figure 10 Representative Fill Profile with Transient Concentration Profile Model Fitted as D escribed in Section 5.3 ... 46
Figure 11 Modeled CCP Concentration vs. Measured CCP Concentration for a Representative
Fill 47
Figure 12 Modeled CCP Concentration Fit Residual vs. Measured CCP Concentration for a R epresentative F ill ... 47
Figure 13 Production Reactor Transient Response to Tracer Pulse Injection Modeled Using M ean Values of Single-Pass RTD Parameters... 49 Figure 14 Transient Concentration Profile Model Parameters vs. Mass Balance Offset
Correction 49
Figure 15 Mean of Single-Pass RTD vs. Dimensionless Variance of Single-Pass RTD...50 Figure 16 Single-Pass RTD Parameters vs. Standard Deviation of Error about SKL Model Fit51 Figure 17 Structure of M onte Carlo Simulation... 54
Figure 18 Increase in CCP Concentration after Concentrate Inlet Valve Closure ... 59
Figure 19 Distribution of Realized Steady State CCP Concentration using Volume-Based and Concentration-Based Process Control ... 60
Figure 20 Relationship between Mean of Simulated Performance and Threshold CCP Concentration for Concentrate Inlet Valve Closure... 61
Figure 21 Relationship between Standard Deviation of Simulated Performance and Threshold CCP Concentration for Concentrate Inlet Valve Closure ... 62
Figure 22 Sensitivity Case Results: Mean of Simulated Performance...64
Figure 23 Sensitivity Case Results: Standard Deviation of Simulated Performance...65
Figure 24 Distribution of Simulated Post-Fill CCP Concentration using Concentration-Based Control with Overlaid Normal Distribution... 71
Figure 25 Demonstration of Graphical Approach to Selecting Optimum Target Post-Fill CCP Concentration (inputs used to generate plot chosen to facilitate ready visual interpretation of optimization method; plot is not representative of Amgen performance)...73
Figure 26 Fitted Normal Distribution of Initial Liquid Volume in Production Reactor ... 80
Figure 27 Fitted Normal Distribution of Concentrate Flow Rate ... 81
Figure 28 Fitted Normal Distribution of Source Vessel CCP Concentration ... 81
Figure 29 Fitted Weibull Distribution of Mean of Production Reactor Single-Pass RTD...82
Figure 30 Fitted Lognormal Distribution of Dimensionless Variance of Production Reactor Single-P ass R T D ... 82
Figure 31 Fitted Lognormal Distribution of Variability of Production Reactor CCP Concentration Measurement during Fill Operation...83
List of Tables
Table 1 Summary of Monte Carlo Simulation Inputs...57 Table 2 Description of Monte Carlo Sensitivity Cases...64
List of Abbreviations
ARI CCP CFD cGMP CHO KL Model RHS RTD SKL Model VBAAmgen Rhode Island Cell Culture Parameter
Computational Fluid Dynamics
Current Good Manufacturing Practices Chinese Hamster Ovary
Khang-Levenspiel Model Right-Hand Side
Residence Time Distribution Summed Khang-Levenspiel Model Visual Basic for Applications
1. INTRODUCTION
The biopharmaceutical industry delivers therapeutic proteins to patients. Many of these medications are indicated for the treatment of grievous illness and serve a critical function in the management of these diseases. These molecules are often manufactured through a batch process in which the desired protein is expressed using a genetically engineered cell line such as Chinese Hamster Ovary (CHO) or E. coli cultured in a large bioreactor and then purifying and
formulating it for use by patients [1]. The performance of biopharmaceutical manufacturing processes may be enhanced with respect to a number of objectives, for example, yield or cycle time. Such enhancements are critical to a facility's ability to supply consistent and efficacious material in a cost effective manner.
A discussion of an improvement intended to enhance the consistency of the cell culture process by which the protein of interest is produced constitutes the focus of this document. This process improvement involves the use of an alternative process control strategy that would be intended to reduce the variability of the performance of a batch filling operation associated with the protein production step. While the focus of this document is restricted to a particular cell culture operation, the methodologies developed through this work may be generally applied to: (1) batch chemical injection operations conducted in agitated tanks, and (2) quantification of the economic impact of the variability inherent in these operations.
1.. PROJECT MOTIVATION
The profit margins that biopharmaceutical companies have historically been able to earn have been supported by patent exclusivity and a number of challenges that limit the competitive threat posed by follow-on biologics [2]. Some companies have responded to expected evolution of the competitive landscape by placing additional emphasis on reducing their costs of
manufacturing as a means of protecting their competitiveness.
The prototypical current generation biopharmaceutical drug substance manufacturing facility requires a large upfront capital investment [3]. Making more efficient use of its existing
1 Shuler and Kargi, Bioprocess Engineering / Michael Shuler, Fikret Kargi.
2 Pasanek, "The Conclusion of a Biologic's Lifecycle."
3 "Amgen Announces FDA Licensure of Two New Manufacturing Facilities; Company Continues to Meet
production facilities represents one way in which a company may reduce its costs of
manufacturing. Specifically, by using existing plants more efficiently, companies may be able to avoid or delay investments in additional production capacity and the associated capital and fixed costs that it might otherwise need to make to meet future demand. These efficiency gains may be realized by improving one or more of the following aspects of the production processes for its commercial and clinical molecules: (1) yield (mass of protein per production lot), (2) run rate (production lots per time), and/or (3) success rate (probability a given production run will yield in-specification product). Introducing a new technology into an existing facility represents a possible means of gaining yield, run rate, and/or success rate improvements.
1.2.PROBLEMSTATEMENT
The purpose of the internship, during which the work providing the basis for this
document was performed, was to identify technologies that would provide yield, run rate, and/or success rate improvements in an existing biopharmaceutical manufacturing facility and to develop business cases to support the potential adoption of promising candidates. The technical and economic bases for the implementation of one of these technologies are described in this document.
During the protein production step, various liquids, such as cell culture media, suspension containing live cells, and other nutrients, are added to the Production Reactor. Variability
inherent in a particular filling operation executed during this step introduces a finite probability that the post-fill value of a cell culture parameter (CCP) realized in the Production Reactor
culture will fall outside of pre-defined control limits during a given run, violating the process specification. Reducing this variability is desirable, because: (1) it demonstrates control over the process, (2) improves step yield reproducibility, and (3) reduces the probability of violating
control limits and the associated business and potential plant quality impacts. To protect proprietary information, the nature of this CCP is not discussed in this document. Sufficient
information is provided in the body of the text such that the nature of the CCP does not affect the analysis described in this document.
1.3. PROJECT GOALS
The first goal of this project is to predict the extent to which variability in the filling operation may be reduced by controlling the process using an inline measurement of CCP concentration in the Production Reactor rather than the current volume-transfer-based strategy. The second goal is to establish a risk-based framework for use in selecting a target value for the post-fill CCP concentration and quantifying the economic impact of this process improvement.
The purpose of conducting this work is twofold. First, these goals directly support the development of a business case for the process improvement of interest. Second, the risk-based framework may be adapted as needed to other process decisions in which stochastic effects are of practical importance.
1.4.PROJECTAPPROACH
The content of this document is based on work performed during a 6.5-month internship completed at the Amgen Rhode Island (ARI) drug substance manufacturing facility. As
described in Section 1.2, the purpose of this internship was to identify technologies that could provide a throughput benefit and develop supporting business cases for promising candidates. This work was conducted in three phases: (1) analysis of the current capabilities of the facility, (2) identification of technologies that may be used to improve process throughput, and (3) assessment of the technical and economic feasibility of implementing promising candidate technologies. The proposed cell culture process control strategy, which is the focus of this document, was identified through the current state assessment of the facility. The assessment of its technical and economic feasibility of implementation forms the content of this document. Additional description of the identification, selection, and business case development for other technologies considered as part of the internship is outside the scope of this document and is not discussed further.
The performance of the proposed process control strategy, hereafter referred to as concentration-based control, is predicted using an engineering and probabilistic modeling framework. This framework consists of an engineering model that is used to simulate the
transient mixing process taking place in the Production Reactor during the fill and a Monte Carlo simulation that is used to account for the variability inherent in the system. Additional discussion of this framework is provided in the body of this document. An engineering-probabilistic
approach is considered appropriate for this application for the following reasons. First, physically simulating the variabilities of interest in a representative manner would require conducting experiments in the Production Reactors, which is both cost and time prohibitive. Second, a probabilistic approach is considered appropriate given the prominence of stochastic effects in the problem of interest and the capability of this approach to generate a statistically robust prediction of process variability.
A risk-based framework that may be used to quantify the economic benefit of the
improved performance provided by concentration-based control is developed for the problem of interest. In addition to its use in assessing concentration-based control, this framework may also be used to support recommendations regarding changes to the fill operating strategy.
1.5. THESIS STATEMENT
The thesis proposed in this document consists of two parts. First, it is asserted that under the conditions of interest, the variability of the performance of the filling operation may be reduced by implementing a concentration-based process control strategy in place of the current volume-transfer-based strategy. This assertion is supported by a prediction of the variability of this control strategy made using a Monte Carlo framework developed using historical operating
data. Second, it is asserted that the benefit of reduced variability may be quantified using a risk-based framework. An example is provided to demonstrate the application of this framework.
1.6. THESIS OVERVIEW
The discussion provided in this document is organized into a number of chapters and sub-sections, which are briefly summarized as follows.
Chapter 1 - The purpose of Chapter 1 is to provide an introduction to this document. Included in this chapter are the: (1) project motivation, (2) problem statement, (3) project goals, (4) project approach, (5) thesis statement, and (6) thesis overview.
Chapter 2 - The purpose of Chapter 2 is to provide a brief description of the Amgen drug substance manufacturing network and some specifics of Production Reactor filling at ARI as a means of establishing context for the work described in this document.
Chapter 3 - The purpose of Chapter 3 is to provide a basis for the modeling work described in Chapters 5 through 7. Included in this chapter are the following: (1) a summary of
the rationale for high-level aspects of the modeling approach, and (2) a review of modeling of transient concentration profiles encountered during batch chemical injections performed in mixed tanks as documented in the literature.
Chapter 4 - The purpose of Chapter 4 is to provide a brief description of the current state of the Production Reactor filling operation of interest to establish a basis against which the predicted variability of concentration-based control may be compared.
Chapter 5 - The purpose of Chapter 5 is to provide a description of the model developed to simulate the transient CCP concentration profile in the Production Reactor during the fill. Included in this chapter are descriptions of the: (1) data used to determine the model parameters, (2) transient concentration profile model development, (3) model fitting approach, and (4) modeling results. This model is used in the Monte Carlo simulation described in Chapter 6 to provide a simulation of the transient CCP concentration profile in the Production Reactor during the filling operation.
Chapter 6 - The purpose of Chapter 6 is to provide a description of the probabilistic simulation developed to predict the performance of the concentration-based control strategy. Included in this chapter are descriptions of the: (1) probabilistic modeling methodology, (2) probabilistic model inputs and model baselining, (3) results of the simulation, and (4)
recommended process control strategy. The results of the probabilistic simulation serve as an input in the example application of the optimization method described in Chapter 7.
Chapter 7 - The purpose of Chapter 7 is to provide an optimization framework for selecting operating setpoints when variability is of practical importance and for quantifying the value of improvements that reduce process variability. Included in this chapter are: (1) a
description of the optimization methodology for selecting the target CCP concentration, (2) an example application of this methodology, and (3) a description of how the methodology may be applied to quantify the benefit provided by reducing variability.
Chapter 8 - The purpose of Chapter 8 is to provide a summary of the conclusions and recommendations outlined in this document. Included in this chapter are: (1) a summary of conclusions related to the Production Reactor filling operation at ARI, and (2) a list of recommendations for future work that may merit further investigation.
2. DRUG SUBSTANCE MANUFACTURING A TAMGENAND RELEVANT DETAILS OF PRODUCTION REACTOR FILLING AT AMGEN RHODE ISLAND
As described in the introduction to this document, the biopharmaceutical industry delivers therapeutic proteins to patients. Amgen participates in a broad spectrum of activities related to the delivery of these therapeutics, which includes: (1) drug discovery and
development, (2) drug substance (active ingredient) and drug product (finished good that is administrable to patients) manufacturing, and (3) sales and marketing of drug product. Amgen operates a number of facilities, which are dedicated to one or more of these activities, across the world including a network of drug substance manufacturing facilities [4]. The internship upon which the content of this document is based was performed at the Amgen Rhode Island (ARI) drug substance manufacturing facility. This chapter contains a description of the impact that an improvement made at ARI would have on the network.
As its product portfolio evolves over time, Amgen must periodically decide where it will manufacture its commercial and clinical drug substance. Some available production sourcing options include its existing manufacturing facilities and construction of new plants. Efficiency improvements that enable the manufacture of additional material in a given amount of time, such as optimization enabled by the improvement described in this report, liberate time in existing facilities that may be used to accommodate additional production. Liberation of production time in facilities that are capable of producing multiple products, such as ARI [5,6], provides
flexibility for the drug substance network as a whole. This flexibility is valuable as it may enable the costs of expanding manufacturing capacity, building a new plant, for example, to be avoided or delayed.
Drug substance production involves a number of activities, which include cell culture scale-up, protein production, and purification [7]. This document is focused on a particular filling operation that takes place during the protein production step. Additional description of the other activities taking place during drug substance manufacturing is therefore outside the scope of this report. Information related to other aspects of production at ARI is provided in [8] and [9].
4 "Amgen Manufacturing Fact Sheet."
5 Pasanek, "The Conclusion of a Biologic's Lifecycle."
6 Kolata, "Rare Mutation Ignites Race for Cholesterol Drug -NYTimes.com."
7 Shuler and Kargi, Bioprocess Engineering / Michael Shuler, Fikret Kargi.
8 Pasanek, "The Conclusion of a Biologic's Lifecycle."
As noted above, this document is focused on a particular cell culture filling operation. This operation involves the 20,000 L Production Reactors [10] installed at ARI in which therapeutic protein is expressed. Prior to the start of the fill operation, the Production Reactor
contains a quantity of liquid. At the start of the fill operation, flow of liquid from a source tank into the Production Reactor is initiated. During the fill, the source tank liquid, which contains the
CCP species, is continuously mixed with the contents of the Production Reactor. After the fill is
completed, a homogeneous, post-fill CCP concentration is reached in the Production Reactor. Because the CCP concentration of the source tank liquid is greater than the post-fill CCP concentration in the Production Reactor, the source tank material is hereafter referred to as concentrate.
The Production Reactors are equipped with a number of instrumentation and sampling ports. The CCP concentration probe is installed in one of these ports. The reactors are also
equipped with turbine agitation, gas sparging, and a control system to maintain system setpoints, such as that for temperature. Turbine agitation is used to facilitate mixing of the cell culture during the protein production step. While gas sparging also contributes to the agitation of the system, it is used to control certain aspects of the chemistry of the culture suspension and may not be used for mixing control. During the filling operation of interest, the following Production Reactor parameters are nominally identical between batches: (1) culture suspension composition
and temperature, (2) turbine agitation and baseline sparge gas flow, and (3) volume in the Production Reactor at the start of the fill. The total sparge flow varies to some extent between batches as the control system adjusts the sparge to control chemistry. This aspect of the fill process is discussed in additional detail in Section 5.3.4. Additional detail regarding parameters,
such as reactor, impeller, and sparger geometry, fluid properties, and process setpoints, is proprietary and is not included in this document.
3.
LITERATURE REVIEWThe questions central to the work described in this document are: (1) what is the variability of the performance of concentration-based control?, and (2) what economic benefit may be attained as a result of process optimization enabled by this performance improvement?
3.1. SCOPE OF LITERATURE REVIEW
For the reasons discussed in Section 1.4, namely considerations of cost and schedule, the variability of the performance of concentration-based control is addressed using a simulation approach. A Monte Carlo framework is used to simulate: (1) the transient CCP concentration profile in the Production Reactor when material is injected, and (2) real-time measurement of the
CCP concentration during the fill. A literature review is needed to identify a suitable means of
numerically simulating the transient CCP concentration profile during the fill. This review is summarized in Section 3.2.
As described in Section 1.2, developing business cases to support the implementation of new technologies in an existing biopharmaceutical manufacturing facility was the goal of the internship upon which the content of this document is based. The Newsvendor framework is a well-known concept in operations management, see [11] and [12], for example. In the context of the business case developed for concentration-based control, this framework provides an
acceptably detailed means of quantifying the economic benefit enabled by this process
improvement. Adaptation of the Newsvendor framework to the problem of interest is described in Sections 7.1 and 7.2. Given the flexibility of this framework and its fitness for purpose, potential alternative means of assessing the cost of variability in the context of the problem of
interest are not discussed in this document.
3.2. TRANSIENT CONCENTRA TION PROFILES DURING AGITA TED TANK BA TCH FILLING
OPERATIONS
Given the engineering-probabilistic simulation approach chosen for use in this work, a means of simulating the transient CCP concentration profile in the Production Reactor during a
fill is needed. In the limit of an ideal stirred tank reactor, a volume of material injected into the
tank is assumed to reach instantaneous homogeneity with the tank's contents [13]. When this idealized model provides an acceptable degree of accuracy, the transient CCP concentration profile during the fill may be derived using a straightforward species balance. For cases in which the timescale of homogenization is significantly shorter than that of the process of interest, a first
" McClain and Thomas, Operations Management: Production of Goods and Services / John 0. McClain, L. Joseph Thomas.
12 Cachon and Terwiesch, Matching Supply with Demand: An Introduction to Operations Management / Girard Cachon, Christian Terwiesch.
order chemical reaction whose kinetics are sufficiently slower than the mixing process, for example, the assumption of instantaneous mixing may provide acceptable accuracy. As discussed in Section 5.2, the idealized stirred tank model is inadequate under the conditions relevant to the Production Reactor filling operation of interest.
Homogenization of material injected into an agitated tank occurs via a number of
physical processes including convection due to bulk circulation of the injected material induced
by agitation of the tank [14,15] and dispersion of the material due to turbulent eddy transport [16,17]. The flow and dispersion induced by these processes lead to both spatial and temporal
variations in concentration during a tank batch filling operation [18,19,20]. Several aspects of the tank-liquid-gas system, such as tank geometry, agitation intensity, gas flow rate, and fluid
properties, are known to affect the liquid velocity profile that forms within the tank and thus the mixing characteristics of the reactor [21,22,23,24].
No methodologies for modeling the transient concentration profile of a species during a sustained injection of material into an agitated tank were identified through this literature review. Treatment of the injection of a pulse of tracer material, often an inert chemical species, into a stirred tank, however, is well established and modeling of the time required to reach a given degree of homogeneity within the tank after the tracer injection is well documented [25]. The mixing time achieved in an agitated tank refers to the time required for a measured quantity, e.g., solution conductivity, to remain, over time, within a specified fraction of its eventual steady state value. A variety of relations correlating mixing time to factors such as impeller speed, geometry, type, and number, sparge gas flow rate, and vessel geometry are available, for example,
[26,27,28,29,30]. While the engineer may find such mixing time correlations useful for reactor
14 McCabe, Smith, and Harriott, Unit Operations of Chemical Engineering.
" Ibid.
16 Kawase and Moo-Young, "Mixing Time in Bioreactors." 17 Ghanem et al., "Static Mixers."
18 McCabe, Smith, and Harriott, Unit Operations of Chemical Engineering.
19 Vasconcelos, Alves, and Barata, "Mixing in Gas-Liquid Contactors Agitated by Multiple Turbines."
20 Hadjiev, Sabiri, and Zanati, "Mixing Time in Bioreactors under Aerated Conditions." 21 McCabe, Smith, and Harriott, Unit Operations of Chemical Engineering.
22 van't Riet and van der Lans, "Mixing in Bioreactor Vessels."
2' Hadjiev, Sabiri, and Zanati, "Mixing Time in Bioreactors under Aerated Conditions."
24 Gogate, Beenackers, and Pandit, "Multiple-Impeller Systems with a Special Emphasis on Bioreactors."
25 Levenspiel, Tracer Technology [electronic Resource]: Modeling the Flow of Fluids / Octave Levenspiel. 26 McCabe, Smith, and Harriott, Unit Operations of Chemical Engineering.
27 Levenspiel, Tracer Technology [electronic Resource]: Modeling the Flow of Fluids / Octave Levenspiel. 28 Gogate, Beenackers, and Pandit, "Multiple-Impeller Systems with a Special Emphasis on Bioreactors."
design and other purposes, this measure alone does not provide a means of modeling the entire transient concentration profile observed at a particular location within the tank as it mixes. Further complexity is introduced by the fact that the concentration profile may not approach steady state in a monotonic fashion as a result of the circulating nature of the flow induced by the tank agitation.
Three methods that may be used to model the temporal and spatial concentration profiles associated with a batch filling operation in an agitated tank are described in this section: (1) compartment models, (2) a model based on residence time distribution (RTD) theory, and (3) computational fluid dynamics (CFD) models. Using these models, deviations from ideal stirred tank behavior may be addressed. Brief descriptions of each model and its applications, strengths and limitations are provided in the following discussion.
The spatial variation of the mixing characteristics of the vessel may be approximated by segregating the total volume of the vessel into modeled compartments, for example,
[31,32,33,34,35]. For example, Mayr et al. provide a compartment representation of a gassed
batch reactor with turbine agitation in which the vessel volume is approximated as a series of interconnected ideal stirred tanks [36]. With this formulation, the transient tracer concentration profile in each of the modeled compartments is given by solution of the system of differential equations representing conservation of the tracer as it flows between the compartments and disperses within the bulk fluid. Other idealized flow constructs in addition to the ideal stirred tank, such as ideal plug flow (also known as piston flow), short-circuiting, and stagnant regions, may also be included in a compartment model, for example, [37] and [38]). Using these idealized constructs, compartment models may be formulated with substantial flexibility. Additionally, given the segregation of the vessel volume into conceptually friendly sub-units, compartment models may also offer a more readily understandable physical representation of the complicated
29 Vasconcelos, Alves, and Barata, "Mixing in Gas-Liquid Contactors Agitated by Multiple Turbines." 30 Paul, Atiemo-Obeng, and Kresta, Handbook of Industrial Mixing: Science and Practice / Edited by Edward L. Paul, Victor A. Atiemo-Obeng, Suzanne M Kresta.
31 Levenspiel, Tracer Technology [electronic Resource]: Modeling the Flow of Fluids / Octave Levenspiel. 32 Mayr et al., "Mixing-Models Applied to Industrial Batch Bioreactors."
3 Vasconcelos, Alves, and Barata, "Mixing in Gas-Liquid Contactors Agitated by Multiple Turbines." 34 Magelli et al., "Mixing Time in High Aspect Ratio Vessels Stirred with Multiple Impellers."
3 Behin and Bahrami, "Modeling an Industrial Dissolved Air Flotation Tank Used for Separating Oil from
Wastewater."
36 Mayr et al., "Mixing-Models Applied to Industrial Batch Bioreactors."
3 Levenspiel, Tracer Technology [electronic Resource] : Modeling the Flow of Fluids / Octave Levenspiel.
bulk mixing process. Despite these strengths, introducing complexity comes with costs. First,
with increasing complexity, it is often necessary to obtain additional information regarding the
characteristics of the system, the actual exchange flow rates between adjacent compartments [39], for example, and/or make additional simplifying assumptions, for example, [40]. Obtaining such information requires the ability to measure quantities, such as flow characteristics, at multiple locations within the vessel. Installing additional instrumentation in the ARI Production Reactors, which are commissioned for manufacturing of cGMP material (i.e., material
manufactured in accordance with standards and practices enforced by the United States Food and Drug Administration), for the purpose of testing is not tractable. Second, by definition, the idealized models used to formulate a compartment model provide an imperfect representation of the actual physical process of mixing taking place in the vessel. Due to the difficulty in
validating the appropriateness of these idealized assumptions when appropriate data are not available, it is desirable to limit the number of idealized assumptions made in modeling the performance of the reactor.
The modeling method based on RTD theory enables the simulation of the transient concentration profile at a given location within the vessel [41]. The RTD framework provides a means of describing the flow behavior that develops in non-ideal vessels [42]. In the case of a
continuous flow reactor, the RTD describes the probability that a molecule entering the vessel will reside in the vessel for a given amount of time [43]. As the RTD is a probability distribution, the mean and variance, which provide measures of central tendency and spread, respectively, are
often of interest. While there is no flow of material exiting a batch reactor, the RTD concept applies if one considers the probability distribution describing the first time in which a molecule passes a particular location in the vessel, the location of a measurement probe, for example. Such
a distribution is referred to as a single-pass RTD [44]. Khang and Levenspiel propose a
methodology, referred to hereafter as the KL Model, based on the single-pass RTD determined
39 Vasconcelos, Alves, and Barata, "Mixing in Gas-Liquid Contactors Agitated by Multiple Turbines."
40 Van de Vusse, "A New Model for the Stirred Tank Reactor."
41 Khang and Levenspiel, "New Scale-up and Design Method for Stirrer Agitated Batch Mixing Vessels." 42 Schmidt, The Engineering of Chemical Reactions / Lanny D. Schmidt.
43 Ibid.
for the vessel by which the transient concentration profile of a tracer species may be modeled [45]. This model applies for any RTD with small variance and is given as follows [46]:
y(t)~1+2e- T tcos y'Tt +2rcY (1)
where y is the dimensionless impulse response of a recycle stream, which in the case of interest represents the transient dimensionless concentration profile of an injected tracer as it mixes, t is time, o2 is the dimensionless variance of the pass RTD, and T is the mean of the
single-pass RTD. The dimensionless variance is defined as follows [47]:
o0 = a (2)
where a- is the dimensional variance of the single-pass RTD.
This methodology is attractive as it does not require the use of idealized assumptions and requires only two fit parameters, where a compartment model may require more than two
parameters depending on its level of sophistication. Additionally, given its relative simplicity, of the three methodologies described in this section this model is the most readily incorporated into a Monte Carlo framework.
CFD modeling provides a third means of understanding the flow patterns that develop
within an agitated vessel, for example, [48,49,50,5 1]. In the context of this document, CFD is considered to be the most flexible and powerful means of modeling a tracer pulse injection described in this section as it can be used to model the concentration profile at any point in an agitated vessel under any reasonable set of operating conditions, such as vessel and agitator geometry, fluid properties, and sparging conditions. Additionally, using CFD, it is possible to investigate both transient and steady state conditions. Finally, CFD simulation does not inherently require the use of idealized assumptions required by compartment models or the lumped approach of an RTD model. These strengths again come with several costs. In the context of the work described in this document, the significant computation time associated with executing complex CFD simulations is the most important drawback of this approach.
45 Ibid.
46 Ibid.
47 Ibid.
48 Liu, "Age Distribution and the Degree of Mixing in Continuous Flow Stirred Tank Reactors."
49 Basheer and Subramaniam, "Hydrodynamics, Mixing and Selectivity in a Partitioned Bubble Column." 5 Zadghaffari, Moghaddas, and Revstedt, "Large-Eddy Simulation of Turbulent Flow in a Stirred Tank Driven by a Rushton Turbine."
Specifically, the long computation time associated with CFD modeling makes this method less amenable for use in generating a statistically robust data set. Second, establishing a
representative simulation model of the vessel can be time consuming and costly. Third, while modeling a pulse injection using CFD has been documented in the literature, for example, [52], it may not be practical to model a sustained injection using CFD.
3.3. MODELING APPROACHES CHOSEN FOR USE
The discussion presented in this chapter is intended to provide an analysis and brief summary of published work that is relevant to answering the following questions: (1) how may the transient CCP concentration profile during the fill be numerically simulated?, and (2) what economic benefit may be expected as a result of this performance improvement? Based on this review, the following methodologies are selected for use in the work described in this report:
* The KL Model is selected for use as the foundation of the transient CCP concentration profile model. The transient profile model is described further in
Section 5.2.
" As described in Section 3.1, the well-known Monte Carlo and Newsvendor
approaches are chosen for use in simulating the performance of the concentration-based control strategy and evaluating the economics of the improvement,
respectively.
4. CURRENTSTA TE OF PRoDUCTIONREA CTOR FILL OPERA TION
In the current state, the Production Reactor fill operation described in this report is
controlled using a volume-transfer-based strategy. Just prior to the fill, the volume of concentrate required to achieve the pre-defined target CCP concentration in the Production Reactor is
calculated using the following real-time data: (1) the CCP concentration measured in the tank containing the concentrate, and (2) the volume of liquid present in the Production Reactor. The sum of the liquid volume in the Production Reactor and the target concentrate volume constitutes the target final volume immediately after completion of the fill. Concentrate transfer from the source vessel to the Production Reactor is secured when the target final volume is reached in the Production Reactor. The CCP concentration in the Production Reactor is then measured.
52 Zadghaffari, Moghaddas, and Revstedt, "Large-Eddy Simulation of Turbulent Flow in a Stirred Tank
The purpose of this chapter is to provide a characterization of the current state of the performance of this Production Reactor filling operation, which serves as the basis for comparison with the predicted performance of concentration-based control. Additionally, a sample relation between the performance of the fill operation and the overall performance of the protein production step is included for use in the example quantification of the economic impact of this improvement discussed in Chapter 7.
4. 1.DATA USED TO ASSESS CURRENT STATE
A number of data are logged for each production run and are subsequently stored in a
centralized database. The quantities relevant to the current state assessment documented in this chapter include the: (1) CCP concentration measured in the Production Reactor after completion of the fill (post-fill CCP concentration), and (2) final protein concentration measured at the completion of the protein production step. Data from a representative range of historical production runs are used to characterize the current state of the fill operation. These data are proprietary to Amgen and are thus withheld from this document.
4.2. CHARACTERIZATION OF PROCESS VARIANCE
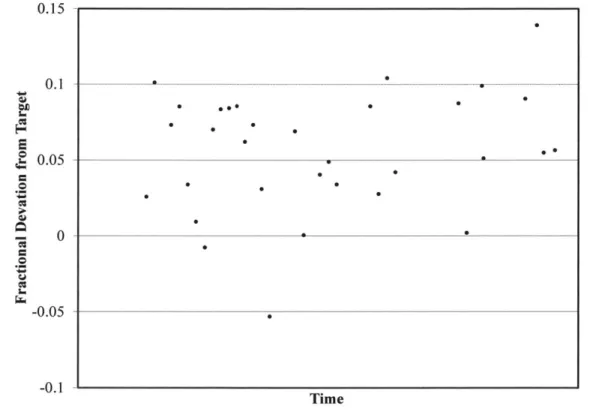
The fractional deviation from the target post-fill CCP concentration from a representative sample of production runs is presented in Figure 1. The fractional deviation provides a means of discussing the variability of the current state without disclosing proprietary data. The following observations are drawn from this plot. First, in the current state, the realized post-fill CCP concentration consistently exceeds the target. Second, the magnitude and variability of the overshoot do not vary much over time. This observation is reasonable as the individual
variabilities mentioned above remain constant during the period of observation. The overshoot is considered to be a manageable characteristic of the fill operation, because its average magnitude is consistent over time. The variability of the process introduces a finite probability that a given
fill will result in an overshoot that exceeds the pre-defined upper limit post-fill CCP
concentration as a result of inherent randomness. Reducing this variability is therefore desirable. The variability of the performance of the fill operation is introduced by the following: (1) the variability of the concentrate CCP concentration and initial Production Reactor volume measurements, which are made before the start of the fill operation, (2) the variability of the
actual volume of concentrate transferred relative to the target transfer volume, and (3) the
variability of the Production Reactor post-fill CCP concentration measurement. A disaggregation of the individual contributions of each of these sources of variability is not required to achieve the purpose of the analysis documented herein and thus is not included in this document. It is noted that the variability introduced by the measurement of the concentration of the CCP concentrate and initial Production Reactor volume would not affect the performance of
concentration-based control, because this information would no longer be used to make process decisions. Additional detail regarding the contributions to the variability of concentration-based control is provided in Section 6.2.1.
0.15
0.05
0
-0.05
-0.1 Time
Figure I Fractional Deviation from Target Post-Fill CCP Concentration from Production Runs Representative of the Current State
In order to evaluate the impact of concentration-based control on the performance of the fill operation, it is necessary to characterize the variability of the overshoot described above. On average, the current state fill process leads to an overshoot of approximately 6% of the post-fill target and a standard deviation in post-fill CCP concentration equal to approximately 4% of the target. It is noted that because the variability of the current state may be affected by other process changes, when evaluating concentration-based control for potential implementation, it would be
necessary to update the current state performance evaluation. Based on a Shapiro-Wilk W Test, a normal distribution provides an adequate description of the post-fill CCP concentration data. A normal distribution is therefore assumed for the purpose of making statistical inferences related to the current state elsewhere in this document.
4.3. RELA TIONSHIP BETWEEN POST-FILL
CCP
CONCENTR ATION AND PROCESS YIELDReducing the variability of the fill operation is beneficial for a variety of reasons including opportunities for process optimization enabled by tightened process control. For molecules in which the protein titer contained in the culture broth at the completion of the protein production step is positively correlated with the post-fill CCP concentration, batch-wise product yield may be increased by increasing the post-fill CCP concentration realized after each
fill. Since the quantitative relationship between final titer and post-fill CCP concentration for a
given molecule is proprietary to Amgen, such information is not included in this document. For the purpose of demonstrating the framework developed to quantify the benefit of reducing the variability of the fill operation, the following relationship between final titer and post-fill CCP concentration is applied in the analysis detailed in Chapter 7.
MP = Y CCPPF + constant (3)
where Mp is the mass of protein produced during a batch, Y is the production step yield, and
CCPPF is the measured post-fill CCP concentration. The following points are made regarding the above relation. First, this form is not intended to represent the fundamental processes taking place during protein expression. It is chosen for its simplicity in the demonstration of the
optimization framework described in Section 7.2. Second, the form of the above relation may or may not represent the true behavior of the Amgen production process during which the fill operation occurs.
5. MoDELING OF PRODUCTION REACTOR
CCP
CONCENTRA TIONDURING FILL OPERATIONAn overview of the current state of the fill operation is provided in the introduction to Chapter 4. In that overview, the current, volume-transfer-based control strategy is described. Recall that under concentration-based control, the Production Reactor fill operation would be controlled using the inline CCP concentration measurement rather than the volume measurement.
Specifically, under this process control strategy, the flow of concentrate into the Production Reactor would be secured after a pre-defined, measured CCP concentration in the Production Reactor is reached.
As described in the introduction to Chapter 3, a simulation approach is used to predict the performance of concentration-based control. A means of modeling the transient CCP
concentration profile in the Production Reactor during a fill is therefore needed to enable the prediction of the performance of concentration-based control using a simulation approach. The model used to simulate the transient CCP concentration profile in the Production Reactor at the location of the measurement probe is developed in this chapter.
5.1. DATA USED TO DETERMINE TRANSIENT CONCENTRATION PROFILE MODEL
PARAMETERS
The concentrate source vessels and Production Reactors are outfitted with a number of instrumentation probes that provide continuous monitoring of various process parameters. The time series of data recorded by each of these instruments are archived in a centralized database. The following data recorded during a number of historical production runs are used to determine the model parameters described in Section 5.2: (1) Production Reactor CCP concentration, (2) Production Reactor volume, and (3) concentrate source vessel CCP concentration. These data are proprietary to Amgen and are thus withheld from this document. Selected results of the analysis described in this chapter are presented in Appendix B .
The instruments used to measure these data are described as follows. The raw signal measured by the CCP concentration probe is translated to CCP concentration using proprietary correlations relating probe signal to concentration measured using an offline assay. Additional detail regarding the probe and offline assay is proprietary and is withheld from this document. A correlation developed specifically for the source vessel is used to quantify source CCP
concentration and a correlation developed specifically for the Production Reactor culture is used to quantify production culture CCP concentration. Due to the proprietary nature of these
correlations, they are not included in this document. The Production Reactor volume is quantified using a mass measurement instrument, whose signal is converted to volume.
To limit the size of the data set stored by the production server, the raw signals measured
frequencies are determined using a combination of inputs from plant personnel and the
difference between the current measured value provided by the instrument and the last several values archived by the system. As a result, the data recorded for each of the instruments described above are not necessarily available at the same points in time. Since the Production Reactor CCP concentration is the measured quantity to which the mixing model parameters are fit, raw CCP concentration probe readings and associated measurement times are retrieved from the server. These data are available at an approximate frequency of 1% of the mean of the single-pass RTD. The time series associated with the Production Reactor CCP concentration raw data is used to define the times at which the values of the other parameters are retrieved from the server. Specifically, the values for the source CCP concentration and the Production Reactor volume used in this analysis are interpolated from the raw values maintained on the server at each of the times at which a Production Reactor CCP concentration measurement was recorded. The use of these interpolated values is a limitation of the available data set. This limitation is considered acceptable, because neither the real-time source CCP concentration nor the real-time Production Reactor volume measured during the fill is directly used to determine the model fit parameters. This aspect of the model fitting approach is described further in Section 5.3.
5.2. TRANSIENT CONCENTRATION PROFILE MODEL DEVELOPMENT
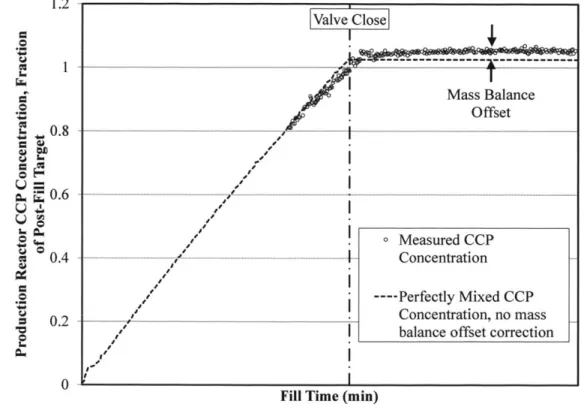
As shown in Figure 7, the measured CCP concentration in the Production Reactor
increases by a non-negligible amount after the flow of concentrate into the Production Reactor is secured. This observation indicates that assuming ideal mixing is inadequate for modeling the transient CCP concentration profile.
A publicly available methodology for modeling the transient concentration profile of a
species during a sustained injection of material into an agitated tank was not identified through the literature review described in Section 3.2, but methods are available to model the transient concentration profile of a pulse of a tracer material injected into a batch stirred tank. For the reasons described in Section 3.2, the KL Model, which is reproduced as Equation (1), is selected for use as the foundation of the model used to simulate the transient CCP concentration profile during the fill.
Because the KL Model is derived for use in describing the transient response of an
in describing the transient behavior associated with a sustained batch injection operation, the physical process of interest in this report. The first step in adapting the KL Model for the intended use is to express it in dimensional form in terms of the variables of interest:
(AV -Xs) 27ro (27r 2\
X(t) = V(t) 1 + 2e T cos -t + 2ue (4)
where Xis the modeled CCP concentration in the Production Reactor, t is time, V is the volume in the Production Reactor, A V is the volume of concentrate entering the Production Reactor, Xs is the source CCP concentration (i.e., the CCP concentration of the concentrate), and the variables contained in the bracketed term are as defined in the explanation of Equation (1). For readability, the definitions of these variables are restated as follows: o2 is the dimensionless variance of the single-pass RTD and T is the mean of the single-pass RTD. It is noted that Equation (4) applies when the time required to inject A V is significantly less than the mean of the single-pass RTD. Conformance with this requirement is confirmed at the end of this section.
It is evident that the first term on the right-hand side (RHS) of Equation (4) represents the steady state CCP concentration after the Production Reactor has mixed to homogeneity (i.e., it is the mass of material entering the Production Reactor resulting from the addition of a finite volume of concentrate divided by the total volume of liquid in the vessel). The bracketed term on the RHS of Equation (4) provides a means of modeling the transient response of the system as it approaches steady state. It also enables the magnitude of the deviation of the transient
concentration from steady state to be modeled using an exponential decay, which is the expected behavior of the system [53]. The system response model exhibits appropriate long-time behavior as the bracketed term approaches unity at long times, thus, the appropriate steady state
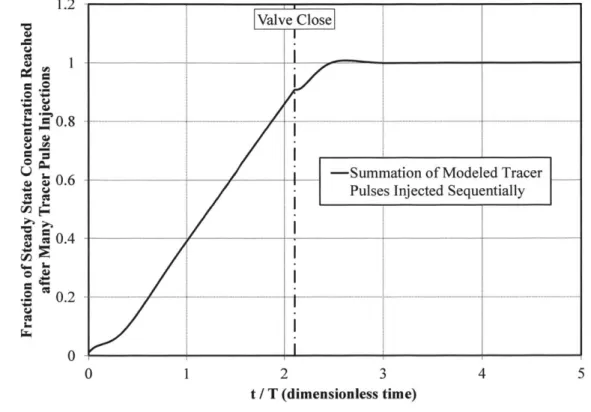
concentration is given by Equation (4) after a sufficiently long mixing period. Equation (4) provides a poorer description of the system at times close to zero. For example, for certain values of the single-pass RTD parameters, the transient CCP concentration modeled using Equation (4) is less than zero, which is nonphysical. Despite this limitation of the system response model, when successive responses are offset from one another and summed together, the aggregate response curve is smooth. The Production Reactor fill operation requires a sufficiently long period of time that this dampening effect is observed. The modeled system response to a series of sequentially injected pulses is shown in Figure 2 to demonstrate this aspect of the model. As
shown in Figure 2, the response to a series of pulses is smooth until the flow of concentrate into the vessel is secured, which is consistent with the behavior of the real system (see Figure 7). Thus, the poorer short-time performance of Equation (4) is acceptable given the intended use of this model. I .2 J 0.8 . S00.4 0 1 2 3 4 5 t / T (dimensionless time)
Figure 2 Example Modeled System Response to Series of Sequentially Injected Tracer Pulses
The next step in adapting the KL Model for use in a sustained injection of liquid into a batch stirred tank is to discretize the entirety of the filling operation into a series of successive "pulse injections" and summing the transient responses given by Equation (4) for each of these pulses. This step is stated mathematically:
(AV -Xs ~ 2M2
X(t) = (AVJXs)i 1 + 2e Tor (t-c -Cos ( (t - ti) + 2 ) (5)
. V(t) 1+T 0)1(5)
where the subscript, i, refers to the ith Production Reactor CCP concentration measurement recorded after the start of the fill operation and the other variables are as previously defined. The physical meanings of the individual terms are described above. Equation (5) simply represents the summation of a number of pulse injections flowing into the Production Reactor in
succession, which in aggregate, provides a representation of the CCP concentration in the
Valve Close
-| -Summation of Modeled Tracer
Pulses Injected Sequentially
Production Reactor as a function of time during a filling operation. The model given by Equation
(5), and subsequent derived versions of Equation (5), is hereafter referred to as the SKL Model
(Summed KL Model).
The decay constant, K, used by Khang and Levenspiel [54] is introduced to simplify Equation (5):
(AV -Xs)i Kti) 21T2)
X(t) =
j
(t) 1 + 2e-K(ttCos(T
(t - ti) + 21ox) (6)K = (7)
T
As described in Section 5.1, the frequency of availability of the CCP concentration probe measurement data is approximately 1% of the mean of the single-pass RTD. This "pulse"
duration as a fraction of the mean of the single-pass RTD is comparable to that achieved in the experiments against which the KL Model was originally validated [55]. It is therefore considered reasonable to use Equation (1) as the basis for the transient response of the system. That is, the "pulse" duration is significantly less than the mean of the single-pass RTD, meaning that it is reasonable to approximate each "discrete" volume injection as a pulse.
5.3. TRANSIENT CONCENTRATION PROFILE MODEL FITTING APPROACH
The adjustable parameters present in Equation (5), the mean, T, and dimensionless variance, a0
2
, of the single-pass RTD, are determined for each of a number of historical
executions of the fill operation by fitting the model given in Equation (5) to historical data. The fit is performed using the Microsoft Excel Solver tool to minimize the sum of the squared differences between the modeled CCP concentration and the measured CCP concentration. This software is selected for use for this task, because it is readily available for use by Amgen
personnel.
To perform the fit, it is assumed that the entirety of the volume of material injected into the Production Reactor during a given interval enters at the start of the interval. For example,
during the interval defined by the start of the fill and the first CCP concentration measurement made during the fill (i.e., the first injected pulse), it is assumed that the volume entering the
14 Ibid.